


Product Monograph - Trulicity (Eli Lilly Canada, 0.75 mg, ..., 4.5 mg)
RECENT MAJOR LABEL CHANGES
| 4.2 Recommended Dose and Dosage Adjustment | |
|---|---|
| 7 Warnings and Precautions, Carcinogenesis and Mutagenesis | |
| 7 Warnings and Precautions, Gastrointestinal | |
| 7 Warnings and Precautions, Peri-Operative Considerations |
TABLE OF CONTENTS
Sections or subsections that are not applicable at the time of authorization are not listed.
RECENT MAJOR LABEL CHANGES ......................................................................................... 2
TABLE OF CONTENTS ............................................................................................................... 2
PART I: HEALTH PROFESSIONAL INFORMATION .................................................................. 4
1 INDICATIONS ................................................................................................................... 4
1.1 Pediatrics ................................................................................................................. 4
1.2 Geriatrics ................................................................................................................. 4
2 CONTRAINDICATIONS ................................................................................................... 4
3 SERIOUS WARNINGS AND PRECAUTIONS BOX ........................................................ 5
4 DOSAGE AND ADMINISTRATION .................................................................................. 5
4.1 Dosing Considerations ............................................................................................ 5
4.2 Recommended Dose and Dosage Adjustment ....................................................... 5
4.4 Administration .......................................................................................................... 5
4.5 Missed Dose ............................................................................................................ 6
5 OVERDOSAGE ................................................................................................................ 6
6 DOSAGE FORMS, STRENGTHS, COMPOSITION AND PACKAGING ......................... 6
7 WARNINGS AND PRECAUTIONS .................................................................................. 7
7.1 Special Populations ................................................................................................. 9
7.1.1 Pregnant Women ............................................................................................... 9
7.1.2 Breast-feeding ................................................................................................... 9
7.1.3 Pediatrics ......................................................................................................... 10
7.1.4 Geriatrics ......................................................................................................... 10
7.1.5 Hepatic Impairment ......................................................................................... 10
7.1.6 Renal Impairment ............................................................................................ 10
7.1.7 Cardiovascular – Patients with Recent Cardiovascular Event ......................... 10
8 ADVERSE REACTIONS ................................................................................................. 11
8.1 Adverse Reaction Overview .................................................................................. 11
8.2 Clinical Trial Adverse Reactions ............................................................................ 11
8.3 Less Common Clinical Trial Adverse Reactions ................................................... 21
8.4 Abnormal Laboratory Findings: Hematologic, Clinical Chemistry and Other Quantitative Data ............................................................................................................ 22
8.5 Post-Market Adverse Reactions ............................................................................ 22
9 DRUG INTERACTIONS .................................................................................................. 22
9.2 Drug Interactions Overview ................................................................................... 22
9.4 Drug-Drug Interactions .......................................................................................... 22
9.5 Drug-Food Interactions .......................................................................................... 25
9.6 Drug-Herb Interactions .......................................................................................... 25
9.7 Drug-Laboratory Test Interactions ......................................................................... 25
10 CLINICAL PHARMACOLOGY ....................................................................................... 25
10.1 Mechanism of Action ....................................................................................... 25
10.2 Pharmacodynamics ......................................................................................... 25
10.3 Pharmacokinetics ............................................................................................ 26
11 STORAGE, STABILITY AND DISPOSAL ...................................................................... 28
12 SPECIAL HANDLING INSTRUCTIONS ......................................................................... 28
PART II: SCIENTIFIC INFORMATION ....................................................................................... 29
13 PHARMACEUTICAL INFORMATION ............................................................................ 29
14 CLINICAL TRIALS ......................................................................................................... 29
14.1 Trial Design and Study Demographics ............................................................ 30
14.2 Study Results .................................................................................................. 32
15 MICROBIOLOGY ............................................................................................................ 44
16 NON-CLINICALTOXICOLOGY ...................................................................................... 44
PATIENT MEDICATION INFORMATION .................................................................................. 46
PART I: HEALTH PROFESSIONAL INFORMATION
1 INDICATIONS
TRULICITY (dulaglutide) is indicated for the once-weekly treatment of adult patients with type 2 diabetes mellitus to improve glycemic control, in combination with:
- diet and exercise in patients for whom metformin is inappropriate due to contraindication or intolerance.
- metformin, when diet and exercise plus maximal tolerated dose of metformin do not achieve adequate glycemic control.
- metformin and a sulfonylurea, when diet and exercise plus dual therapy with metformin and a sulfonylurea do not achieve adequate glycemic control.
- sodium glucose co-transporter 2 inhibitor (SGLT2i) with metformin, when diet and exercise plus SGLT2i with or without metformin do not achieve adequate glycemic control.
- basal insulin with metformin, when diet and exercise plus basal insulin with or without metformin do not achieve adequate glycemic control.
- prandial insulin with metformin, when diet and exercise plus basal or basal-bolus insulin therapy (up to two injections of basal or basal plus prandial insulin per day) with or without oral antihyperglycemic medications, do not achieve adequate glycemic control (see 14 CLINICAL TRIALS).
TRULICITY is indicated as an adjunct to diet, exercise, and standard of care therapy to reduce the risk of non-fatal stroke in adults with type 2 diabetes mellitus who have multiple cardiovascular risk factors or established cardiovascular disease.
TRULICITY is not a substitute for insulin. TRULICITY should not be used in patients with type 1 diabetes mellitus (formerly known as insulin-dependent diabetes mellitus or IDDM) or for the treatment of diabetic ketoacidosis.
1.1 Pediatrics
Pediatrics (<18 years of age): No data are available to Health Canada; therefore, Health Canada has not authorized an indication for pediatric use.
1.2 Geriatrics
Geriatrics (≥65 years of age): No overall differences in safety or efficacy were observed in clinical trial subjects ≥65 years of age compared to younger patients, but greater sensitivity of some older individuals cannot be ruled out (see 4 DOSAGE AND ADMINISTRATION, 7.1.4 Geriatrics, and 10.3 Pharmacokinetics).
2 CONTRAINDICATIONS
- Patients who are hypersensitive to this drug or to any ingredient in the formulation or component of the container. For a complete listing, (see 6 DOSAGE FORMS, STRENGTHS, COMPOSITION AND PACKAGING).
- In patients with a personal or family history of medullary thyroid carcinoma or in patients with Multiple Endocrine Neoplasia syndrome type 2 (MEN 2) (see 7 WARNINGS AND PRECAUTIONS).
- During Pregnancy or in breast-feeding women (see 7.1.1 Pregnant Women and 7.1.2 Breast-feeding).
3 SERIOUS WARNINGS AND PRECAUTIONS BOX
Serious Warnings and Precautions
|
|---|
4 DOSAGE AND ADMINISTRATION
4.1 Dosing Considerations
- When initiating Trulicity, consider reducing the dose of concomitantly administered insulins and insulin secretagogues (such as sulfonylureas) to reduce the risk of hypoglycemia (see 7 WARNINGS AND PRECAUTIONS and 8 ADVERSE REACTIONS).
4.2 Recommended Dose and Dosage Adjustment
- The recommended initiating dose of Trulicity is 0.75 mg once weekly, administered subcutaneously. The dose may be increased to 1.5 mg once weekly for additional glycemic control.
- If additional glycemic control is needed, the dose may be increased to 3 mg once weekly after at least 4 weeks on the 1.5 mg dose. If additional glycemic control is needed, the dose may be increased to a maximum of 4.5 mg once weekly after at least 4 weeks on the 3 mg dose.
- Renal Insufficiency: No dose adjustment is required in patients with renal impairment (see 10.3 Pharmacokinetics). Monitor renal function in patients with renal impairment reporting severe gastrointestinal reactions which may worsen the renal function.
- Hepatic Insufficiency: There is a limited experience in patients with mild, moderate, or severe hepatic impairment. Therefore, Trulicity should be used with caution in these patient populations (see 10.3 Pharmacokinetics). No dose adjustment is required in patients with hepatic insufficiency.
- Geriatrics (≥65 years): No dose adjustment is required in patients over 65 years of age (see 7.1.4 Geriatrics and 10.3 Pharmacokinetics).
- Pediatrics (<18 years): Health Canada has not authorized an indication for pediatric use (see 7.1.3 Pediatrics).
4.4 Administration
Trulicity can be administered any time of day, with or without meals, and should be injected subcutaneously in the abdomen, thigh, or upper arm. Patients may have help from another person for injection in the upper arm.
Trulicity should be administered subcutaneously with no dilution.
Trulicity solution should be inspected prior to each injection, and the solution should be used only if it is clear, colourless, and contains no particles.
Trulicity and insulin should not be mixed in the same syringe, and must be administered as two separate injections in two different injection sites.
4.5 Missed Dose
If a dose is missed, it should be administered as soon as possible if there are at least 3 days (72 hours) until the next scheduled dose. If less than 3 days remain before the next scheduled dose, the missed dose should be skipped and the next dose should be administered on the regularly scheduled day. In each case, patients can then resume their regular once weekly dosing schedule.
Changing Weekly Dosing Schedule
The day of weekly administration can be changed, if necessary, as long as the last dose was administered 3 days (72 hours) or more before.
5 OVERDOSAGE
Overdoses have been reported in clinical studies. Effects associated with these overdoses were primarily mild or moderate gastrointestinal events (e.g., nausea, vomiting) and non-severe hypoglycemia. In the event of overdose, appropriate supportive care (including frequent plasma glucose monitoring) should be initiated according to the patient’s clinical signs and symptoms.
| For management of a suspected drug overdose, contact your regional poison control centre. |
|---|
6 DOSAGE FORMS, STRENGTHS, COMPOSITION AND PACKAGING
Table 1 – Dosage Forms, Strengths, Composition and Packaging
Trulicity is packaged in a cardboard outer carton and is available in packs of 2 or 4 single-use, prefilled pens. Not all pack sizes and presentations may be marketed.
Single-Use, Prefilled Pen – 0.75 mg / 0.5 mL
Each single-use, prefilled pen provides 0.75 mg Trulicity per 0.5 mL of solution.
Single-Use, Prefilled Pen – 1.5 mg / 0.5 mL
Each single-use, prefilled pen provides 1.5 mg Trulicity per 0.5 mL of solution.
Single-Use, Prefilled Pen – 3 mg / 0.5 mL
Each single-use, prefilled pen provides 3 mg Trulicity per 0.5 mL of solution.
Single-Use, Prefilled Pen – 4.5 mg / 0.5 mL
| Route of Administration | Dosage Form / Strength/Composition | Non-medicinal Ingredients |
| Subcutaneous | Solution for injection, 0.75 mg/0.5 mL, 1.5 mg/0.5 mL, 3 mg/0.5 mL and 4.5 mg/0.5 mL | citric acid anhydrous, mannitol, polysorbate 80, and trisodium citrate dihydrate in water for injection. |
Each single-use, prefilled pen provides 4.5 mg Trulicity per 0.5 mL of solution.
7 WARNINGS AND PRECAUTIONS
General
Trulicity should not be used in patients with type 1 diabetes mellitus or for the treatment of patients with diabetic ketoacidosis.
Trulicity should not be administered intramuscularly.
Carcinogenesis and Mutagenesis
Risk of Thyroid C-cell Tumors
In both genders of rats in a two-year carcinogenicity study, dulaglutide caused a dose-related and treatment-duration dependent increase in the incidence of thyroid C-cell tumors (adenomas/carcinomas) at ≥3-fold the maximum recommended human dose (MRHD) of 4.5 mg per week based on area under the time-concentration curve (AUC) compared to controls (see 16 NON-CLINICAL TOXICOLOGY). A statistically significant increase in C-cell adenomas was observed in rats of both genders receiving dulaglutide at ≥3 times the human exposure. Numerical increases in C-cell carcinomas occurred at 24 times the MRHD based on AUC and were considered to be treatment related despite the absence of statistical significance. Dulaglutide did not produce increased incidences of thyroid C-cell tumors in a rasH2 transgenic mouse model of carcinogenicity.
It is unknown whether Trulicity will cause thyroid C-cell tumors, including medullary thyroid cancer (MTC), in humans, as the human relevance of dulaglutide-induced rodent thyroid C-cell tumors could not be determined by clinical or nonclinical studies.
One (1) case of MTC was reported in a patient treated with Trulicity. The patient with MTC had a markedly elevated calcitonin value at baseline, 8 times the upper limit of normal (ULN), suggesting pre-existing disease. This patient subsequently tested positive for a known RET (rearranged during transfection) proto-oncogene mutation.
Trulicity is contraindicated in patients with a personal or family history of MTC or in patients with MEN 2. The clinical value of routine monitoring of serum calcitonin has not been established.
Patients should be counseled regarding the risk for MTC and the symptoms of thyroid tumours (e.g. a mass in the neck, dysphagia, dyspnea or persistent hoarseness).
Cardiovascular
Heart Rate Increase
Trulicity causes an increase in heart rate (see 8.2 Clinical Trial Adverse Reactions, 10.2 Pharmacodynamics). Increases in heart rate may lead to worsening of cardiac conditions in patients with a history of ischemic heart disease or tachyarrhythmias. Caution should be observed in these patient populations.
PR Interval Prolongation
Trulicity causes a prolongation of the PR interval of the electrocardiogram (see 8.2 Clinical Trial Adverse Reactions, 10.2 Pharmacodynamics). Prolongation of the PR interval has also been associated with an increased risk of incident atrial fibrillation; therefore, caution is warranted in patients with a history of atrial fibrillation. Caution should be observed in patients with underlying structural heart disease, pre-existing conduction system abnormalities, ischemic heart disease, or cardiomyopathies, as these patients may be at increased risk for developing cardiac conduction abnormalities.
Driving and Operating Machinery
No studies on the effects on ability to drive and use machines have been performed. When dulaglutide is used in combination with a sulfonylurea or insulin, patients should be advised to take precautions to avoid hypoglycemia while driving and using machines.
Endocrine and Metabolism
Hypoglycemia
Patients receiving Trulicity in combination with an insulin secretagogue (for example, a sulfonylurea) or insulin may have an increased risk of hypoglycemia. The risk of hypoglycemia may be lowered by a reduction in the dose of the insulin secretagogue or insulin (see 8.2 Clinical Trial Adverse Reactions).
Gastrointestinal
Severe Gastrointestinal Disease
Use of GLP-1 receptor agonists may be associated with gastrointestinal adverse reactions (see 8.2 Clinical Trial Adverse Reactions). Trulicity has not been studied in patients with severe gastrointestinal disease, including severe gastroparesis and is therefore not recommended in these patients.
Events related to impaired gastric emptying, including severe gastroparesis, have been reported. Monitor and consider dose modification or discontinuation in patients who develop severe gastrointestinal symptoms while on treatment.
In placebo-controlled clinical trials, gastrointestinal events were more frequently reported for Trulicity compared to placebo and included nausea, diarrhea, and vomiting (see 8.2 Clinical Trial Adverse Reactions).
Hepatic/Biliary/Pancreatic
Pancreatitis
Pancreatitis has been reported with GLP-1 receptor agonists, including Trulicity (see 8.2 Clinical Trial Adverse Reactions ). After initiation of Trulicity, observe patients carefully for signs and symptoms of pancreatitis, including persistent severe abdominal pain. If pancreatitis is suspected, Trulicity and other suspect medications should be discontinued promptly, confirmatory tests should be performed and appropriate management should be initiated. If pancreatitis is confirmed, Trulicity should not be restarted. Trulicity has not been studied in patients with a prior history of pancreatitis. Consider other antidiabetic therapies in patients with a history of pancreatitis.
Immune
Hypersensitivity Reactions
Systemic hypersensitivity adverse reactions, sometimes severe (e.g., severe urticaria, systemic rash, facial edema, lip swelling) occurred in 0.5% of patients on Trulicity in the four Phase 2 and five Phase 3 studies that assessed the 0.75 mg and 1.5 mg doses. There have been postmarketing reports of serious hypersensitivity reactions (e.g., anaphylactic reactions and angioedema) in patients treated with Trulicity. If a hypersensitivity reaction occurs, discontinue use of Trulicity and other suspect medications and promptly seek medical advice. Trulicity should not be used following a hypersensitivity reaction (see 2 CONTRAINDICATIONS).
Angioedema has also been reported with other GLP-1 receptor agonists. Use caution in a patient with a history of angioedema with another GLP-1 receptor agonist because it is unknown whether such patients will be predisposed to angioedema with Trulicity.
Monitoring and Laboratory Tests
Response to all diabetic therapies should be monitored by periodic measurements of blood glucose and HbA1c levels, with a goal of decreasing these levels towards the normal range. HbA1c is especially useful for evaluating long-term glycemic control. Regular self-monitoring of blood glucose is not needed in order to adjust the dose of Trulicity. However, when initiating treatment with Trulicity in combination with a sulfonylurea or insulin, blood glucose self-monitoring may become necessary to reduce the dose of the sulfonylurea or insulin in order to reduce the risk of hypoglycemia.
Peri-Operative Considerations
Aspiration during General Anesthesia or Deep Sedation
Trulicity delays gastric emptying. Pulmonary aspiration has been reported in patients receiving long-acting GLP-1 receptor agonists undergoing general anesthesia or deep sedation. This should be considered prior to such procedures.
Renal
Use of GLP-1 receptor agonists may be associated with gastrointestinal adverse reactions, which include nausea, vomiting, and diarrhea. These events may lead to dehydration, which could cause a deterioration in renal function including acute renal failure.
Patients treated with Trulicity should be advised of the potential risk of dehydration and take precautions to avoid fluid depletion.
7.1 Special Populations
7.1.1 Pregnant Women
No clinical trials in pregnant women have been conducted. Studies in animals have shown reproductive and developmental toxicity, including teratogenicity (see 16 NON-CLINICAL TOXICOLOGY).
Trulicity should not be used during pregnancy (see 2 CONTRAINDICATIONS). If a patient wishes to become pregnant, Trulicity should be discontinued at least 1 month before due to the long wash out period for Trulicity.
7.1.2 Breast-feeding
It is not known whether Trulicity is excreted into human milk during lactation. Decreased body weight in offspring was observed in mice treated with Trulicity during gestation and lactation (see 16 NON-CLINICAL TOXICOLOGY). Because of the potential tumorigenicity shown for GLP-1 receptor agonists in rodent studies, women who are nursing should discontinue Trulicity treatment.
7.1.3 Pediatrics
Pediatrics (<18 years of age): No data are available to Health Canada; therefore, Health Canada has not authorized an indication for pediatric use.
7.1.4 Geriatrics
Geriatrics (≥65 years of age):
Across nine Phase 2 and 3 clinical studies with Trulicity, a total of 990 (16.5%) patients were ≥65 to <75 years, 115 (1.9%) were ≥75 to <85 years, and 3 (<0.1%) were ≥85 years of age. No overall differences in safety or efficacy were observed between these patients and younger patients, but greater sensitivity of some older individuals cannot be ruled out.
In the REWIND cardiovascular outcomes trial with Trulicity, a total of 2619 (52.9%) patients were ≥65 years of age, and 484 (9.8%) patients were ≥75 years of age at baseline in the 1.5 mg treatment arm (see 14.2 Study Results). No overall differences in safety or efficacy were observed based on age.
7.1.5 Hepatic Impairment
There is limited clinical experience in patients with mild, moderate, or severe hepatic impairment. Therefore, Trulicity should be used with caution in these patient populations.
7.1.6 Renal Impairment
In patients treated with GLP-1 receptor agonists, there have been postmarketing reports of acute renal failure and worsening of chronic renal failure, which may sometimes require hemodialysis. Some of these events were reported in patients without known underlying renal disease. A majority of reported events occurred in patients who had experienced nausea, vomiting, diarrhea, or dehydration.
Because these reactions may worsen renal function, use caution when initiating or escalating doses of Trulicity in patients with renal impairment. Monitor renal function in patients with renal impairment reporting severe adverse gastrointestinal reactions.
There is limited clinical experience in patients with end-stage renal disease (ESRD) (estimated glomerular filtration rate [eGFR] <15 mL/min/1.73 m2). Trulicity should be used with caution in this patient population.
In the Trulicity 1.5 mg arm of the REWIND trial (see 14.2 Study Results), 2435 (50.2%) patients had mild renal impairment, 1031 (21.2%) patients had moderate renal impairment, and 50 (1.0%) patients had severe renal impairment at baseline. Safety and efficacy analyses compared patients with moderate to severe renal impairment (eGFR <60 mL/min/1.73 m2) to patients with mild or no renal impairment (eGFR ≥ 60 mL/min/1.73 m2). No overall differences in safety or efficacy were observed between these 2 subgroups.
7.1.7 Cardiovascular – Patients with Recent Cardiovascular Event
In clinical trials of Trulicity, subjects with an acute coronary or cerebrovascular event, within the 2 months prior to randomization, were not studied. Therefore, Trulicity should be used with caution in this population.
8 ADVERSE REACTIONS
8.1 Adverse Reaction Overview
The most frequently reported treatment-emergent adverse events (TEAEs) in clinical trials were gastrointestinal events, including nausea, diarrhea, and vomiting. The adverse events most frequently leading to discontinuation for Trulicity in clinical trials were diarrhea (≤2.6%), nausea (<2%), and vomiting (<2%).
In the completed phase 2 and phase 3 studies to support the initial registration of Trulicity 0.75 mg and 1.5 mg, the incidence of serious adverse events (SAEs) was 3.9% for patients treated with Trulicity 0.75 mg, 4.4% for patients treated with Trulicity 1.5 mg and 4.4% for patients treated with placebo through 26 weeks. In a phase 3 study with Trulicity 1.5, 3.0 and 4.5 mg, the incidence of SAEs was 8.3%, 6.8% and 6.2% respectively through 52 weeks.
The following adverse events are described below or elsewhere in the Product Monograph (see 7 WARNINGS and PRECAUTIONS):
- Risk of Thyroid C-cell Tumors
- Heart Rate Increase
- PR Interval Prolongation
- Hypoglycemia
- Severe Gastrointestinal Disease
- Pancreatitis
- Hypersensitivity Reactions
- Aspiration during General Anesthesia or Deep Sedation
- Renal
8.2 Clinical Trial Adverse Reactions
Clinical trials are conducted under very specific conditions. The adverse reaction rates observed in the clinical trials; therefore, may not reflect the rates observed in practice and should not be compared to the rates in the clinical trials of another drug. Adverse reaction information from clinical trials may be useful in identifying and approximating rates of adverse drug reactions in real-world use.
Studies with 0.75 mg and 1.5 mg dose levels:
The safety of Trulicity in patients with type 2 diabetes mellitus was evaluated across nine Phase 2 and 3 clinical trials to support the initial registration of Trulicity 0.75 mg and 1.5 mg, including a total of 4006 patients (for 3531 patient-years) who received Trulicity. A total of 3045 patients received Trulicity for at least 24 weeks, with 2279 patients continuing treatment through at least 50 weeks. A total of 369 patients were treated with Trulicity for approximately 2 years.
Table 2 provides a listing of the treatment-emergent adverse events reported with a frequency of ≥1% and occurring more frequently in Trulicity-treated adult patients with type 2 diabetes in placebo- or active-controlled phase 3 trials.
Table 2: Treatment Emergent Adverse Events Occurring in >1% in Either Trulicity Group and Occurring More Frequently with Trulicity up to 104 Weeks
| Adverse Event | Trulicitya | Placeboa (N = 568) n (%) | Trulicityb | All Comparatorsb (N = 1844) n (%) | ||||||||||||||||||
|---|---|---|---|---|---|---|---|---|---|---|---|---|---|---|---|---|---|---|---|---|---|---|
0.75 mg (N = 836) n (%) | 1.5 mg (N = 834) n (%) | 0.75 mg (N = 1671) n (%) | 1.5 mg (N = 1671) n (%) | |||||||||||||||||||
| Blood and Lymphatic System Disorders | ||||||||||||||||||||||
| Anemia | 7 (0.8) | 10 (1.2) | 3 (0.5) | 21 (1.3) | 22 (1.3) | 20 (1.1) | ||||||||||||||||
| Cardiac Disorders | ||||||||||||||||||||||
| Angina pectoris | - | - | - | 16 (1.0) | 5 (0.3) | 16 (0.9) | ||||||||||||||||
| Palpitations | - | - | - | 19 (1.1) | 8 (0.5) | 13 (0.7) | ||||||||||||||||
| Ear and Labyrinth Disorders | ||||||||||||||||||||||
| Vertigo | - | - | - | 17 (1.0) | 12 (0.7) | 11 (0.6) | ||||||||||||||||
| Gastrointestinal Disorders | ||||||||||||||||||||||
| Nausea | 104 (12.4) | 176 (21.1) | 30 (5.3) | 216 (12.9) | 355 (21.2) | 180 (9.8) | ||||||||||||||||
| Diarrheac | 74 (8.9) | 105 (12.6) | 38 (6.7) | 179 (10.7) | 229 (13.7) | 143 (7.8) | ||||||||||||||||
| Vomitingd | 50 (6.0) | 106 (12.7) | 13 (2.3) | 115 (6.9) | 193 (11.5) | 78 (4.2) | ||||||||||||||||
| Constipatione | 33 (3.9) | 31 (3.7) | 4 (0.7) | 59 (3.5) | 82 (4.9) | 23 (1.2) | ||||||||||||||||
| Abdominal distension | 24 (2.9) | 19 (2.3) | 4 (0.7) | 49 (2.9) | 42 (2.5) | 24 (1.3) | ||||||||||||||||
| Dyspepsia | 34 (4.1) | 48 (5.8) | 13 (2.3) | 68 (4.1) | 115 (6.9) | 60 (3.3) | ||||||||||||||||
| Abdominal painf | 54 (6.5) | 78 (9.4) | 28 (4.9) | 123 (7.4) | 171 (10.2) | 105 (5.7) | ||||||||||||||||
| Flatulence | 12 (1.4) | 28 (3.4) | 8 (1.4) | 23 (1.4) | 43 (2.6) | 17 (0.9) | ||||||||||||||||
| Gastritis | - | - | - | 21 (1.3) | 25 (1.5) | 25 (1.4) | ||||||||||||||||
| Eructation | 5 (0.6) | 13 (1.6) | 1 (0.2) | 16 (1.0) | 23 (1.4) | 7 (0.4) | ||||||||||||||||
| Hyperchlorhydria | 6 (0.7) | 10 (1.2) | 1 (0.2) | 9 (0.5) | 17 (1.0) | 4 (0.2) | ||||||||||||||||
| Gastroesophage al reflux disease | 14 (1.7) | 17 (2.0) | 3 (0.5) | 33 (2.0) | 27 (1.6) | 30 (1.6) | ||||||||||||||||
| General Disorders and Administration Site Conditions | ||||||||||||||||||||||
| Fatigueg | 35 (4.2) | 47 (5.6) | 15 (2.6) | 70 (4.2) | 89 (5.3) | 79 (4.3) | ||||||||||||||||
| Pain | 9 (1.1) | 6 (0.7) | 5 (0.9) | 21 (1.3) | 12 (0.7) | 16 (0.9) | ||||||||||||||||
| Edema peripheral | 18 (2.2) | 5 (0.6) | 11 (1.9) | 40 (2.4) | 27 (1.6) | 42 (2.3) | ||||||||||||||||
| Non-cardiac chest pain | - | - | - | 27 (1.6) | 22 (1.3) | 29 (1.6) | ||||||||||||||||
| Injection site haematoma | 9 (1.1) | 4 (0.5) | 2 (0.4) | - | - | - | ||||||||||||||||
| Adverse Event | Trulicitya | Placeboa (N = 568) n (%) | Trulicityb | All Comparatorsb (N = 1844) n (%) | ||||||||||||||||||
|---|---|---|---|---|---|---|---|---|---|---|---|---|---|---|---|---|---|---|---|---|---|---|
0.75 mg (N = 836) n (%) | 1.5 mg (N = 834) n (%) | 0.75 mg (N = 1671) n (%) | 1.5 mg (N = 1671) n (%) | |||||||||||||||||||
| Hepatobiliary Disorders | ||||||||||||||||||||||
| Hepatic steatosis | - | - | - | 14 (0.8) | 19 (1.1) | 13 (0.7) | ||||||||||||||||
| Infections and Infestations | ||||||||||||||||||||||
| Upper respiratory tract infectionh | 110 (13.2) | 115 (13.8) | 66 (11.6) | - | - | - | ||||||||||||||||
| Gastroenteritis | 5 (0.6) | 14 (1.7) | 3 (0.5) | 30 (1.8) | 44 (2.6) | 34 (1.8) | ||||||||||||||||
| Urinary tract infection | 32 (3.8) | 35 (4.2) | 21 (3.7) | 85 (5.1) | 80 (4.8) | 89 (4.8) | ||||||||||||||||
| Influenza | 22 (2.6) | 17 (2.0) | 10 (1.8) | 80 (4.8) | 69 (4.1) | 68 (3.7) | ||||||||||||||||
| Bronchitis | 9 (1.1) | 10 (1.2) | 6 (1.1) | - | - | - | ||||||||||||||||
| Pneumonia | - | - | - | 19 (1.1) | 13 (0.8) | 14 (0.8) | ||||||||||||||||
| Sinusitis | 15 (1.8) | 13 (1.6) | 10 (1.8) | 41 (2.5) | 40 (2.4) | 45 (2.4) | ||||||||||||||||
| Cystitis | - | - | - | 17 (1.0) | 10 (0.6) | 16 (0.9) | ||||||||||||||||
| Injury, Poisoning and Procedural Complications | ||||||||||||||||||||||
| Ligament sprain | 6 (0.7) | 8 (1.0) | 1 (0.2) | - | - | - | ||||||||||||||||
| Investigations | ||||||||||||||||||||||
| Pancreatic Hyperenzymemi ai | 26 (3.1) | 37 (4.4) | 16 (2.8) | 71 (4.2) | 80 (4.8) | 59 (3.2) | ||||||||||||||||
| Weight decreased | 3 (0.4) | 17 (2.0) | 1 (0.2) | 5 (0.3) | 21 (1.3) | 4 (0.2) | ||||||||||||||||
| Metabolic and Nutrition Disorders | ||||||||||||||||||||||
| Decreased appetite | 41 (4.9) | 72 (8.6) | 9 (1.6) | 85 (5.1) | 129 (7.7) | 39 (2.1) | ||||||||||||||||
| Dyslipidemia | 5 (0.6) | 9 (1.1) | 5 (0.9) | 22 (1.3) | 31 (1.9) | 21 (1.1) | ||||||||||||||||
| Musculoskeletal and Connective Tissue Disorders | ||||||||||||||||||||||
| Pain in extremity | - | - | - | 57 (3.4) | 50 (3.0) | 55 (3.0) | ||||||||||||||||
| Arthralgia | 26 (3.1) | 22 (2.6) | 17 (3.0) | 67 (4.0) | 47 (2.8) | 74 (4.0) | ||||||||||||||||
| Back pain | - | - | - | 78 (4.7) | 65 (3.9) | 87 (4.7) | ||||||||||||||||
| Osteoarthritis | - | - | - | 19 (1.1) | 21 (1.3) | 24 (1.3) | ||||||||||||||||
| Nervous System Disorders | ||||||||||||||||||||||
| Headache | 50 (6.0) | 67 (8.0) | 40 (7.0) | 111 (6.6) | 133 (8.0) | 140 (7.6) | ||||||||||||||||
| Dizziness | 31 (3.7) | 31 (3.7) | 13 (2.3) | - | - | - | ||||||||||||||||
| Sciatica | 5 (0.6) | 3 (0.4) | 3 (0.5) | 18 (1.1) | 13 (0.8) | 16 (0.9) | ||||||||||||||||
| Hypoesthesia | - | - | - | 7 (0.4) | 17 (1.0) | 14 (0.8) | ||||||||||||||||
| Psychiatric Disorders | ||||||||||||||||||||||
| Insomnia | 6 (0.7) | 14 (1.7) | 7 (1.2) | 11 (0.7) | 27 (1.6) | 27 (1.5) | ||||||||||||||||
| Adverse Event | Trulicitya | Placeboa (N = 568) n (%) | Trulicityb | All Comparatorsb (N = 1844) n (%) | |||||||||||||||||
|---|---|---|---|---|---|---|---|---|---|---|---|---|---|---|---|---|---|---|---|---|---|
0.75 mg (N = 836) n (%) | 1.5 mg (N = 834) n (%) | 0.75 mg (N = 1671) n (%) | 1.5 mg (N = 1671) n (%) | ||||||||||||||||||
| Anxiety | 8 (1.0) | 3 (0.4) | 4 (0.7) | 21 (1.3) | 13 (0.8) | 19 (1.0) | |||||||||||||||
| Renal and Urinary Disorders | |||||||||||||||||||||
| Nephrolithiasis | 8 (1.0) | 10 (1.2) | 4 (0.7) | 14 (0.8) | 16 (1.0) | 12 (0.7) | |||||||||||||||
| Diabetic nephropathy | 0 (0.0) | 8 (1.0) | 2 (0.4) | - | - | - | |||||||||||||||
| Respiratory, Thoracic and Mediastinal Disorders | |||||||||||||||||||||
| Cough | - | - | - | 49 (2.9) | 61 (3.7) | 62 (3.4) | |||||||||||||||
| Sinus congestion | 5 (0.6) | 9 (1.1) | 3 (0.5) | - | - | - | |||||||||||||||
| Vascular Disorders | |||||||||||||||||||||
| Hypertension | - | - | - | 42 (2.5) | 50 (3.0) | 55 (3.0) | |||||||||||||||
a Includes placebo-controlled studies of 26 weeks planned treatment period. Mean duration of exposure: 24.1 weeks for Trulicity 0.75 mg, 23.5 weeks for Trulicity 1.5 mg and 22.8 weeks for placebo.
b Includes all studies of at least 26-weeks and up to 104-weeks planned treatment period, including the placebo-controlled studies. Mean duration of exposure: 52.5 weeks for Trulicity 0.75 mg, 51.4 weeks for Trulicity 1.5 mg and 54.0 weeks for all comparators.
c Diarrhea: includes adverse events of diarrhea and frequent bowel movements.
d Vomiting: includes adverse events of vomiting, retching and vomiting projectile.
e Constipation: includes adverse events of constipation and infrequent bowel movements.
f Abdominal Pain: includes adverse events of abdominal pain upper, abdominal pain, abdominal discomfort, abdominal pain lower, abdominal tenderness, or gastrointestinal pain.
g Fatigue: includes adverse events of fatigue, asthenia, and malaise.
h Upper Respiratory Tract Infection: includes adverse events of nasopharyngitis, upper respiratory tract infection, pharyngitis, nasal congestion, rhinorrhoea, and rhinitis.
i Pancreatic Hyperenzymemia: includes adverse events of lipase increased, amylase increased, pancreatic enzymes increased, hyperlipasaemia, hyperamylasaemia, pancreatic enzyme abnormal, and lipase abnormal.
In combination with metformin:
In Study GBDE, a 26-week combination study of Trulicity plus metformin versus liraglutide plus metformin, the incidence of TEAEs was 61.9% for patients who received Trulicity 1.5 mg once weekly and 63.0% for patients who received liraglutide 1.8 mg once daily. The 3 most frequently reported TEAEs overall through Week 26 were nausea, diarrhea, and headache.
The incidence of patients discontinuing the study or study drug due to adverse events was 6.0% in both the Trulicity and liraglutide treatment groups. The most common gastrointestinal events resulting in discontinuation of the drug and/or study were nausea (Trulicity, 1.7%; liraglutide, 1.7%) and diarrhea (Trulicity, 0.7%; liraglutide, 1.3%).
In total, 16 (2.7%) patients (Trulicity, 5 [1.7%]; and liraglutide, 11 [3.7%]) experienced ≥1 SAE through Week 26.
In combination with basal insulins with/without metformin:
In Study GBDI, a 28-week combination study of Trulicity plus titrated basal insulin with/without metformin versus placebo plus titrated basal insulin with/without metformin, the incidence of TEAEs was 64.0% for patients who received Trulicity 1.5 mg once weekly and 50.0% for patients who received placebo once weekly. The 3 most frequently reported TEAEs for Trulicity through Week 28 were nausea (12.0%), diarrhea (11.3%), and upper respiratory tract infection (7.3%).
The incidence of patients discontinuing the study due to adverse events was 4.0% in the Trulicity group and 1.3% in the placebo treatment group. The most common gastrointestinal events resulting in discontinuation were diarrhea (Trulicity, 1.3%; placebo, 0.0%), abdominal discomfort (Trulicity, 0.7%; placebo, 0.0%), gastritis (Trulicity, 0.7%; placebo, 0.0%), vomiting (Trulicity, 0.7%; placebo, 0.0%), and nausea (Trulicity 0.0%; placebo 0.7%).
In total, 16/300 patients (Trulicity, 9/150 [6.0%]; and placebo, 7/150 [4.7%]) experienced ≥1 SAE through Week 28.
In combination with meal-time insulin in Patients with CKD:
In Study GBDX, a 52-week combination study of Trulicity plus titrated insulin lispro versus titrated insulin glargine plus titrated insulin lispro in patients with moderate to severe CKD (eGFR <60 and ≥15 mL/min/1.73 m2), the incidence of TEAEs was 88.4%, 89.6%, and 81.4% for patients who received Trulicity 0.75 mg once weekly, Trulicity 1.5 mg once weekly, and titrated insulin glargine daily, respectively. The most frequently reported TEAEs overall through Week 52 were blood creatinine increased (40.3%), diarrhea (13.4%), nausea (12.8%), and glomerular filtration rate decreased (10.4%).
The incidence of patients discontinuing the study or study drug due to adverse events was 10.0%, 12.5%, and 6.2% for patients receiving Trulicity 0.75 mg once weekly, Trulicity 1.5 mg once weekly, and titrated insulin glargine daily, respectively. The three most common gastrointestinal events resulting in discontinuation of the drug and/or study were diarrhea (Trulicity 0.75 mg once weekly 1.1%, Trulicity 1.5 mg once weekly 2.6%, titrated insulin glargine 0%), nausea (Trulicity 0.75 mg once weekly 0.5%, Trulicity 1.5 mg once weekly 1.6%, titrated insulin glargine 0%) and vomiting (Trulicity 0.75 mg once weekly 0.5%, Trulicity 1.5 mg once weekly 1.6%, titrated insulin glargine 0%).
In total, 135 (23.4%) patients (Trulicity 0.75 mg once weekly, 45 [23.7%]; Trulicity 1.5 mg once weekly, 38 [19.8%]; and titrated insulin glargine, 52 [26.8%]) experienced ≥1 SAE through Week 52.
In combination with SGLT2 inhibitors with/without metformin:
In Study GBGE, a 24-week combination study of Trulicity versus placebo, both as add-on to sodium glucose co-transporter 2 inhibitor (SGLT2i) therapy with or without metformin (≥1500 mg/day), the incidence of TEAEs was 58.9 %, 66.9%, and 57.9% for patients who received Trulicity 0.75 mg once weekly, Trulicity 1.5 mg once weekly, and patients who received placebo, respectively. The most frequently reported TEAEs overall through Week 24 were back pain (8.3%), nausea (7.8%), viral upper respiratory infection (6.6%), diarrhea (6.1%), and headache (6.1%).
The incidence of patients discontinuing the study or study drug due to adverse events was 0.7%, 4.9%, and 0.7% for patients receiving Trulicity 0.75 mg once weekly, Trulicity 1.5 mg once weekly, and placebo, respectively. Five patients on Trulicity 1.5 mg once weekly discontinued study or study drug due to GI adverse events (nausea 2 patients, abdominal pain 2 patients, abdominal distention 1 patient).
In total, 14 (3.3%) patients who received study drug (Trulicity 0.75 mg once weekly, 4 [2.8%]; Trulicity 1.5 mg once weekly, 5 [3.5%]; and placebo, 5 [3.6%]) experienced ≥1 SAE through Week 24. One patient randomized to Trulicity 0.75 mg had a SAE but never received study drug.
In combination with oral antihyperglycemic medications with or without insulin:
In Study GBDJ (REWIND), a long-term (median duration of follow-up was 5.4 years; median treatment duration was 5.2 years) cardiovascular (CV) event-driven study of Trulicity versus placebo, both added to standard of care, the incidence of TEAEs was 92.4% for patients who received Trulicity 1.5 mg once weekly and 91.6% for patients who received placebo once weekly. The 3 most frequently reported TEAEs for Trulicity were nausea (14.9%), diarrhea (13.6%), and urinary tract infection (12.0%).
The incidence of patients permanently discontinuing the study drug due to adverse events was 9.1% in the Trulicity group and 6.3% in the placebo group. The difference was primarily due to the higher incidence of gastrointestinal AEs leading to study drug discontinuation in the Trulicity study arm. The most common gastrointestinal events resulting in discontinuation of study drug were nausea (Trulicity 1.3%; placebo 0.1%). diarrhea (Trulicity 0.7%; placebo 0.2%), vomiting (Trulicity 0.6%; placebo 0.1%), dyspepsia (Trulicity 0.2%; placebo 0.0%).
In total, 4053 patients (Trulicity, 1997 [40.4%]; and placebo, 2056 [41.5%]) experienced ≥1 SAE.
Study with 1.5 mg, 3.0 mg, and 4.5 mg dose levels with metformin:
In Study GBGL, a parallel arm double blind 52-week study, patients were randomized to Trulicity 1.5 mg, 3 mg, or 4.5 mg once weekly, as add-on to metformin. The incidence of TEAEs through 52 weeks was 62.1%, 62.3%, and 66.4%, respectively. The 3 most frequently reported TEAEs overall were nausea, diarrhea, and vomiting. The incidence of nausea was 14.2%, 16.1% and 17.3% for patients who received Trulicity 1.5 mg, 3 mg, or 4.5 mg, respectively. The incidence of diarrhea was 7.7%, 12.0%, and 11.6%; and the incidence of vomiting was 6.4%, 9.1% and 10.1%, for patients who received Trulicity 1.5 mg, 3 mg, or 4.5 mg, respectively.
The incidence of patients permanently discontinuing TRULICLITY 1.5 mg, 3 mg and 4.5 mg once weekly due to adverse events was 6.0%, 7.0%, and 8.5%, respectively. The incidence of treatment discontinuation for Trulicity 1.5 mg, 3 mg and 4.5 mg due to nausea was 1.3%,1.3%, and 1.5%. The incidence of treatment discontinuation for Trulicity 1.5 mg, 3 mg and 4.5 mg due to diarrhea was 0.2%,1.0%, and 1.0%. The incidence of treatment discontinuation for Trulicity 1.5 mg, 3 mg and 4.5 mg due to vomiting was 0%, 0.8%, and 1.3%.
In total 131 patients, Trulicity 1.5 mg (51 [8.3%] patients), 3 mg (42 [6.8%] patients), and 4.5 mg (38 [6.2%] patients) experienced ≥1 SAE through 52 weeks.
There are no data for the use of Trulicity 3 mg and 4.5 mg doses in conjunction with antidiabetic medications other than metformin.
Cardiovascular
Heart Rate Increase
Trulicity 0.75 mg and 1.5 mg were associated with mean increases in heart rate of 2 to 4 beats per minute (bpm) (see 7 WARNINGS AND PRECAUTIONS, 9.4 Drug-Drug Interactions, and 10.2 Pharmacodynamics).
Adverse reactions of sinus tachycardia were reported in 3.0%, 2.8%, and 5.6% of patients treated with placebo, Trulicity 0.75 mg and Trulicity 1.5 mg, respectively. Persistence of sinus tachycardia (reported at more than 2 visits) was reported in 0.2%, 0.4%, and 1.6% of patients treated with placebo, Trulicity 0.75 mg and Trulicity 1.5 mg, respectively. Episodes of sinus tachycardia, associated with a concomitant increase from baseline in heart rate of ≥15 bpm, were reported in 0.7%, 1.3%, and 2.2% of patient treated with placebo, Trulicity 0.75 mg and Trulicity 1.5 mg, respectively.
In the clinical trial of patients treated with Trulicity 1.5 mg, 3 mg, or 4.5 mg once weekly for 52 weeks, mean increases in heart rate of 1 to 4 bpm were observed. Episodes of sinus tachycardia, associated with a concomitant increase from baseline in heart rate of >15 bpm, were reported in 4.1%, 4.4%, and 4.9% of patients treated with Trulicity 1.5 mg, Trulicity 3 mg, and Trulicity 4.5 mg, respectively.
First Degree AV Block/PR Interval Prolongation
A mean increase from baseline in PR interval of 2-3 milliseconds was observed in Trulicity-treated patients in contrast to a mean decrease of 0.9 milliseconds in placebo-treated patients. The adverse reaction of first degree AV block occurred more frequently in patients treated with Trulicity than placebo (0.9%, 1.7% and 2.3% for placebo, Trulicity 0.75 mg and Trulicity 1.5 mg, respectively). On electrocardiograms, a PR interval increase to at least 220 milliseconds was observed in 0.7%, 2.5%, and 3.2% of patients treated with placebo, Trulicity 0.75 mg and Trulicity 1.5 mg, respectively (see 7 WARNINGS AND PRECAUTIONS, 9.4 Drug-Drug Interactions, and 10.2 Pharmacodynamics).
In the clinical trial of patients treated with Trulicity 1.5 mg, 3 mg, or 4.5 mg once weekly for 52 weeks, the adverse reaction of first degree AV block occurred in 1.2%, 3.8% and 1.7% of patients, respectively. On electrocardiograms, a PR interval increase to at least 220 milliseconds was observed in 3.1%, 6.7% and 2.9% of patients treated with Trulicity 1.5 mg 3 mg, and 4.5 mg, respectively (see 7 WARNINGS AND PRECAUTIONS, 9.4 Drug-Drug Interactions, and 10.2 Pharmacodynamics).
Gastrointestinal (GI) Events
In studies up to 104 weeks in duration, gastrointestinal adverse events were reported in 34.5% and 43.9% of Trulicity-treated patients on 0.75 mg and 1.5 mg, respectively. Events that were reported most frequently were nausea (12.9% for 0.75 mg and 21.2% for 1.5 mg), vomiting (6.8% for 0.75 mg and 11.5% for 1.5 mg), and diarrhea (10.7% for 0.75 mg and 13.7% for 1.5 mg).
The proportion of patients experiencing nausea was dose dependent, and when examined by time period, the prevalence also peaked in the first 2 weeks. The prevalence over time stabilized by approximately 6 to 8 weeks (3% for 0.75 mg and 6% for 1.5 mg) (see Figure 1).
Through the full duration of treatment, discontinuations due to nausea, diarrhea, and vomiting were reported in 1.0%, 0.5%, and 0.4%, respectively in 0.75 mg Trulicity-treated patients and in 1.9%, 0.6%, and 0.6%, respectively in 1.5 mg Trulicity-treated patients and were generally reported within the first 4-6 weeks of the trials.
In a 52-week study of Trulicity 1.5 mg, 3 mg and 4.5 mg as add-on therapy to metformin, where the study doses were escalated every 4 weeks from an initial dose of 0.75 mg, gastrointestinal adverse events were reported in 27.8%, 33.9%, and 35.7% of Trulicity-treated patients on 1.5 mg, 3 mg and 4.5 mg, respectively. Events that were reported most frequently were nausea (14.2% for 1.5 mg, 16.1% for 3 mg, and 17.3% for 4.5 mg), diarrhea (7.7% for 1.5 mg, 12.0% for 3 mg and 11.6% for 4.5 mg) and vomiting (6.4% for 1.5 mg, 9.1% for 3 mg and 10.1% for 4.5 mg).
The prevalence of nausea increased in each dose group over the first 8 weeks of the study, and then after reaching final assigned dose, the prevalence declined over time.
In Study GBDJ (REWIND), cholelithiasis occurred at a rate of 0.62/100 patient-years in Trulicity-treated patients and 0.56/100 patient-years in placebo-treated patients after adjusting for prior cholecystectomy. Serious events of acute cholecystitis were reported in 0.5% and 0.3% of patients on Trulicity and placebo, respectively.
In the pool of placebo-controlled trials, gastrointestinal adverse reactions were reported more frequently among patients receiving Trulicity than placebo (placebo: 21.3%, 0.75 mg: 31.6%, 1.5 mg: 41.0%). Investigators graded the severity of gastrointestinal adverse reactions occurring on 0.75 mg and 1.5 mg of Trulicity as “mild” in 58% and 48% of cases, respectively, “moderate” in 35% and 42% of cases, respectively, or “severe” in 7% and 11% of cases, respectively. More patients in Trulicity 0.75 mg (1.3%) and 1.5 mg (3.5%) groups than placebo (0.2%) discontinued treatment due to gastrointestinal adverse events.
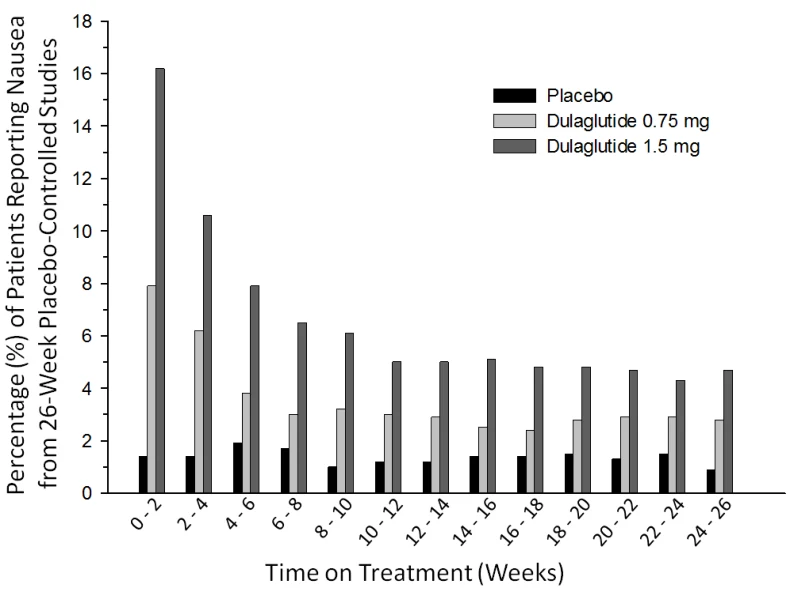
Figure 1: Prevalence of Nausea Symptoms
Pancreatitis
In Phase 2 and 3 studies with Trulicity 0.75 mg or 1.5 mg, nine (9) patients [placebo: 0.1% (1 of 703); sitagliptin: 0.7% (3 of 439); Trulicity: 0.1% (5 of 4006)] were determined to have pancreatitis by adjudication. Six of these patients were considered to have acute pancreatitis, 2- chronic pancreatitis, and 1 -type unknown.
In a clinical study evaluating Trulicity 1.5 mg, 3 mg, or 4.5 mg once weekly, acute pancreatitis occurred in 1 patient exposed to Trulicity 1.5 mg (0.2%), in 2 patients exposed to Trulicity 3 mg (0.3%), and 3 patients exposed to Trulicity 4.5 mg (0.5%). All of these patients were considered to have acute pancreatitis.
Injection Site Reactions
In the placebo –controlled clinical trials, injection site adverse events were reported in 38 (1.7%) Trulicity treated patients compared to 6 (0.9%) patients in the placebo group. Injection site hematoma was the most frequently reported injection site reaction for both the placebo (3, 0.4%) and all Trulicity (17, 0.8%) treatment groups. Injection site pain (6, 0.3%) and erythema (4, 0.2%) were only reported in the Trulicity treatment group. Two Trulicity treated patients discontinued study drug due to injection site reaction.
In studies of up to 104 weeks, 1.9% of patients in Trulicity 0.75 mg and 1.5 mg groups reported injection site reactions. Again injection site hematoma was the most commonly reported preferred term (Trulicity 0.75 mg: 15, 0.9% and Trulicity 1.5 mg: 10, 0.6%). One patient in this group discontinued study drug due to injection site reaction.
Across the clinical trials of 26 up to 104 week duration, potentially immune-mediated injection site adverse events (e.g., rash, erythema) have been reported in 0.5% and 0.7% of patients receiving Trulicity 0.75 mg and 1.5 mg, respectively.
Immunogenicity
Across four Phase 2 and five Phase 3 clinical studies, 64 (1.6%) Trulicity treated patients developed dulaglutide anti-drug antibodies (ADA). No Trulicity-treated patients who developed dulaglutide ADAs reported a systemic hypersensitivity reaction. Patients with treatment-emergent dulaglutide ADA had significantly higher incidence of immune-mediated injection site adverse events (3.1%; 2 of 64 patients) compared to patients who did not develop treatment-emergent dulaglutide ADA (0.5%; 18 of 3843) patients. Of the 64 Trulicity-treated patients that developed dulaglutide ADAs, 34 patients (0.9% of the overall population) had dulaglutide-neutralizing antibodies, and 36 patients (0.9% of the overall population) developed antibodies against native GLP-1.
Hypersensitivity
In clinical studies, systemic hypersensitivity events (e.g. severe urticaria, systemic rash, facial edema, lip swelling) have been reported in 0.5% of patients receiving Trulicity.
Hypoglycemia
A summary of total, documented symptomatic, and severe hypoglycemia across phase 3 glycemic control studies is presented in Table 3 and Table 4.
Table 3: By-Study Summary of Incidence (%) and Rate (Events/Patient/Year) of Total, Documented Symptomatic and Severe Hypoglycemia – Trulicity 0.75 mg, Trulicity 1.5 mg, and Comparator-Treated Patients in Phase 3 Studies
| Percentage of Patients [Rate] | ||||
Monotherapy (Study GBDC,1 52 weeks) Total Documented symptomatic Severe | MET (N=268) 12.7 [0.28] 4.9 [0.09] 0 [0.0] | Trulicity 0.75 mg (N=270) 11.1 [0.47] 5.9 [0.15] 0 [0.0] | Trulicity 1.5 mg (N=269) 12.3 [0.89] 6.3 [0.62] 0 [0.0] | |
In Combination with MET (Study GBCF, 26-week placebo-controlled period) Total Documented symptomatic Severe | Placebo (N=177) 1.1 [0.08] 1.1 [0.08] 0 [0.0] | Trulicity 0.75 mg (N=302) 4.0 [0.18] 2.6 [0.13] 0 [0.0] | Trulicity 1.5 mg (N=304) 7.9 [0.39] 5.6 [0.26] 0 [0.0] | |
In Combination with MET (Study GBCF, 104 weeks) Total Documented symptomatic Severe | Sitagliptin (N=315) 8.6 [0.20] 5.7 [0.17] 0 [0.0] | Trulicity 0.75 mg (N=302) 8.6 [0.21] 6.3 [0.18] 0 [0.0] | Trulicity 1.5 mg (N=304) 12.8 [0.26] 10.9 [0.19] 0 [0.0] | |
In Combination with MET+SU (Study GBDB, 78 weeks) Total Documented symptomatic Severe | Insulin glargine (N=262) 71.4 [6.90] 51.1 [3.02] 0.8 [0.01] | Trulicity 0.75 mg (N=272) 56.6 [4.18] 39.0 [1.67] 0 [0.0] | Trulicity 1.5 mg (N=273) 58.6 [4.27] 40.3 [1.67] 0.7 [0.01] |
In Combination with SGLT2i ±MET (Study GBCE, 24 weeks) Total Documented symptomatic Severe | Placebo (N=140) 2.9 [0.21] 2.1 [0.12] 0 [0.0] | Trulicity 0.75 mg (N=141) 3.5 [0.26] 2.1 [0.16] 0.7 [0.02] | Trulicity 1.5 mg (N=142) 3.5 [0.31] 1.4 [0.16] 0 [0.0] |
In Combination with Insulin lispro±MET (Study GBDD, 52 weeks) Total Documented symptomatic Severe | Insulin glargine (N=296) 89.9 [57.17] 83.4 [40.95] 5.1 [0.09] | Trulicity 0.75 mg (N=293) 90.1 [48.38] 85.3 [35.66] 2.4 [0.05] | Trulicity 1.5 mg (N=295) 86.1 [41.74] 80.0 [31.06] 3.4 [0.06] |
In Combination with Insulin lispro (Study GBDX, patients with moderate to severe CKD, 52 weeks) Total Documented symptomatic Severe | Insulin glargine (N=194) 74.7 [14.36] 63.4 [9.62] 6.7 [0.09] | Trulicity 0.75 mg (N=189) 59.8 [7.59] 48.1 [4.34] 2.6 [0.03] | Trulicity 1.5 mg (N=190) 50.0 [5.82] 40.5 [4.44] 0 [0] |
In Combination with Titrated Basal Insulin Glargine ± MET (Study GBDI, 28 weeks) Total Documented symptomatic Severe Mod 2.7.4. E | Placebo (N=150) 50.7 [8.6] 30.0 [4.4] 0.0 [0.0] | N/A | Trulicity 1.5 mg (N=150) 54.7 [7.7] 35.3 [3.4] 0.7 [0.0] |
Alone or in combination with other antihyperglycemic agents (Study GBDJ, REWIND (cardiovascular outcome trial) Severe | Placebo (N = 4952) 1.5 [0.29]2 | NA | Trulicity 1.5 mg (N=4949) 1.3 [0.25]2 |
By-Study Summary of Total Hypoglycemia (events with or without symptoms but with plasma glucose less than or equal to 3.9 mmol/L, plus events with symptoms of hypoglycemia but without a plasma glucose determination, plus severe hypoglycemia), Documented Symptomatic Hypoglycemia (symptoms of hypoglycemia with plasma glucose less than or equal to 3.9 mmol/L), and Severe Hypoglycemia (an episode requiring the assistance of another person to actively administer carbohydrate, glucagon, or other resuscitative actions), all excluding post-rescue visits - Trulicity and Comparator-Treated Patients in Phase 3 Studies.
1 See 14.1 Trial Design and Study Demographics for summary of study designs.
2 Patients with events/100 person-years
Abbreviations: MET = metformin; N = total number of patients in specified treatment group; SU = sulfonylurea; SGLT2i = sodium glucose co-transporter 2 inhibitor; CKD=chronic kidney disease
Table 4: Summary of Total, Documented Symptomatic and Severe Hypoglycemia in Patients Receiving Trulicity 1.5 mg 3 mg and 4.5 mg
| Percentage of Patients [Rate] | ||||
In Combination with MET (52 weeks) Total Documented symptomatic Severe | Trulicity 1.5 mg (N=612) 7.0[0.20] 3.1 [0.08] 0.2 [0.00] | Trulicity 3 mg (N=616) 5.4 [0.21] 2.4 [0.06] 0.0 [0.00] | Trulicity 4.5 mg (N=614) 6.0 [0.20] 3.1 [0.08] 0.2 [0.00] | |
Summary of Total Hypoglycemia (events with or without symptoms but with plasma glucose less than or equal to 3.9 mmol/L, plus events with symptoms of hypoglycemia but without a plasma glucose determination, plus severe hypoglycemia), Documented Symptomatic Hypoglycemia (symptoms of hypoglycemia with plasma glucose less than or equal to 3.9 mmol/L), and Severe Hypoglycemia (an episode requiring the assistance of another person to actively administer carbohydrate, glucagon, or other resuscitative actions), all excluding post-rescue visits in study GBGL.
Rate is calculated as the number of episodes of hypoglycemia divided by the total patient-years of exposure. Abbreviations: MET = metformin; N = total number of patients in specified treatment group.
Malignancies/Thyroid Cancer
In Phase 2 and 3 clinical trials, there was one event of MTC in a patient who received Trulicity. This patient had pre-treatment calcitonin levels approximately 8 times the upper limit of normal (ULN).
8.3 Less Common Clinical Trial Adverse Reactions
Cardiac disorders: palpitations, tachycardia, myocardial infarction
Ear and labyrinth disorders: vertigo
Eye disorders: conjunctivitis, vision blurred
Gastrointestinal disorders: dry mouth, colitis
General disorders and administration site conditions: edema
Hepatobiliary disorders: cholelithiasis, hepatic steatosis
Immune system disorders: seasonal allergy
Infections and infestations: gastroenteritis viral, pneumonia, tooth infection, ear infection, lower respiratory tract infection, tinea pedis, tonsillitis
Injury, poisoning and procedural complications: accidental overdose, contusion, excoriation, muscle strain
Investigations: blood calcitonin increased, blood creatine phosphokinase increased, gamma-glutamyltransferase increased
Metabolism and nutrition disorders: hypertriglyceridemia, vitamin D deficiency, hypokalemia
Musculoskeletal and connective tissue: osteoporosis
Neoplasms benign, malignant and unspecified (includes cysts and polyps): basal cell carcinoma
Nervous system disorders: migraine, diabetic neuropathy, sciatica, dysgeusia, syncope
Renal and urinary disorders: proteinuria
Respiratory, thoracic and mediastinal disorders: asthma,
Skin and subcutaneous tissue disorders: rash, pruritus, alopecia, hyperhidrosis, dermatitis contact
8.4 Abnormal Laboratory Findings: Hematologic, Clinical Chemistry and Other Quantitative Data
Clinical Trial Findings
Dulaglutide was associated with increases in lipase, pancreatic amylase and, total amylase. Patients treated with Trulicity had mean increases from baseline in lipase and/or pancreatic amylase of 14% to 20% compared to a mean increases of up to 3% in the placebo treated patients.
8.5 Post-Market Adverse Reactions
- -approval use of Trulicity. Because these events are reported voluntarily from a population of uncertain size, it is generally not possible to reliably estimate their frequency or establish a causal relationship to drug exposure.
- Anaphylactic reactions (see 2 CONTRAINDICATIONS, 7 WARNINGS AND PRECAUTIONS, and PATIENT MEDICATION INFORMATION).
9 DRUG INTERACTIONS
9.2 Drug Interactions Overview
The potential effect of coadministered medications on the pharmacokinetics of dulaglutide and vice-versa was studied in several single- and multiple- dose studies in healthy subjects, patients with type 2 diabetes mellitus, and in patients with hypertension.
Dulaglutide causes a delay of gastric emptying, and thereby has the potential to impact the absorption of concomitantly administered oral medications. In clinical pharmacology studies, dulaglutide did not affect the absorption of the tested, orally administered medications to any clinically relevant degree as described below in Table 5.
9.4 Drug-Drug Interactions
The drugs listed in this section are based on drug interaction studies.
Table 5: Drug-Drug Interactions
| [Proper/Common name] | Source of Evidence | Effect | Clinical comment |
| Acetaminophen | CT | Reduction to acetaminophen Cmax of 36% with 1 mg dulaglutide and 50% with 3 mg dulaglutide. No statistically significant effect on AUC, Cmax or tmax of acetaminophen. | Changes are not considered clinically relevant; no dose adjustment required. |
| Atorvastatin | CT | Reduction to Cmax and AUC up to 70% (atorvastatin) and 21% (atorvastatin’s major metabolite o-hydroxyatorvastatin), and increase of t1/2 up to 17% (atorvastatin) and 41% (o-hydroxyatorvastatin), with co-administration of dulaglutide. | Changes are not considered clinically relevant; no dose adjustment required. |
| Digoxin | CT | Cmax of digoxin decreased by up to 22%, no change to AUC and tmax. | Changes are not considered clinically relevant; no dose adjustment required. |
| Anti-hypertensives | CT | Statistically significant delays in lisinopril and metoprolol tmax of approximately 1 hour. Metoprolol AUC increased by 19% and Cmax increased by 32%. | Changes are not considered clinically relevant; no dose adjustment required. |
| Warfarin | CT | Following dulaglutide coadministration, S- and R-warfarin exposure and R-warfarin Cmax were unaffected, and S-warfarin Cmax decreased by 22%. The time of international normalized ratio response (tINRmax) was delayed by 6 hours, consistent with delays in tmax of approximately 4 and 6 hours for S- and R-warfarin, respectively. | Changes are not considered clinically relevant; no dose adjustment required. |
| Oral Contraceptives | CT | Dulaglutide reduced norelgestromin and ethinyl estradiol Cmax by 26% and 13%, respectively, and delayed tmax by 2 and 0.3 hours, respectively, but did not affect AUC. | Changes are not considered clinically relevant; no dose adjustment required. |
| Metformin | CT | Metformin AUC increased up to 15% and Cmax decreased up to 12%, with no changes in tmax with co-administration of dulaglutide. These changes are consistent with the gastric emptying delay of dulaglutide and are within the PK variability of metformin. | Changes are not considered clinically relevant; no dose adjustment required. |
| Sitagliptin | CT | When co-administered with 2 consecutive doses of dulaglutide, sitagliptin AUC and Cmax decreased by approximately 7.4% and 23.1%, respectively. Sitagliptin tmax increased approximately 0.5 hours following coadministration with dulaglutide compared to sitagliptin alone. Sitagliptin can produce up to 80% inhibition of DPP-4 over a 24-hour period. Dulaglutide coadministration with sitagliptin increased dulaglutide exposure and Cmax by approximately 38% and 27%, respectively, and median tmax increased approximately 24 hours. | Changes are not considered clinically relevant; no dose adjustment required. |
Abbreviations: AUC = area under the time-concentration curve; CI = confidence interval; tmax = time to maximum concentration; t1/2 = elimination half-life; Cmax = maximum concentration; PK = pharmacokinetics; CT = Clinical Trial
Drugs that Increase Heart Rate
Trulicity causes an increase in heart rate (see 8.2 Clinical Trial Adverse Reactions, 10.2 Pharmacodynamics). Caution should be observed if Trulicity is administered with other drugs that also increase heart rate, such as drugs with sympathomimetic or anticholinergic activity.
Drugs that Cause PR Interval Prolongation
Trulicity causes an increase in the PR interval (see 8.2 Clinical Trial Adverse Reactions and 10.2 Pharmacodynamics). The impact on the PR interval of co-administration of Trulicity with other drugs that prolong the PR interval (including, but not limited to, antiarrhythmics, non-dihydropyridine calcium channel blockers, beta adrenoceptor blockers, digitalis glycosides, HIV protease inhibitors, and somatostatin analogues) has not been evaluated. As a result, co-administration of Trulicity with these drugs should be undertaken with caution.
9.5 Drug-Food Interactions
Interactions with food have not been studied.
9.6 Drug-Herb Interactions
Interactions with herbal products have not been studied.
9.7 Drug-Laboratory Test Interactions
Interactions with laboratory tests have not been studied.
10 CLINICAL PHARMACOLOGY
10.1 Mechanism of Action
Trulicity contains dulaglutide which is a long-acting human GLP-1 receptor agonist with 90% amino acid sequence homology to endogenous human GLP-1 (7-37). Dulaglutide activates the GLP-1 receptor, a membrane-bound cell-surface receptor coupled to adenylyl cyclase by the stimulatory G-protein, Gs, in pancreatic beta cells. Dulaglutide increases intracellular cyclic AMP (cAMP) in beta cells leading to insulin release in the presence of elevated glucose concentrations. This insulin secretion subsides as blood glucose concentrations decrease and approach euglycemia. Dulaglutide also decreases glucagon secretion and slows gastric emptying.
Native GLP-1 (7-37) has a half-life of 1.5 to 2 minutes due to degradation by DPP-4 and renal clearance. In contrast to native GLP-1, dulaglutide is stable against metabolic degradation by DPP-4 and has a pharmacokinetic profile in humans, which makes it suitable for once-weekly administration. The pharmacokinetic profile of dulaglutide is the result of the fusion of two molecules of a GLP-1 (7-37) analogue, which include a modification to amino acid 8, linked to a modified human IgG4 chain.
10.2 Pharmacodynamics
Trulicity lowers fasting, and postprandial glucose (PPG) concentrations in patients with type 2 diabetes mellitus through the actions described below. The reduction in fasting and PPG can be observed after the first Trulicity administration.
Fasting and Postprandial Glucose
In a clinical pharmacology study in adults with type 2 diabetes mellitus, treatment with once weekly Trulicity resulted in a reduction from baseline of fasting and 2-hour postprandial glucose (PPG) concentrations on day 3 after the first injection, when compared to placebo (-1.42, -3.30 mmol/L, respectively); these effects were sustained after six weeks of dosing with the 1.5 mg dose.
First and Second Phase Insulin Secretion
Both first and second phase insulin secretion were increased in patients with type 2 diabetes treated with Trulicity compared to placebo.
Glucose−Dependent Insulin Secretion
The effect of steady state dosing of Trulicity 1.5 mg on glucose-dependent insulin secretion rates (ISR) was assessed in a test meal study in patients with type 2 diabetes mellitus at the 26-week endpoint. In these patients, the ISR response was increased in a glucose-dependent manner.
Glucagon Secretion
Trulicity lowered blood glucose by stimulating insulin secretion and decreasing glucagon secretion. In a clinical study in patients with type 2 diabetes mellitus, Trulicity reduced fasting glucagon levels at the 26-week time point. In addition, a test meal study also showed decreases in postprandial glucagon AUC (0-3 hours post-meal) after 26 weeks of treatment with Trulicity.
Gastric Emptying
Trulicity causes a delay of gastric emptying. The delay is largest after the first dose and diminishes with subsequent doses.
Serum Pancreatic Enzymes
Trulicity is associated with mean increases from baseline in pancreatic enzymes (pancreatic amylase and/or lipase) of up to 14% to 20% (see 7 WARNINGS AND PRECAUTIONS). Serial measurements of pancreatic enzymes in Phase 2 and Phase 3 trials did not predict the onset of acute pancreatitis. The clinical meaning of these findings is unknown.
Cardiac Electrophysiology
The effect of dulaglutide on cardiac repolarization was tested in a thorough QTc study. Dulaglutide did not produce QTc prolongation at doses of 4 and 7 mg.
Heart Rate:
In Clinical trials, dulaglutide treatment was associated with an increase in heart rate at all dose levels (see 7 WARNINGS AND PRECAUTIONS, 8.2 Clinical Trial Adverse Reactions, and 9.4 Drug-Drug Interactions).
PR Interval: Dulaglutide resulted in PR interval prolongation with no evidence of dose-dependency over the 0.75 to 4.5 mg doses studied. (see 7 WARNINGS AND PRECAUTIONS, 8.2 Clinical Trial Adverse Reactions and 9.4 Drug-Drug Interactions)
QTc Interval:
During treatment with dulaglutide 4 mg, QTcP shortening was observed at 4 hours and from 24-168 hours post-dosing.
10.3 Pharmacokinetics
Table 6: Summary of dulaglutide pharmacokinetic mean parameters in patients with Type 2 diabetes at doses 0.75 mg to 4.5 mg once-weekly from population pharmacokinetic modelling
| Dose (mg) | Cmax,ss (ng/mL) | AUC(0-168)ss (ng.h/mL) | tmax (h) | t1/2 (h) | CL/F (L/h) | V2/F (L) | V3/F (L) |
|---|---|---|---|---|---|---|---|
| 0.75 mg | 39.7 | 5580 | 40 | Approximately 5 days | 0.142 | 3.09 | 5.98 |
| 1.5 mg | 79.6 | 11200 | |||||
| 3.0 mg | 159 | 22300 |
|---|---|---|
| 4.5 mg | 238 | 33400 |
Abbreviations: AUC(0-168)ss = area under the curve in one dosing interval at steady state; Cmax,ss = maximum concentration at steady state; CL/F = apparent clearance; tmax =time of maximum concentration; t1/2 = elimination half-life; V2/F = apparent central volume of distribution; V3 = apparent peripheral volume of distribution.
Following subcutaneous administration, the time to maximum plasma concentration of dulaglutide at steady state ranges from 24 to 72 hours, with a median of 48 hours. After initiation of once-weekly dosing with 0.75 mg or 1.5 mg dulaglutide, the accumulation ratio was approximately 1.56 and steady-state plasma dulaglutide concentrations were achieved between 2 and 4 weeks. Site of subcutaneous administration (abdomen, upper arm, and thigh) had no clinically meaningful effect on the exposure to 0.75 mg or 1.5 mg dulaglutide.
Absorption:
The mean absolute bioavailability of dulaglutide following subcutaneous administration of a single 0.75 mg and 1.5 mg dose was 65% and 47%, respectively. Absolute subcutaneous bioavailability for 3 mg and 4.5 mg doses have not been specifically studied. Dulaglutide concentrations increased approximately 20% less than dose-proportionately from 0.75 mg to 4.5 mg.
Distribution:
Apparent population mean central volume of distribution was 3.09 L and the apparent population mean peripheral volume of distribution was 5.98 L. The mean volume of distribution after intravenous administration of a single dose of 0.1 mg dulaglutide in healthy subjects was approximately 5.32 L (range 3.6 to 7.3).
Metabolism:
Dulaglutide is presumed to be degraded into its component amino acids by general protein catabolism pathways.
Elimination:
The apparent population mean clearance of dulaglutide was 0.142 L/hr. The elimination half-life of dulaglutide was approximately 5 days (range 3.9 to 6.1 days).
Special Populations and Conditions
- Pediatrics: Studies characterizing the pharmacokinetics of dulaglutide in pediatric patients are not available to Health Canada.
- Geriatrics: Age had no clinically relevant effect on the pharmacokinetic properties of dulaglutide based on population PK modeling.
- Sex: Sex had no clinically meaningful effect on the pharmacokinetics of dulaglutide based on population PK modeling.
- Pregnancy and Breast-feeding: Studies characterizing the pharmacokinetics of dulaglutide in pregnant and breastfeeding patients have not been performed.
- Ethnic Origin: Race had no clinically meaningful effect on the pharmacokinetics of dulaglutide based on population PK modeling.
- Hepatic Insufficiency: The pharmacokinetics of 1.5 mg dulaglutide were evaluated in Type 2 diabetes mellitus subjects with varying degrees (mild, moderate and severe) of hepatic impairment in a clinical pharmacology study. Subjects with hepatic impairment had statistically significant decreases in dulaglutide exposure of up to 30% to 33% for mean Cmax and AUC, respectively, compared to healthy controls. There was a general increase in tmax of dulaglutide with increased hepatic impairment (see 4 DOSAGE AND ADMINISTRATION and 7.1 Special Population).
- Renal Insufficiency: The pharmacokinetics of 1.5 mg dulaglutide were evaluated in a clinical pharmacology study and were generally similar between healthy subjects and patients with mild to severe renal impairment (CrCl < 30 ml/min), including end stage renal disease (requiring dialysis).
- Body Weight: Pharmacokinetic analyses have demonstrated a statistically significant inverse relationship between body weight and dulaglutide exposure.
Based on a combination of evidence from clinical pharmacology studies and population pharmacokinetic analysis, age, sex, ethnicity, renal impairment (mild, moderate or severe), hepatic impairment (mild, moderate and severe) and body weight do not have a clinically meaningful effect on the pharmacokinetics of dulaglutide.
11 STORAGE, STABILITY AND DISPOSAL
Trulicity should be stored in the refrigerator at 2° to 8°C, up to the expiration date. Do not use Trulicity beyond the expiration date.
Do not freeze Trulicity. Do not use Trulicity if it has been frozen.
Do not store in the freezer.
Trulicity must be protected from light.
Each single-use, prefilled pen may be stored unrefrigerated for up to 14 days at a temperature not to exceed 30ºC.
The Trulicity prefilled pen must be discarded after use in a puncture-resistant container.
12 SPECIAL HANDLING INSTRUCTIONS
Each Trulicity pre-filled pen is for single-use only.
Trulicity should not be used if the pen is damaged.
Trulicity should not be used if particles appear or if the solution is cloudy and/or discoloured.
If the Trulicity device is dropped on a hard surface, it should not be used.
PART II: SCIENTIFIC INFORMATION
13 PHARMACEUTICAL INFORMATION
Drug Substance
Proper name: dulaglutide
Chemical name:
USAN: dulaglutide
IUPAC:
7-37-Glucagon-like peptide I [8-glycine, 22-glutamic acid, 36-glycine] (synthetic human) fusion protein with peptide (synthetic 16-amino acid linker) fusion protein with immunoglobulin G4 (synthetic human Fc fragment), dimer
[Gly8,Glu22,Gly36]human glucagon-like peptide 1-(7-37)-peptidyltetraglycyl-L-seryltetraglycyl-L-seryltetraglycyl-L-seryl-L-alanyldes-Lys229-[Pro10,Ala16,Ala17]human immunoglobulin heavy constant γ4 chain H-CH2-CH3 fragment, (55-55’:58-58’)-bisdisulfide dimer
Molecular formula and molecular mass:
C2646 H4044 O836 N704 S18 (non-glycosylated)
62,561 Da (glycosylated, all Cys residues disulfide bonded)
59,671 Da (non-glycosylated, all Cys residues disulfide bonded)
Structural formula:
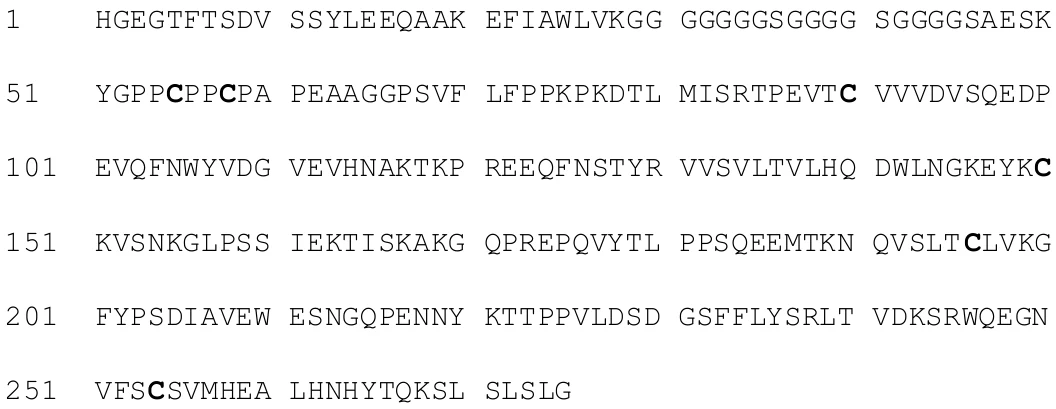
Dulaglutide is produced as a disulfide-linked two-chain molecule (homodimer). The amino acid sequence of the single polypeptide chain is below:
Physicochemical properties: Clear to slightly opalescent, colourless to slightly brown solution
Product Characteristics:
Dulaglutide is produced in Chinese hamster ovary cells by recombinant DNA technology. Trulicity is a clear, colourless sterile solution.
14 CLINICAL TRIALS
Trulicity® (dulaglutide) has been studied as monotherapy and in combination with metformin, metformin and sulfonylurea, sodium glucose co-transporter 2 inhibitor (SGLT2i) with or without
metformin, prandial insulin with or without metformin, and basal insulin with or without metformin. Table 7 summarizes the study demographics and study designs of eight phase 3 placebo and/or active controlled studies.
Dose escalation was performed in one study with Trulicity doses 1.5 mg, 3 mg and 4.5 mg, added to metformin. All other clinical studies evaluated Trulicity 0.75 mg and 1.5 mg without dose escalation; patients were initiated and maintained on either 0.75 mg or 1.5 mg for the duration of the trials.
14.1 Trial Design and Study Demographics
Table 7: Summary of patient demographics for glycemic control clinical trials and cardiovascular outcome trial
| Study # | Trial design and duration | Dosage, route of administration | Background Therapy | Study subjects (n=number) | Mean age (SD) Range | Gender % (#) | ||
| Add on Combination Therapy to Metformin | ||||||||
| GBCF | 104-week, Phase 2/3, adaptive, inferentially seamless, multicentre, randomized, placebo-controlled, double-blind, parallel-arm, dose finding trial | Trulicity: 0.75, 1.5 mg, SC, QW Placebo: PO, QD; SC, QW up to 26 weeks Sitagliptin: 100 mg, PO, QD | Patients added assigned therapy to MET ≥1500 mg/day | 972 randomized | 54.3 yrs (9.7) Range: 20-75 yrs | Female: 51.9% (504) Male: 48.1% (468) | ||
| GBDE | 26-week, Phase 3, multicentre randomized, parallel-arm, active comparator, open-label, noninferiority trial | Trulicity: 1.5 mg, SC, QW Liraglutide: 1.8 mg, SC, QD | Patients added assigned therapy to MET ≥1500 mg/day | 599 randomized | 56.7 yrs (9.6) Range: 19-80 yrs | Female: 52% (312) Male: 48% (287) | ||
| GBGL | 52-week, Phase 3, multicentre randomized, parallel-arm, active comparator, double-blind, superiority trial | Trulicity: 3, 4.5 mg, SC, QW Trulicity: 1.5 mg, SC, QW | Patients added assigned therapy to MET ≥1500 mg/day | 1842 randomized | 57.1 yrs (10.0) Range: 21-85 yrs | Female: 48.8% (898) Male: 51.2% (944) | ||
| Add on Combination Therapy to Metformin and Sulfonylurea | ||||||||
| GBDB | 78-week, Phase 3, multicentre, randomized, parallel-arm, open-label to active comparator, double-blind to dulaglutide trial | Trulicity: 0.75, 1.5 mg SC, QW Insulin glargine: starting dose 10 IU, SC; thereafter, titrated to target, QD | Patients added assigned therapy to maximally tolerated dose of MET ≥1500 mg/day and glimepiride ≥4 mg/day | 810 randomized | 56.7 yrs (9.5) Range: 27-87 yrs | Female: 48.7% (393) Male: 51.3% (414) | ||
| Add on Combination Therapy to SGLT2 inhibitor with or without Metformin | ||||||
| GBGE | 24-week, Phase 3, multicentre, randomized, parallel-arm, double-blind | Trulicity: 0.75, 1.5 mg SC, QW Placebo SC, QW | Patients added assigned therapy to SGLT2i with or without MET ≥1500 mg/day | 424 randomized | 57.3 yrs (9.4) Range: 25-79 yrs | Female: 49.9% (211) Male: 50.1% (212) |
| Combination Therapy with Insulin Lispro with or without Metformin | ||||||
| GBDD | 52-week, Phase 3, multicentre, randomized, parallel-arm, open-label, active comparator trial | Trulicity: 0.75, 1.5 mg SC, QW Insulin glargine: starting dose 50% of prerandomized total daily insulin dose (TDI), SC, at bedtime; thereafter, titrated to target. | All patients added assigned therapy and insulin lispro TID (starting daily dose: 50% of TDI, titrated to target). Prior oral and insulin therapies with the exception of metformin were discontinued. | 884 randomized | 59.4 yrs (9.2) Range: 28-84 yrs | Female: 46.5% (411) Male: 53.5% (473) |
| Combination Therapy with Insulin Lispro in Patients with Moderate to Severe CKD | ||||||
| GBDX | 52-week, Phase 3, multicentre, randomized, parallel-arm, open-label, active comparator | Trulicity: 0.75, 1.5 mg SC, QW Insulin glargine: SC, at bedtime, titrated to target | All patients added assigned therapy to insulin lispro TID titrated to target. Prior oral therapies and pramlintide were discontinued. | 577 randomized | 64.6 yrs (8.6) Range: 29-84 yrs | Female: 47.7% (275) Male: 52.3% (301) |
| Combination Therapy with Insulin Glargine with or without Metformin | ||||||
| GBDI | 28-week, Phase 3, multicentre, randomized, parallel-arm, double-blind, placebo-controlled trial | Trulicity: 1.5 mg SC, QW Placebo: SC, QW | All patients added assigned therapy to basal insulin glargine with/without metformin. Basal insulin glargine was titrated to target in both study arms after a 4-week initial stabilization period. | 300 randomized | 60.4 yrs (9.8) Range: 28-83 yrs | Female: 42.3% (127) Male: 57.7% (173) |
| In Combination with 0-2 OADs +/- Basal Insulin in Patients with Established Cardiovascular Disease or Multiple Cardiovascular Risk Factors | ||||||
GBDJ (REWI ND) | Multicenter, multi-national, randomized, double-blind, placebo controlled Cardiovascular Outcome Trial (CVOT) with event driven treatment period. Median follow up 5.4 years | Trulicity 1.5 mg SC, QW + SOC OR Placebo SC, QW + SOC | 0-2 OADs +/- Basal Insulin (baseline therapy) | 9901 randomized | 66.2 yrs (6.5) Range: 50-92 yrs | Female: 46.3% (4589) Male: 53.7% (5312) |
BID=twice daily; MET = metformin; PO = orally; QD = once daily; QW = once weekly; SC = subcutaneous; TID=three times daily; SGLT2i = sodium glucose co-transporter 2 inhibitor; CKD=chronic kidney disease; CV = cardiovascular; OAD = oral antihyperglycemic drug; SOC = standard of care
A total of 6408 patients with type 2 diabetes mellitus and inadequate glycemic control were randomized, of whom 6403 received at least one dose of study drug, in eight placebo- and/or active-controlled, glycemic control Phase 3 studies to evaluate the safety and efficacy of Trulicity. Of these, 1599 (25.0%) patients were ≥65 years and 206 (3.2%) were ≥75 years. Patients had an overall mean age of 57 years (range 19 to 87 years). 51.1% were male and 48.9% were female. The racial distribution of patients in these studies was 76.9% white, 7.8% Asian, 5.6% African American, and 9.7% other racial origin. The mean body mass index (BMI) overall was 33 kg/m2 at baseline, and the duration of diabetes was 9.7 years.
14.2 Study Results
Add on Combination Therapy to Metformin
Study GBCF (AWARD-5) - In this 104-week placebo-controlled, double-blind study, following dose selection, 972 patients were randomized to Trulicity (dulaglutide 0.75 mg or 1.5 mg) once weekly, placebo, or sitagliptin 100 mg/day (after 26 weeks, patients in the placebo treatment group received blinded sitagliptin 100 mg/day for the remainder of the study), all as add-on to metformin. Randomization occurred after an 11-week lead-in period to allow for a metformin titration period followed by a 6-week glycemic stabilization period. The primary objective of the study was to demonstrate that the HbA1c change from baseline for Trulicity 1.5 mg once weekly was noninferior to sitagliptin at 52 weeks, with a noninferiority margin of 0.25%.
Treatment with Trulicity once weekly resulted in a statistically significant reduction in HbA1c compared to placebo (at 26 weeks) and compared to sitagliptin (at 52 weeks) (Table 8).
Table 8: Results at the 52-Week Primary Endpoint of Trulicity Compared to Placebo and Sitagliptin, All as Add-On to Metformina
| 26-Week Placebo-Controlled Period | 52-Week Primary Time Point | ||||||||
| Trulicity | Placebo + MET | Trulicity | SITA 100 mg + MET | ||||||
| 0.75 mg + MET | 1.5 mg + MET | 0.75 mg + MET | 1.5 mg + MET | ||||||
| Intent-to-Treat (ITT) Population (N) | 281 | 279 | 139 | 281 | 279 | 273 | |||||||||||||||||
|---|---|---|---|---|---|---|---|---|---|---|---|---|---|---|---|---|---|---|---|---|---|---|---|
| HbA1c (%) (Mean) | |||||||||||||||||||||||
| Baseline HbA1c | 8.2 | 8.1 | 8.1 | 8.2 | 8.1 | 8.0 | |||||||||||||||||
| Change from baseline, adjusted meanb | -1.0 | -1.2 | 0.1 | -0.9 | -1.1 | -0.4 | |||||||||||||||||
| Difference from placebo + MET armb (95% CI) | -1.0 (-1.2, -0.9) | -1.2 (-1.4, -1.1) | - | - | - | - | |||||||||||||||||
| P value (superiority) † | <0.001 | <0.001 | - | - | - | - | |||||||||||||||||
| Difference from SITA + MET arm, adjusted meanb (95% CI) | - | - | - | -0.5 (-0.7, -0.3) | -0.7 (-0.9, -0.5) | - | |||||||||||||||||
| P value (superiority) † | - | - | - | <0.001 | <0.001 | ||||||||||||||||||
| P value (non-inferiority) † | - | - | - | <0.001 | <0.001 | ||||||||||||||||||
| Percentage of patients HbA1c <7.0% | - | - | - | 49 | 59 | 33 | |||||||||||||||||
| Fasting Serum Glucose (mmol/L) (Mean) | |||||||||||||||||||||||
| Baseline | - | - | - | 9.65 | 9.62 | 9.48 | |||||||||||||||||
| Change from baseline, adjusted mean | - | - | - | -1.64 | -2.27 | -0.80 | |||||||||||||||||
| Body Weight (kg) (Mean) | |||||||||||||||||||||||
| Baseline | - | - | - | 85.5 | 86.5 | 85.8 | |||||||||||||||||
| Change from baseline, adjusted mean | - | - | - | -2.7 | -3.1 | -1.5 | |||||||||||||||||
Abbreviation: HbA1c = hemoglobin A1c; MET = metformin; SITA = sitagliptin
a All intent-to-treat patients randomized after the dose finding portion of the study. At Week 52, 14%, 19% and 19% of individuals randomized to Trulicity 0.75 mg, Trulicity 1.5 mg and sitagliptin, respectively, had missing data and had their last observation carried forward for analysis.
b Least-squares mean from ANCOVA model adjusted for baseline value and country.
† Overall Type I error rate for treatment comparisons was controlled using a tree-gatekeeping strategy.
Study GBDE (AWARD-6) – In this 26-week, open-label study 599 patients were randomized to once weekly Trulicity 1.5 mg or once daily liraglutide 1.8 mg, both as add-on to metformin. Patients randomized to liraglutide were initiated at 0.6 mg QD for 1 week, then escalated to 1.2 mg QD for one week and then escalated to 1.8 mg QD for the remainder of the study. The primary objective of the study was to demonstrate the noninferiority of Trulicity 1.5 mg once weekly compared to liraglutide 1.8 mg once daily, both added on to metformin, in change in HbA1c from baseline at 26 weeks, with a noninferiority margin of 0.4%.
At 26 weeks, treatment with once weekly Trulicity 1.5 mg once weekly was noninferior to once daily liraglutide 1.8 mg (Table 9).
Table 9: Results of a 26-Week Study of Trulicity Compared to Liraglutide, as Add-On to Metformina
| 26-Week Primary Time Point | ||||||||||
|---|---|---|---|---|---|---|---|---|---|---|
Trulicity 1.5 mg | Liraglutide 1.8 mg | |||||||||
| Intent-to-Treat (ITT) Population (N) | 299 | 300 | ||||||||
| HbA1c (%) (Mean) | ||||||||||
| Baseline HbA1c | 8.1 | 8.1 | ||||||||
| Change from baseline, adjusted meanb | -1.4 | -1.4 | ||||||||
| Difference from liraglutideb (95% CI) | -0.1 (-0.2, 0.1) | - | ||||||||
| P value (non-inferiority) | <0.001 | |||||||||
| Percentage of patients HbA1c <7.0% | 68 | 68 | ||||||||
| Fasting Serum Glucose (mmol/L) (Mean) | ||||||||||
| Baseline | 9.28 | 9.16 | ||||||||
| Change from baseline, adjusted mean | -1.93 | -1.90 | ||||||||
| Body Weight (kg) (Mean) | ||||||||||
| Baseline | 93.8 | 94.4 | ||||||||
| Change from baseline, adjusted mean | -2.9 | -3.6 | ||||||||
| Postprandial Glucose (mmol/L) (Mean) | ||||||||||
| Baseline | 10.65 | 10.58 | ||||||||
| Change from baseline, adjusted mean | -2.56 | -2.43 | ||||||||
Abbreviation: HbA1c = hemoglobin A1c; CI = confidence interval
a Intent-to-treat population excluding data following any rescue therapy. Over the 26-week study period, the percentage of patients who required glycemic rescue was 0.3% in the Trulicity treatment group, and 1.0% in the liraglutide treatment group.
b Least-squares mean from a mixed-effects model for repeated measures with the baseline value, country, treatment, visit, treatment-by-visit interaction and the patient as a random effect.
Study GBGL (AWARD-11) – In this 52-week parallel-arm double-blind study, 1842 patients were randomized 1:1:1 to Trulicity 1.5 mg, Trulicity 3 mg or Trulicity 4.5 mg once weekly, all as add-on to metformin. Following randomization, all patients followed a dose escalation regimen starting with Trulicity 0.75 mg once weekly. The dose was increased every 4 weeks to the next higher dose until the patients reached the assigned study dose (1.5 mg, 3 mg or 4.5 mg). Patients were to remain on the assigned study dose for the duration of the study.
The primary objective of the study was to demonstrate the superiority of Trulicity 4.5 mg once weekly, Trulicity 3 mg once weekly or both to Trulicity 1.5 mg once weekly, in HbA1c reduction from baseline at 36 weeks in patients with inadequately controlled type 2 diabetes on metformin therapy.
At 36 weeks, treatment with Trulicity 4.5 mg resulted in a statistically significant reduction in HbA1c and body weight compared to Trulicity 1.5 mg (Table 10).
Table 10: Results at the 36-Week Primary Endpoint of Trulicity 3 mg and 4.5 mg Compared to Trulicity 1.5 mg, as Add-on to Metformin
| 36-Week Primary Time Point | |||||||||||
|---|---|---|---|---|---|---|---|---|---|---|---|
| Trulicity | |||||||||||
| 1.5 mg + MET | 3 mg + MET | 4.5 mg + MET | |||||||||
| Intent-to-Treat (ITT) Population (N) a | 612 | 616 | 614 | ||||||||
| HbA1c (%) (Mean) | |||||||||||
| Baseline HbA1c | 8.6 | 8.6 | 8.6 | ||||||||
| Change from baselineb | -1.5 | -1.6 | -1.8 | ||||||||
| Difference from 1.5 mgb (95% CI) | -- | -0.1 (-0.2, 0.0) | -0.2 (-0.4, -0.1)† | ||||||||
| Percentage of patients HbA1c < 7.0%c | 50 | 56 | 62 | ||||||||
| Fasting Serum Glucose (mmol/L) (Mean) | |||||||||||
| Baseline | 10.3 | 10.2 | 10.2 | ||||||||
| Change from baseline, adjusted meanb | -2.5 | -2.6 | -2.8 | ||||||||
| Body Weight (kg) (Mean) | |||||||||||
| Baseline | 95.5 | 96.3 | 95.4 | ||||||||
| Change from baseline, adjusted meanb | -3.0 | -3.8 | -4.6† | ||||||||
Abbreviations: HbA1c = hemoglobin A1c; MET=metformin
a For the ITT population, at Week 36, primary efficacy was missing for 7%, 7%, and 6% of individuals treated with Trulicity 1.5 mg, 3 mg and 4.5 mg, respectively.
b Least-squares mean adjusted for baseline value and other stratification factors. All values, including post-rescue data, were used in the analyses. Multiple imputation, using baseline and 36-week values from the 1.5 mg arm, was applied to model a washout of the treatment effect for patients missing 36-week values (HbA1c, fasting serum glucose and body weight).
c Patients with missing HbA1c data at Week 36 were considered as non-responders.
† p<0.001 for superiority compared to Trulicity 1.5 mg, overall type I error controlled using a graphical testing scheme.
Add on Combination Therapy to Metformin and Sulfonylurea
Study GBDB (AWARD-2) - In this 78-week open-label comparator study (double-blind with respect to Trulicity dose assignment), 807 patients were randomized and received Trulicity 0.75 mg or 1.5 mg once weekly, or insulin glargine once daily, all as add-on to maximally tolerated doses of metformin and glimepiride. Randomization occurred after a 10-week lead-in period; during the initial 2 weeks of the lead-in period, patients were titrated to maximally tolerated doses of metformin and glimepiride. This was followed by a 6 to 8 week glycemic stabilization period prior to randomization. Patients randomized to insulin glargine were started on a dose of 10 U once daily. Insulin glargine dose adjustments occurred twice weekly for the first 4 weeks of treatment based on self-measured fasting plasma glucose (FPG), followed by once weekly titration through Week 8 of study treatment, utilizing an algorithm with an FPG target of <5.6 mmol/L. After Week 8, patients continued to self-adjust insulin glargine to the FPG target; insulin glargine dose was also reviewed and revised, as needed, at subsequent office visits (Weeks 14, 20, 26, 35, 44, 52, 65, and 78). The dose of glimepiride could be reduced or discontinued after randomization (at the discretion of the investigator) in the event of persistent hypoglycemia. The primary objective of the study was to demonstrate the noninferiority of
Trulicity 1.5 mg once weekly compared to insulin glargine (titrated to target fasting glucose of <5.6 mmol/L), both on a background of metformin and glimepiride, in HbA1c reduction from baseline at 52 weeks, with a noninferiority margin of 0.4%. Only 23.5% of patients in the glargine group achieved the target fasting glucose. The dose of glimepiride was reduced or discontinued in 28%, 32%, and 29% of patients randomized to Trulicity 0.75 mg, Trulicity 1.5 mg, and glargine.
At the 52-week time point, Trulicity 0.75 mg and 1.5 mg were noninferior to insulin glargine for HbA1c change from baseline (Table 11).
Table 11: Results at the 52-Week Primary Endpoint of Trulicity Compared to Insulin Glargine, Both as Add-on to Metformin and Sulfonylureaa
| 52-Week Primary Time Point | ||||||||||||||
| Trulicity | Insulin Glargine + MET + GLIM | |||||||||||||
| 0.75 mg + MET + GLIM | 1.5 mg + MET + GLIM | |||||||||||||
| Intent-to-Treat (ITT) Population (N) | 272 | 273 | 262 | |||||||||||
| HbA1c (%) (Mean) | ||||||||||||||
| Baseline HbA1c | 8.1 | 8.2 | 8.1 | |||||||||||
| Change from baseline, adjusted meanb | -0.8 | -1.1 | -0.6 | |||||||||||
| Difference from insulin glargine + MET/GLIM arm, adjusted meanb (95% CI) | -0.1 (-0.3, 0.0) | -0.5 (-0.6, -0.3) | - | |||||||||||
| P value (non-inferiority) † | <0.001 | <0.001 | ||||||||||||
| Percentage of patients HbA1c <7.0% | 37 | 53 | 31 | |||||||||||
| Fasting Serum Glucose (mmol/L) (Mean) | ||||||||||||||
| Baseline | 8.96 | 9.16 | 9.08 | |||||||||||
| Change from baseline, adjusted mean | -0.87 | -1.50 | -1.76 | |||||||||||
| Body Weight (kg) (Mean) | ||||||||||||||
| Baseline | 86.4 | 85.2 | 87.6 | |||||||||||
| Change from baseline, adjusted mean | -1.3 | -1.9 | 1.4 | |||||||||||
| Postprandial Glucose (mmol/L) (Mean) | ||||||||||||||
| Baseline | 10.54 | 10.68 | 10.45 | |||||||||||
| Change from baseline, adjusted mean | -1.64 | -1.95 | -1.60 | |||||||||||
Abbreviation: GLIM = glimepiride; HbA1c = hemoglobin A1c; MET = metformin
a Intent-to-treat population using last observation on study prior to any rescue therapy. At Week 52, 15%, 9%, and 11% of individuals randomized to Trulicity 0.75 mg, Trulicity 1.5 mg and insulin glargine respectively, had missing data or were receiving rescue therapy and had their last observation prior to rescue or missing data carried forward for analysis.
b Least-squares mean from ANCOVA model adjusted for baseline value and country.
† Overall Type I error rate for treatment comparisons was controlled using a tree-gatekeeping strategy.
Add on Combination Therapy to SGLT2i With or Without Metformin
Study GBGE (AWARD-10) - In this 24-week placebo controlled double-blind study, 423 patients were randomized and received Trulicity 0.75 mg or 1.5 mg once weekly, or placebo, all as add-on to sodium glucose co-transporter 2 inhibitor (SGLT2i) with (96%) or without (4%) metformin. SGLT2i were used according to the local country label. Patients were randomized in a 1:1:1 ratio to Trulicity 0.75 mg, Trulicity 1.5 mg or placebo, with stratification for baseline HbA1c (≤8.0% [64 mmol/mol], >8.0% [64 mmol/mol]), dose of SGLT2i (“low” or “high”), and metformin use (“yes” or “no”).
The primary objective of the study was to demonstrate the superiority of Trulicity 0.75 mg and/or 1.5 mg once weekly to placebo, in HbA1c reduction from baseline at 24 weeks, in patients with inadequately controlled type 2 diabetes as defined as HbA1c 7-9.5% on concomitant SGLT2i therapy with or without metformin.
At 24 weeks of treatment, Trulicity 0.75 mg and 1.5 mg treatment resulted in a statistically significant greater reduction of HbA1c from baseline compared to placebo, each in combination with SGLT2 inhibitors with or without metformin (Table 12).
Table 12: Results at the 24-Week Primary Endpoint of Trulicity Compared to Placebo, Both as Add-on to SGLT2i With or Without Metformina
| Trulicity | Placebo + SGLT2i ± MET | ||||||||||
|---|---|---|---|---|---|---|---|---|---|---|---|
| 0.75 mg + SGLT2i ± MET | 1.5 mg + SGLT2i ± MET | ||||||||||
| Intent-to-Treat (ITT) Population (N) | 141 | 142 | 140 | ||||||||
| HbA1c (%) (Mean) | |||||||||||
| Baseline HbA1c | 8.0 | 8.0 | 8.1 | ||||||||
| Change from baselineb | -1.2 | -1.3 | -0.5 | ||||||||
| Difference from placebob (95% CI) | -0.7 (-0.8, -0.5) †† | -0.8 (-1.0, -0.6) †† | -- | ||||||||
| Percentage of patients HbA1c < 7.0%c | 58†† | 67†† | 31 | ||||||||
| Fasting Serum Glucose (mmol/L) (Mean) | |||||||||||
| Baseline | 8.99 | 8.91 | 8.50 | ||||||||
| Change from baseline, adjusted meanb | -1.40 | -1.67†† | -0.37 | ||||||||
| Body Weight (kg) (Mean) | |||||||||||
| Baseline | 91.1 | 92.9 | 90.5 | ||||||||
| Change from baseline, adjusted meanb | -2.8 | -3.2† | -2.3 | ||||||||
| Postprandial Glucose (mmol/L) (Mean) | |||||||||||
| Baseline | 10.34 | 10.16 | 10.36 | ||||||||
| Change from baseline, adjusted meanb | -1.94 | -2.22 | -0.92 | ||||||||
Abbreviations: HbA1c = hemoglobin A1c; SGLT2i = sodium glucose co-transporter 2 inhibitors; MET=metformin
a For the ITT population, at Week 24, primary efficacy was missing for 3.5%, 5.6%, and 2.9% of individuals treated with Trulicity 0.75 mg, Trulicity 1.5 mg, and placebo, respectively.
b Least-squares mean adjusted for baseline value and other stratification factors. All values, including post-rescue data, were used in the analyses. Placebo multiple imputation, using baseline and 24-week values from the placebo arm, was applied to model a washout of the treatment effect for patients missing 24-week values (HbA1c, fasting serum glucose, body weight and postprandial glucose).
c Patients with missing HbA1c data at Week 24 were considered as non-responders.
†† p<0.001, † p<0.05 for superiority of Trulicity compared to placebo, overall type I error controlled using a graphical testing scheme.
Combination Therapy with Insulin Lispro with or without Metformin
Study GBDD (AWARD-4) - In this 52-week open-label comparator study (double-blind with respect to Trulicity dose assignment), 884 patients on 1 or 2 insulin injections per day, alone or with oral antihyperglycemic therapy, were enrolled. Randomization occurred after a 9-week lead-in period; during the initial 2 weeks of the lead-in period, patients continued their pre-study insulin regimen but could be initiated and/or up-titrated on metformin, based on investigator discretion; this was followed by a 7-week glycemic stabilization period prior to randomization. At randomization, patients discontinued their pre-study insulin regimen and were randomized to Trulicity 0.75 mg or 1.5 mg once weekly, or insulin glargine once daily, all in combination with prandial insulin lispro 3 times daily, with or without metformin. Insulin lispro was titrated in both arms based on preprandial and bedtime glucose, and insulin glargine was titrated based on a target fasting glucose of <5.6 mmol/L. The primary objective of the study was to demonstrate noninferiority of Trulicity 1.5 mg once weekly compared to insulin glargine, both in combination with prandial insulin lispro, in HbA1c reduction from baseline at 26 weeks, with a noninferiority margin of 0.4%. Only 35.8% of patients in the glargine arm achieved their target fasting glucose.
At the 26-week time point, Trulicity 1.5 mg was noninferior to insulin glargine for HbA1c change from baseline. Trulicity 0.75 mg was also noninferior to insulin glargine (Table 13).
The mean total daily insulin lispro dose at Week 26 was 67.8 units, 96.7 units, and 93.2 units for the insulin glargine, Trulicity 0.75 mg, and Trulicity 1.5 mg study arms, respectively. The differences in total daily insulin lispro dose based upon pairwise comparisons with insulin glargine were statistically significantly higher for both doses of Trulicity.
Table 13: Results at the 26-Week Primary Endpoint of Trulicity Compared to Insulin Glargine, Both in Combination with Insulin Lisproa with or without Metformin
| 26-Week Primary Time Point | ||||||||||||
| Trulicity | Insulin Glargine + Insulin Lispro ± MET | |||||||||||
| 0.75 mg + Insulin Lispro ± MET | 1.5 mg + Insulin Lispro ± MET | |||||||||||
| Intent-to-Treat (ITT) Population (N) | 293 | 295 | 296 | |||||||||
| HbA1c (%) (Mean) | ||||||||||||
| Baseline HbA1c | 8.4 | 8.5 | 8.5 | |||||||||
| Change from baseline, adjusted meanb | -1.6 | -1.6 | -1.4 | |||||||||
| Difference from insulin glargine + insulin lispro arm, adjusted meanb (95% CI) | -0.2 (-0.3,-0.0) | -0.2 (-0.4, -0.1) | - | |||||||||
| P value (non-inferiority) † | <0.001 | <0.001 | ||||||||||
| Percentage of patients HbA1c <7.0% | 69 | 68 | 57 | |||||||||
| Fasting Serum Glucose (mmol/L) (Mean) | |||||
|---|---|---|---|---|---|
| Baseline | 8.34 | 8.73 | 8.56 | ||
| Change from baseline, adjusted mean | 0.22 | -0.27 | -1.58 | ||
| Body Weight (kg) (Mean) | |||||
| Baseline | 91.7 | 91.0 | 90.8 | ||
| Change from baseline, adjusted mean | 0.2 | -0.9 | 2.3 | ||
| Postprandial Glucose (mmol/L) (Mean) | |||||
| Baseline | 11.18 | 11.22 | 11.40 | ||
| Change from baseline, adjusted mean | -4.12 | -4.23 | -3.87 | ||
a Intent-to-treat population using last observation on study prior to any rescue therapy. At Week 26, 8%, 7% and 7% of individuals randomized to Trulicity 0.75 mg, Trulicity 1.5 mg and insulin glargine respectively, had missing data or were receiving rescue therapy and had their last observation prior to rescue or missing data carried forward for analysis.
b Least-squares mean from ANCOVA adjusted for baseline value, country, and use of metformin.
† Overall Type I error rate for treatment comparisons was controlled using a tree-gatekeeping strategy.
Combination Therapy with Insulin Lispro in Patients with Moderate to Severe CKD
Study GBDX (AWARD-7) – In this 52-week (26-week primary endpoint) randomized, open-label to active comparator (double-blind with respect to Trulicity dose assignment), 577 patients with type 2 diabetes and moderate to severe CKD on insulin therapy alone or with oral anti-hyperglycemic medications (OAMs) ± pramlintide were randomized to Trulicity 0.75 mg or 1.5 mg weekly or titrated insulin glargine at bedtime daily, all in combination with titrated lispro insulin before meals.
Randomization occurred after a 13-week lead-in period for patients on OAMs ± pramlintide and insulin during which OAMs ± pramlintide were discontinued and baseline insulin was optimized. Randomization occurred after a 3-week lead-in period for patients on insulin therapy alone during which the insulin regimen and doses remained stable.
Patients were stratified for randomization according to severity of CKD (Stage 3a, 3b, or 4) and a composite of macroalbuminuria and geography. The total enrollment was controlled to ensure a 2:1 ratio of patients with moderate (Stage 3a or 3b) or severe (Stage 4) CKD, respectively. The numbers and proportions of patients with moderate (Stage 3a or 3b) or severe (Stage 4) CKD were 402 (70%) and 175 (30%), respectively.
At randomization, patients discontinued their prestudy insulin regimen and patients were randomized to Trulicity 0.75 mg once weekly, Trulicity 1.5 mg once weekly, or insulin glargine once daily, all in combination with prandial insulin lispro. For patients randomized to insulin glargine, the initial insulin glargine dose was based on the basal insulin dose prior to randomization. Insulin glargine was allowed to be titrated with a fasting plasma glucose goal of ≤8.3 mmol/L. Insulin lispro doses were adjusted based on pre-lunch, pre-dinner, and bedtime plasma target glucose values of ≤ 10.0 mmol/L.
The primary objective of the study was to demonstrate that the effect of Trulicity on HbA1c (measured as change from baseline) in the treatment of patients with type 2 diabetes and moderate or severe CKD was at least non-inferior compared with insulin glargine at 26 weeks (non-inferiority margin of 0.4%).
At the 26-week time point, Trulicity 0.75 mg and 1.5 mg were noninferior to insulin glargine for HbA1c change from baseline (Table 14). The mean total daily insulin lispro dose at Week 26 was 37.4 units, 47.1 units, and 39 units for the insulin glargine, Trulicity 0.75 mg, and Trulicity 1.5 mg study arms, respectively.
Table 14: Results at the 26-Week Primary Endpoint of Trulicity Compared to Insulin Glargine, Both in Combination with Insulin Lisproa in Patients with Moderate or Severe CKD
| 26-Week Primary Time Point | |||||||||||||||
|---|---|---|---|---|---|---|---|---|---|---|---|---|---|---|---|
| Trulicity | Insulin Glargine + Insulin Lispro | ||||||||||||||
| 0.75 mg + Insulin Lispro | 1.5 mg + Insulin Lispro | ||||||||||||||
| Intent-to-Treat (ITT) Population (N)a | 190 | 192 | 194 | ||||||||||||
| HbA1c (%) (Mean) | |||||||||||||||
| Baseline HbA1c | 8.6 | 8.6 | 8.6 | ||||||||||||
| Change from baseline, adjusted meanb | -0.9 | -1.0 | -1.0 | ||||||||||||
| Difference from insulin glargine + insulin lispro arm, adjusted meanb (95% CI) | 0.0 (-0.2, 0.3) | -0.1 (-0.3, 0.2) | - | ||||||||||||
| P value (non-inferiority) † | <0.001 | <0.001 | - | ||||||||||||
| Percentage of patients HbA1c <7.0% | 31 | 35 | 35 | ||||||||||||
| Percentage of patients HbA1c <8.0% | 73 | 75 | 74 | ||||||||||||
| Fasting Serum Glucose (mmol/L) (Mean) | |||||||||||||||
| Baseline | 9.28 | 8.91 | 9.42 | ||||||||||||
| Change from baseline, adjusted mean | 0.36 | 0.77 | -1.29 | ||||||||||||
| Body Weight (kg) (Mean) | |||||||||||||||
| Baseline | 90.9 | 88.1 | 88.2 | ||||||||||||
| Change from baseline, adjusted mean | -1.1 | -2.0 | 1.9 | ||||||||||||
| Postprandial Glucose (mmol/L) (Mean) | |||||||||||||||
| Baseline | 11.70 | 11.34 | 11.40 | ||||||||||||
| Change from baseline, adjusted mean | -2.60 | -2.69 | -2.73 | ||||||||||||
a All randomized patients who received at least 1 dose of study drug. At Week 26, 12%, 15%, and 9% of individuals randomized to Trulicity 0.75 mg, Trulicity 1.5 mg, and insulin glargine were missing primary efficacy data.
b Least-squares mean adjusted for baseline and stratification factors. All values, regardless of whether the patient was on study drug and/or received rescue medication, were included in the analyses. Multiple imputation by treatment group and adherence (yes, no) was applied for patients missing 26-week values.
† Overall Type I error rate for treatment comparisons was controlled using a gatekeeping strategy.
Fasting serum glucose increased from baseline by 0.36 mmol/L and 0.77 mmol/L in the Trulicity 0.75 mg and Trulicity 1.5 mg arms, respectively, compared to a decrease of 1.29 mmol/L in the glargine arm.
Add on Combination Therapy to Insulin Glargine with or without Metformin
Study GBDI (AWARD-9) - In this 28-week randomized double-blind, parallel arm, placebo-controlled study, 300 patients on insulin glargine for at least 3 months, alone or with stable metformin therapy, were enrolled. Randomization occurred after a 2-week lead-in period in patients who required further up-titration of the insulin glargine dose per TTT (treat-to-target) algorithm at the end of the lead-in period. At randomization, patients were randomized to Trulicity 1.5 mg once weekly, or matching placebo once weekly, added to insulin glargine with metformin [88%] or without metformin [12%]. At randomization, the initial insulin glargine dose in patients with HbA1c < 8.0% was reduced by 20%. After an initial 4 week stabilization period, insulin glargine was titrated based on a target fasting glucose of <5.6 mmol/L. The primary objective of the study was to demonstrate superiority of Trulicity 1.5 mg once weekly compared to placebo, both in combination with titrated basal insulin glargine with or without metformin, in HbA1c reduction from baseline at 28 weeks.
At the 28-week time point, Trulicity 1.5 mg was superior to placebo for HbA1c change from baseline (p<0.001) (Table 15). There were 49.3% and 37.9% of patients on Trulicity and placebo, respectively who achieved the target fasting serum glucose <5.6 mmol/L.
The least-squares mean daily insulin glargine dose at Week 28 was 51.4 units, and 64.6 units for the Trulicity and placebo study arms, respectively. The least-squares mean daily insulin glargine increase from baseline was 12.8 units for Trulicity and 25.9 units for placebo.
Table 15: Results of a 28-Week Study of Trulicity Compared to Placebo, as Add-On to Titrated Basal Insulin Glargine With or Without Metformina
| 28-Week Primary Time Point | |||||||||
|---|---|---|---|---|---|---|---|---|---|
Trulicity 1.5 mg | Placebo | ||||||||
| Intent-to-Treat (ITT) Population (N) | 150 | 150 | |||||||
| HbA1c (%) (Mean) | |||||||||
| Baseline HbA1c | 8.4 | 8.3 | |||||||
| Change from baseline, adjusted meanb | -1.4 | -0.7 | |||||||
| Difference from placebob (95% CI) | -0.7 (-0.9, -0.5) | - | |||||||
| P value (superiority) | <0.001 | ||||||||
| Percentage of patients HbA1c <7.0%c | 67 | 33 | |||||||
| Fasting Serum Glucose (mmol/L) (Mean) | |||||||||
| Baseline | 8.71 | 8.68 | |||||||
| Change from baseline, adjusted meanb | -2.44 | -1.68 | |||||||
| Body Weight (kg) (Mean) | |||||||||
| Baseline | 93.3 | 92.6 | |||||||
| Change from baseline, adjusted meanb | -1.3 | 0.8 | |||||||
| Postprandial Glucose (mmol/L) (Mean) | |||||||||
| Baseline | 11.51 | 11.22 | |||||||
| Change from baseline, adjusted meanb | -3.05 | -2.23 | |||||||
Abbreviation: ANCOVA = analysis of covariance; CI = confidence interval; HbA1c = hemoglobin A1c; N = total number of patients.
a Intent-to-treat population. At Week 28, 12% of placebo patients and 8% of Trulicity 1.5 mg patients had missing data. Rescue therapy was not allowed in Study GBDI.
b Least-squares mean from ANCOVA adjusted for baseline value and other stratification factors. Placebo multiple imputation, with respect to baseline values, was used to model a wash-out of the treatment effect for subjects having missing Week 28 data.
c Patients with missing HbA1c data at Week 28 were considered as non-responders.
Use in Patients with Type 2 Diabetes who have Multiple Cardiovascular Risk Factors or Established Cardiovascular Disease
Study GBDJ (REWIND) was a multi-national, multi-center, randomized, placebo-controlled, double-blind trial. In this study, 9901 adult patients with type 2 diabetes mellitus and multiple cardiovascular risk factors or established cardiovascular (CV) disease were randomized to Trulicity 1.5 mg or placebo. The median follow-up duration was 5.4 years. The primary endpoint was the time to the first occurrence of a composite 3-component Major Adverse Cardiovascular Events (MACE) outcome, which included cardiovascular death, non-fatal myocardial infarction, and non-fatal stroke. The study evaluated if Trulicity reduces MACE compared to placebo, when added to standard of care treatments for patients with type 2 diabetes.
Patients eligible to enter the trial were 50 years of age or older who had type 2 diabetes mellitus, had an HbA1c value ≤9.5% at screening, and had either established cardiovascular disease, or did not have established cardiovascular disease but had multiple cardiovascular risk factors. Patients who were confirmed to have established cardiovascular disease (31.5% of randomized patients) had a history of at least one of the following: myocardial infarction; myocardial ischemia by a stress test or with cardiac imaging; ischemic stroke; coronary, carotid, or peripheral artery revascularization; unstable angina; or hospitalization for unstable angina with at least one of the following: ECG changes, myocardial ischemia on imaging, or a need for percutaneous coronary intervention. Patients confirmed to be without established cardiovascular disease, but with multiple cardiovascular risk factors, comprised 62.8% of the randomized trial population.
At baseline, demographic and disease characteristics were balanced between treatment groups. Patients had a mean age of 66 years; 46% were female; race: White, Black, and Asian were 76%, 7%, and 4%, respectively.
The median baseline HbA1c was 7.2%; the majority of patients had a baseline HbA1c ranging from 6.0% - 8.9% (10th - 90th percentile). The mean duration of type 2 diabetes was 10.5 years and the mean BMI was 32.3 kg/m2.
At baseline 50.5% of patients had mild renal impairment (eGFR ≥60 but <90 mL/min/1.73 m2), 21.6% had moderate renal impairment (eGFR ≥30 but <60 mL/min/1.73 m2), and 1.1% of patients had severe renal impairment (eGFR <30 mL/min/1.73 m2) out of 9713 patients whose eGFR were available.
At baseline, 94.7% of patients were taking antidiabetic medication, with 10.5% of patients taking three or more antidiabetic drugs. The most common background antidiabetic drugs used at baseline were metformin (81.2%), sulfonylurea (46.0%), and insulin (23.9%). At baseline, cardiovascular disease and risk factors were managed with ACE inhibitors or angiotensin receptor blockers (81.5%), beta blockers (45.6%), calcium channel blockers (34.4%), diuretics (46.5%), statin therapy (66.1%), antithrombotic agents (58.7%) including aspirin (51.7%). The Trulicity and placebo groups were generally balanced in terms of concomitant medications (anti-diabetic and cardiovascular medications including antihypertensives, diuretics, lipid-lowering, and platelet aggregation inhibitors). During the trial, investigators were to modify anti-diabetic and cardiovascular medications to achieve local standard of care treatment targets with respect to blood glucose, lipids, and blood pressure, and manage patients recovering from an acute coronary syndrome or stroke event per local treatment guidelines.
The primary analysis model was a Cox proportional hazards regression model for the time to the first occurrence of a primary endpoint event, with treatment as a fixed effect calculated using the Intent to Treat (ITT) population (all randomized patients).
Trulicity reduced the risk of MACE by 12% as compared to placebo (HR: 0.88, 95% CI 0.79, 0.99) in persons with type 2 diabetes mellitus who have multiple cardiovascular risk factors or established cardiovascular disease (Figure 2 and Figure 3).
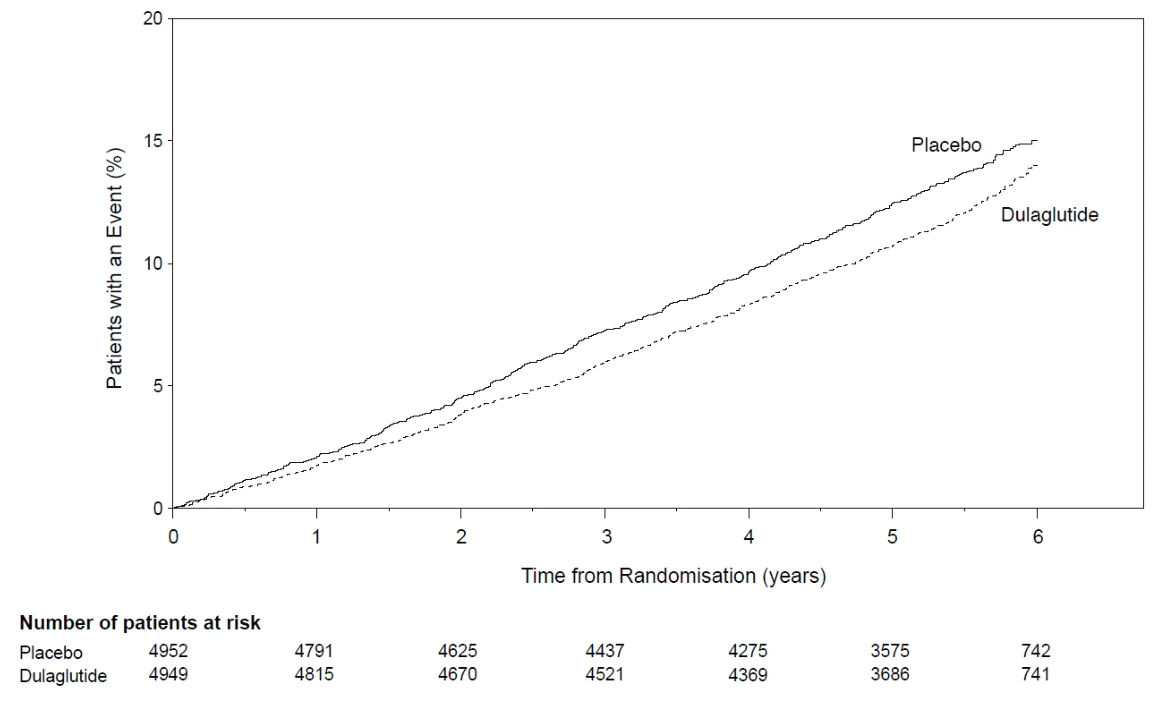
Figure 2: Kaplan-Meier plot of time to first MACE in the REWIND trial
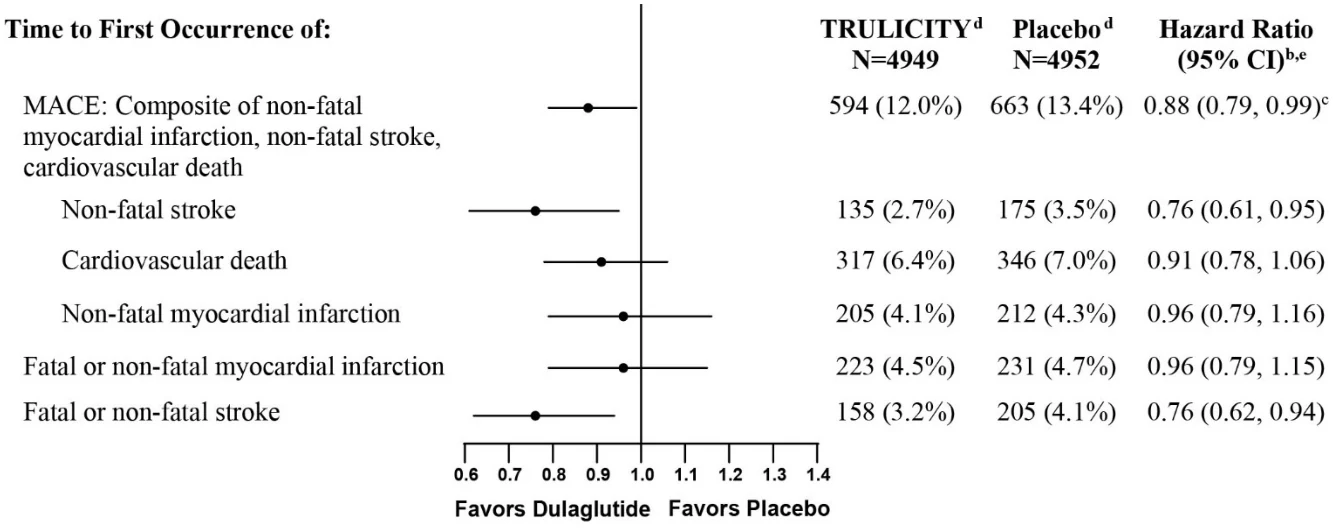
a All randomized patients.
b Cox-proportional hazards model with treatment as a factor. Type I error was controlled for the primary and secondary endpoints.
c p=0.026 for superiority (2-sided).
d Number and percentage of patients with events.
e Results for components of MACE, fatal or non-fatal stroke, and fatal or non-fatal MI are listed descriptively for supportive purposes. CIs are not adjusted for multiplicity.
Figure 3: Treatment Effect for MACE and the Individual Components in the REWIND Trial, Median Study Observation Time of 5.4 yearsa
At month 3, the LS mean difference (95% CI) in HbA1c between Trulicity and placebo was -0.82 (-0.86, -0.79)%. At month 60, the LS mean difference (95% CI) in HbA1c between Trulicity and placebo was -0.51 (-0.57, -0.45)%.
15 MICROBIOLOGY
No microbiological information is required for this drug product.
16 NON-CLINICALTOXICOLOGY
General Toxicology (single and repeat-dose studies): Dulaglutide was administered by subcutaneous injection twice weekly to rats and cynomolgus monkeys, up to doses of 20 mg/kg body weight (90x human exposure) and 10 mg/kg bw (199x human exposure), respectively. Primary findings were consistent with the pharmacological activity of GLP-1R agonists and included decreased food consumption, transient reductions in body weight gain and clinical signs, including rough hair coat (rats), transient vomiting and dehydration (monkeys), thin appearance and reduced/absent feces.
Carcinogenicity
A 2-year carcinogenicity study was conducted with dulaglutide in male and female rats at doses of 0.05, 0.5, 1.5, and 5.0 mg/kg body weight (bw) administered by subcutaneous injection twice weekly. In both genders of rats, >0.5 mg/kg bw dulaglutide caused a dose-related and treatment-duration-dependent increase in the incidence of thyroid C-cell tumors (adenomas and/or carcinomas) compared to controls. A statistically significant increase in C-cell adenomas was observed in rats of both genders receiving dulaglutide at doses >0.5 mg/kg bw. Numerical increases in thyroid C-cell carcinomas occurred at doses of 0.5 mg/kg bw and were considered to be treatment-related despite the absence of statistical significance.
A 6-month carcinogenicity study was conducted with dulaglutide in rasH2 transgenic mice at doses of 0.3, 1.0, and 3.0 mg/kg bw administered by subcutaneous injection twice weekly. Dulaglutide did not produce increased incidences of thyroid C-cell hyperplasia or neoplasia at any dose.
Human relevance of thyroid C-cell tumors in rats is unknown and could not be determined by clinical studies or nonclinical studies (see 3 SERIOUS WARNINGS AND PRECAUTIONS BOX and 7 WARNINGS AND PRECAUTIONS).
Genotoxicity: Genotoxicity studies have not been conducted with dulaglutide.
Reproductive and Developmental Toxicology:
In fertility and early embryonic development studies in male and female rats, no adverse effects of dulaglutide on sperm morphology, mating, fertility, conception, and embryonic survival were observed at doses up to 16.3 mg/kg bw. An increase in the number of females with prolonged diestrus and decreased numbers of corpus lutea resulting in lower number or implantation sites and viable embryos was observed at doses ≥4.89 mg/kg bw. Fetal evaluation revealed dose related decreases in body weight and higher litter proportions of reduced ossification of the skull and vertebral arches, and unossified sternebrae and hyoid at doses ≥4.89 mg/kg bw. These changes in skeletal ossification were considered secondary to reduced fetal weight.
Special Toxicology:
Zucker diabetic fatty (ZDF) rats were administered dulaglutide twice weekly by subcutaneous injections at doses of 0.5, 1.5, or 5.0 mg/kg bw. Increases of 12% to 33% in total and pancreatic amylase, but not lipase, were observed at all doses without microscopic pancreatic inflammatory correlates in individual animals. Other changes in the dulaglutide-treated animals included increased interlobular ductal epithelium without active ductal cell proliferation (≥0.5 mg/kg bw), increased acinar atrophy with/without inflammation (≥1.5 mg/kg bw), and increased neutrophilic inflammation of the acinar pancreas (5 mg/kg bw).
Treatment of monkeys for 12 months with 8.15 mg/kg bw dulaglutide twice weekly showed no evidence of pancreatic inflammation or pancreatic intraepithelial neoplasia. In 4 of 19 monkeys on dulaglutide treatment, there was an increase in goblet cells within the pancreatic ducts, but no differences from the control group in total amylase or lipase at study termination. There were no proliferative changes in the thyroid C-cells.
Juvenile Toxicity:
In a juvenile toxicity study in rats, no dulaglutide-related effects were observed on neurobehavioral endpoints including motor activity, auditory startle responsiveness, and learning and memory assessments at the highest dose of 7 mg/kg bw (38.2-fold the maximum recommended human dose [MRHD] based on AUC). Changes in reproductive endocrine hormones (LH, GH, and estrogen) in male and female rats and earlier sexual maturation in female rats were observed at 38.2-fold the MRHD based on AUC. The apparent earlier onset of puberty in the female rats was still within the normal range for this strain of rats and was only seen at 38.2-fold the MRHD based on AUC. Thus, this effect was not considered to have relevance for humans in a recommended dosing range.