


Product Monograph - Sandoz Canagliflozin
RECENT MAJOR LABEL CHANGES
| 4 DOSAGE AND ADMINISTRATION, 4.1 Dosing Considerations | 10/2024 |
|---|---|
| 7 WARNINGS AND PRECAUTIONS, Endocrine and Metabolism | 10/2024 |
| 7 WARNINGS AND PRECAUTIONS, Reproductive Health: Female and Male Potential | 10/2024 |
| 7 WARNINGS AND PRECAUTIONS, 7.1.1 Pregnant Women | 10/2024 |
TABLE OF CONTENTS
Sections or subsections that are not applicable at the time of authorization are not listed.
RECENT MAJOR LABEL CHANGES ............................................................................................. 2
TABLE OF CONTENTS ................................................................................................................ 2
PART I: HEALTH PROFESSIONAL INFORMATION ....................................................................... 5
1 INDICATIONS ................................................................................................................ 5
1.1 Pediatrics ................................................................................................................. 5
1.2 Geriatrics ................................................................................................................. 5
2 CONTRAINDICATIONS ................................................................................................... 6
3 SERIOUS WARNINGS AND PRECAUTIONS BOX .............................................................. 6
4 DOSAGE AND ADMINISTRATION .................................................................................. 7
4.1 Dosing Considerations ............................................................................................. 7
4.2 Recommended Dose and Dosage Adjustment ......................................................... 7
4.4 Administration ......................................................................................................... 8
4.5 Missed Dose ............................................................................................................. 9
5 OVERDOSAGE ............................................................................................................... 9
6 DOSAGE FORMS, STRENGTHS, COMPOSITION AND PACKAGING .................................. 9
7 WARNINGS AND PRECAUTIONS .................................................................................. 10
7.1 Special Populations ................................................................................................ 17
7.1.1 Pregnant Women .............................................................................................. 17
7.1.2 Breast-feeding ................................................................................................... 17
7.1.3 Pediatrics ........................................................................................................... 17
7.1.4 Geriatrics ........................................................................................................... 17
7.1.5 Hepatic Impairment .......................................................................................... 18
8 ADVERSE REACTIONS .................................................................................................. 18
8.1 Adverse Reaction Overview ................................................................................... 18
8.2 Clinical Trial Adverse Reactions ............................................................................. 18
8.3 Less Common Clinical Trial Adverse Reactions ...................................................... 27
8.4 Abnormal Laboratory Findings: Hematologic, Clinical Chemistry and Other Quantitative Data ............................................................................................................ 35
8.5 Post-Market Adverse Reactions ............................................................................. 38
9 DRUG INTERACTIONS ................................................................................................. 39
9.2 Drug Interactions Overview ................................................................................... 39
9.3 Drug-Behavioural Interactions ............................................................................... 39
9.4 Drug-Drug Interactions .......................................................................................... 39
9.5 Drug-Food Interactions .......................................................................................... 42
9.6 Drug-Herb Interactions .......................................................................................... 42
9.7 Drug-Laboratory Test Interactions ......................................................................... 42
10 CLINICAL PHARMACOLOGY ......................................................................................... 43
10.1 Mechanism of Action ......................................................................................... 43
10.2 Pharmacodynamics ............................................................................................ 43
10.3 Pharmacokinetics ............................................................................................... 44
11 STORAGE, STABILITY AND DISPOSAL .......................................................................... 48
12 SPECIAL HANDLING INSTRUCTIONS ............................................................................ 48
PART II: SCIENTIFIC INFORMATION ....................................................................................... 49
13 PHARMACEUTICAL INFORMATION ............................................................................. 49
14 CLINICAL TRIALS ......................................................................................................... 50
14.1 Clinical Trials by Indication ................................................................................. 50
Type 2 Diabetes Mellitus ................................................................................................. 50
Cardiovascular Outcomes ................................................................................................ 69
Diabetic Nephropathy ..................................................................................................... 74
14.2 Comparative Bioavailability Studies ................................................................... 79
15 MICROBIOLOGY .......................................................................................................... 80
16 NON-CLINICAL TOXICOLOGY ....................................................................................... 80
17 SUPPORTING PRODUCT MONOGRAPHS ..................................................................... 82
PATIENT MEDICATION INFORMATION ................................................................................... 83
PART I: HEALTH PROFESSIONAL INFORMATION
1 INDICATIONS
Monotherapy:
Sandoz Canagliflozin (canagliflozin) is indicated as an adjunct to diet and exercise to improve glycemic control in adult patients with type 2 diabetes mellitus for whom metformin is inappropriate due to contraindications or intolerance.
Add-on combination:
Sandoz Canagliflozin (canagliflozin) is indicated for use in adult patients with type 2 diabetes mellitus to improve glycemic control in combination with:
- metformin
- sulfonylurea (with or without metformin)
- pioglitazone with metformin
- insulin (with or without metformin)
when the therapy listed above, along with diet and exercise, does not provide adequate glycemic control (see 14 CLINICAL TRIALS).
Add-On Combination in Patients with Established Cardiovascular Disease:
Sandoz Canagliflozin is indicated as an adjunct to diet, exercise, and standard of care therapy to reduce the risk of major adverse cardiovascular events (cardiovascular death, nonfatal myocardial infarction and nonfatal stroke) in adults with type 2 diabetes mellitus and established cardiovascular disease (CVD).
Patients with Diabetic Nephropathy:
Sandoz Canagliflozin is indicated as an adjunct to diet, exercise, and standard of care therapy to reduce the risk of end-stage kidney disease, doubling of serum creatinine, and cardiovascular (CV) death in adult patients with type 2 diabetes mellitus and diabetic nephropathy with albuminuria (>33.9 mg/mmol).
1.1 Pediatrics
The safety and efficacy of canagliflozin in pediatric patients under 18 years of age have not been established; therefore, Health Canada has not authorized an indication for pediatric use.
1.2 Geriatrics
Patients 65 years and older had a higher incidence of adverse reactions related to reduced intravascular volume with canagliflozin, including hypotension, postural dizziness, orthostatic hypotension, syncope, and dehydration. Reactions were more common in patients over 75 years of age and with the 300 mg daily (see 7.1.4 Geriatrics, 8 ADVERSE REACTIONS, Elderly Patients, 4 DOSAGE AND ADMINISTRATION, Geriatrics).
Smaller reductions in HbA1c with canagliflozin relative to placebo were seen in patients 65 years and older, compared to younger patients (see 7.1 Special Populations).
2 CONTRAINDICATIONS
- Patients who are hypersensitive to this drug or to any ingredient in the formulation or component of the container. For a complete listing, see 6 DOSAGE FORMS, STRENGTHS, COMPOSITION AND PACKAGING.
- Patients on dialysis (see 4 DOSAGE AND ADMINISTRATION).
3 SERIOUS WARNINGS AND PRECAUTIONS BOX
Serious Warnings and Precautions
Diabetic Ketoacidosis
- Clinical trial and post-market cases of diabetic ketoacidosis (DKA), a serious life-threatening condition requiring urgent hospitalization, have been reported in patients with type 2 diabetes mellitus (T2DM) treated with canagliflozin, or other sodium-glucose co-transporter 2 (SGLT2) inhibitors. Fatal cases of DKA have been reported in patients taking canagliflozin. A number of these cases have been atypical with blood glucose values below 13.9 mmol/L (250 mg/dL) (see 8 ADVERSE REACTIONS, Description of Selected Adverse Reactions).
- The risk of DKA must be considered in the event of non-specific symptoms such as difficulty breathing, nausea, vomiting, abdominal pain, confusion, anorexia, excessive thirst and unusual fatigue or sleepiness. If these symptoms occur, regardless of blood glucose level, Sandoz Canagliflozin treatment should be immediately discontinued, and patients should be assessed for DKA immediately.
- Sandoz Canagliflozin should not be used for the treatment of DKA or in patients with a history of DKA.
- Nephropathy may increase the risk of DKA during treatment with Sandoz Canagliflozin.
- Sandoz Canagliflozin is not indicated, and should not be used, in patients with type 1 diabetes.
- See 7 WARNINGS AND PRECAUTIONS, Endocrine and Metabolism.
Lower Limb Amputation
An approximately 2-fold increased risk of lower limb amputations associated with
- canagliflozin use was observed in CANVAS and CANVAS-R, two large, randomized, placebo-controlled trials in patients with type 2 diabetes who had established cardiovascular disease (CVD) or were at risk for CVD.
- Amputations of the toe and midfoot were most frequent; however, amputations involving the leg were also observed. Some patients had multiple amputations, some involving both limbs.
- Before initiating Sandoz Canagliflozin, consider factors that may increase the risk of amputation, such as a history of prior amputation, peripheral vascular disease, neuropathy, and diabetic foot ulcers.
- Monitor patients receiving Sandoz Canagliflozin for infection, new pain or tenderness, sores or ulcers involving the lower limbs, and discontinue Sandoz Canagliflozin if these complications occur.
- See 7 WARNINGS AND PRECAUTIONS, Cardiovascular.
4 DOSAGE AND ADMINISTRATION
4.1 Dosing Considerations
- Renal function should be assessed before initiating Sandoz Canagliflozin and periodically thereafter (see 7 WARNINGS AND PRECAUTIONS, Renal). In patients with volume depletion not previously treated with canagliflozin, normalize volume status before initiating Sandoz Canagliflozin (see 7 WARNINGS AND PRECAUTIONS, Cardiovascular).
- Concomitant Use with Insulin or an Insulin Secretagogue (e.g., Sulfonylurea): When Sandoz Canagliflozin is used as add-on therapy with insulin or an insulin secretagogue (e.g., sulfonylurea), a lower dose of insulin or the insulin secretagogue may be considered to reduce the risk of hypoglycemia (see 7 WARNINGS AND PRECAUTIONS, Endocrine and Metabolism and 8 ADVERSE REACTIONS).
- Temporary Interruption for Surgery: Sandoz Canagliflozin treatment should be interrupted for a minimum of 3 days, when possible, prior to major surgery or procedures associated with prolonged fasting. Monitor for DKA in the post-operative period. Ensure risk factors for ketoacidosis are resolved and that the patient is clinically stable and has resumed oral intake before considering Sandoz Canagliflozin treatment re-initiation (see 7 WARNINGS AND PRECAUTIONS, Endocrine and Metabolism).
- Sandoz Canagliflozin is not recommended for use in patients on loop diuretics (see 9.4 Drug-Drug Interactions).
4.2 Recommended Dose and Dosage Adjustment
See Table 1 for dosage recommendations based on estimated glomerular filtration rate (eGFR).
| Table 1: Recommended Dosage | ||
|---|---|---|
Estimated glomerular filtration rate eGFR (mL/min/1.73 m2) | Recommended Dosage | |
| eGFR ≥ 60 | 100 mg orally once daily, taken before the first meal of the day. Dose can be increased to 300 mg once daily for additional glycemic control. | |
| eGFR 30 to < 60 | 100 mg once daily | |
| On dialysis | Contraindicated (see 2 CONTRAINDICATIONS) | |
There are insufficient data to support dosing recommendations for initiation of therapy in patients with an eGFR < 30 mL/min/1.73 m2. In patients already initiated on therapy who meet the criterion of an eGFR < 30 mL/min/1.73 m2 with albuminuria >33.9 mg/mmol, therapy can be continued at 100 mg once daily.
Concomitant Use with UDP-Glucuronosyl Transferase (UGT) Enzyme Inducers: If an inducer of UGTs and drug transport systems (e.g., rifampin, phenytoin, barbiturates, phenobarbital, ritonavir, carbamazepine, efavirenz, St John’s wort [Hypericum perforatum]) is co-administered with Sandoz Canagliflozin, monitor HbA1c in patients receiving Sandoz Canagliflozin 100 mg once daily and consider increasing the dose to 300 mg once daily in patients currently tolerating Sandoz Canagliflozin 100 mg once daily with an eGFR ≥60 mL/min/1.73 m2 or CrCl ≥ 60 mL/min and require additional glycemic control. Consider another antihyperglycemic agent in patients with an eGFR of 45 to less than 60 mL/min/1.73 m2 receiving concurrent therapy with a UGT inducer.
Pediatrics (< 18 years of age): The safety and efficacy of canagliflozin have not been established in pediatric patients; therefore, Health Canada has not authorized an indication for pediatric use.
Geriatrics (≥ 65 years of age): Renal function and risk of volume depletion should be taken into account. For those patients who are tolerating Sandoz Canagliflozin 100 mg and who need more glycemic control, the dose can be increased to Sandoz Canagliflozin 300 mg (see 7 WARNINGS AND PRECAUTIONS and 8 ADVERSE REACTIONS).
Hepatic Impairment: Canagliflozin has not been studied in patients with severe hepatic impairment and is therefore not recommended for use in this patient population. No dose adjustment is necessary in patients with mild or moderate hepatic impairment.
4.4 Administration
Sandoz Canagliflozin should be taken orally once a day, preferably before the first meal of the day, due to the potential to reduce postprandial plasma glucose excursions through delayed intestinal glucose absorption. However, Sandoz Canagliflozin may be taken with or without food. Tablets are to be swallowed whole.
4.5 Missed Dose
If a dose of Sandoz Canagliflozin is missed, the patient should be advised to take one dose as soon as they remember and the next dose at the usual time. A double dose of Sandoz Canagliflozin should not be taken on the same day.
5 OVERDOSAGE
In the event of an overdose, contact the Poison Control Centre. It is also reasonable to employ the usual supportive measures, e.g., remove unabsorbed material from the gastrointestinal tract, employ clinical monitoring, and institute supportive treatment as dictated by the patient’s clinical status. Canagliflozin was negligibly removed during a 4-hour hemodialysis session. Canagliflozin is not expected to be dialyzable by peritoneal dialysis.
For management of a suspected drug overdose, contact your regional poison control centre.
6 DOSAGE FORMS, STRENGTHS, COMPOSITION AND PACKAGING
Table 2: Dosage Forms, Strengths, Composition and Packaging
| Route of Administration | Dosage Form / Strength / Composition | Non-medicinal Ingredients |
| Oral | Tablets / 100 mg and 300 mg | Each tablet contains the following non-medicinal ingredients: Core Tablet: croscarmellose sodium, hydroxypropyl cellulose, lactose anhydrous, magnesium stearate, and microcrystalline cellulose. Film Coat: ferric oxide yellow and red (100 mg tablet only), Macrogol poly (vinyl alcohol), talc, and titanium dioxide. |
Sandoz Canagliflozin is supplied as film-coated, immediate-release tablets for oral administration. Each tablet strength contains canagliflozin drug substance as the hemihydrate equivalent to 100- and 300-mg doses of canagliflozin, respectively. Both tablet strengths are supplied as blisters in cartons of 30 tablets and in bottles of 30, 90, 100 and 500 tablets.
100 mg tablets: Yellow, oval biconvex film coated tablet debossed with CN1 on one side.
300 mg tablets: White to off white, oval biconvex film coated tablet debossed with CN2 on one side.
7 WARNINGS AND PRECAUTIONS
See 3 SERIOUS WARNINGS AND PRECAUTIONS BOX.
Cardiovascular
Lower limb amputation
An approximately 2-fold increased risk of lower limb amputations associated with canagliflozin use was observed in CANVAS and CANVAS-R, two large, randomized, placebo-controlled trials evaluating patients with type 2 diabetes who had either established cardiovascular disease or were at risk for cardiovascular disease. In CANVAS, canagliflozin-treated patients and placebo-treated patients had 5.9 and 2.8 amputations per 1000 patients per year, respectively. In CANVAS-R, canagliflozin-treated patients and placebo-treated patients had 7.5 and 4.2 amputations per 1000 patients per year, respectively. The risk of lower limb amputations was observed at both the 100 mg and 300 mg once daily dosage regimens. The amputation data for CANVAS and CANVAS-R are shown in Tables 11 and 12, respectively (see 8 ADVERSE REACTIONS, Description of Selected Adverse Reactions).
Amputations of the toe and midfoot (99 out of 140 patients with amputations receiving canagliflozin in the two trials) were the most frequent; however, amputations involving the leg, below and above the knee, were also observed (41 out of 140 patients with amputations receiving canagliflozin in the two trials). Some patients had multiple amputations, some involving both lower limbs. Lower limb infections, gangrene, and diabetic foot ulcers were the most common precipitating medical events leading to the need for an amputation. The risk of amputation was highest in patients with a baseline history of prior amputation, peripheral vascular disease, and neuropathy.
Before initiating Sandoz Canagliflozin, consider factors in the patient history that may predispose to the need for amputations, such as a history of prior amputation, peripheral vascular disease, neuropathy and diabetic foot ulcers. Counsel patients about the importance of routine preventative foot care and adequate hydration. Monitor patients receiving Sandoz Canagliflozin for signs and symptoms of infection (including osteomyelitis), new pain or tenderness, sores or ulcers involving the lower limbs, and discontinue Sandoz Canagliflozin if these complications occur.
Reduced Intravascular Volume
Due to its mechanism of action, Sandoz Canagliflozin increases urinary glucose excretion (UGE) and induces an osmotic diuresis, which may reduce intravascular volume.
Patients most susceptible to adverse reactions related to reduced intravascular volume (e.g., postural dizziness, orthostatic hypotension, hypotension or renal failure) include patients with moderate renal impairment, elderly patients, patients on loop diuretics or medications that interfere with the renin-angiotensin-aldosterone system (e.g., angiotensin-converting-enzyme [ACE] inhibitors, angiotensin receptor blockers [ARBs]), and patients with low systolic blood pressure (see 8 ADVERSE REACTIONS, Description of Selected Adverse Reactions, 9.3 Drug-Behavioural Interactions and 4.1 Dosing Considerations). Before initiating Sandoz Canagliflozin in patients with one or more of these characteristics, volume status should be assessed and any volume depletion corrected. Caution should also be exercised in other patients for whom a drop in blood pressure could pose a risk, such as patients with known cardiovascular disease. Monitor for signs and symptoms after initiating therapy. Patients should be advised to report symptoms of reduced intravascular volume.
In placebo-controlled clinical studies of canagliflozin, increases in adverse reactions related to reduced intravascular volume were seen more commonly with the 300 mg dose and occurred most frequently in the first three months (see 8 ADVERSE REACTIONS).
Sandoz Canagliflozin is not recommended for use in patients receiving loop diuretics (see 4.1 Dosing Considerations and 8 ADVERSE REACTIONS) or who are volume depleted.
In case of intercurrent conditions that may lead to volume depletion (such as a gastrointestinal illness), careful monitoring of volume status (e.g., physical examination, blood pressure measurements, laboratory tests including renal function tests), and serum electrolytes is recommended. In the case of volume depletion, temporary interruption of treatment with canagliflozin may be considered until the condition is corrected, and more frequent glucose monitoring may be considered.
Driving and Operating Machinery
The effect of canagliflozin on the ability to drive and use machines has not been examined. However, patients should be alerted to the elevated risk of adverse reactions related to reduced intravascular volume, such as postural dizziness, and to the risk of hypoglycemia when Sandoz Canagliflozin is used as add-on therapy with insulin or an insulin secretagogue (see 4.1 Dosing Considerations, 7 WARNINGS AND PRECAUTIONS, Endocrine and Metabolism, and 8 ADVERSE REACTIONS).
Endocrine and Metabolism
Diabetic ketoacidosis
Clinical trial and post-market cases of DKA, a serious life-threatening condition requiring urgent hospitalization, have been reported in patients with type 2 diabetes mellitus treated with SGLT2 inhibitors, including canagliflozin. Fatal cases of DKA have been reported in patients taking canagliflozin. In a number of reported cases, the presentation of the condition was atypical with blood glucose values below 13.9 mmol/L (250 mg/dL) (see 8 ADVERSE REACTIONS, Description of Selected Adverse Reactions).
Sandoz Canagliflozin is not indicated, and should not be used, in patients with type 1 diabetes. The diagnosis of T2DM should therefore be confirmed before initiating Sandoz Canagliflozin.
Sandoz Canagliflozin should not be used for the treatment of DKA or in patients with a history of DKA.
Patients with type 2 diabetes treated with Sandoz Canagliflozin who present with signs and symptoms consistent with severe metabolic acidosis should be assessed for ketoacidosis regardless of presenting blood glucose levels, as ketoacidosis associated with Sandoz Canagliflozin may be present even if blood glucose levels are less than 13.9 mmol/L (250 mg/dL).
The risk of DKA must be considered in the event of non-specific symptoms such as difficulty breathing, nausea, vomiting, abdominal pain, confusion, anorexia, excessive thirst, unusual fatigue or sleepiness.
If these symptoms occur, regardless of blood glucose level, Sandoz Canagliflozin treatment should be immediately discontinued, patients should be assessed for diabetic ketoacidosis immediately, and prompt treatment should be instituted.
SGLT2 inhibitors have been shown to increase blood ketones in clinical trial subjects. Conditions that can precipitate DKA while taking Sandoz Canagliflozin include patients on a very low carbohydrate diet (as the combination may further increase ketone body production), patients with conditions that lead to restricted food intake or severe dehydration, patients with increased insulin requirement due to an acute medical illness, surgery, or alcohol abuse, patients with a low beta-cell function reserve [e.g., type 2 diabetes patients with low C-peptide or latent autoimmune diabetes in adults (LADA)], pancreatic disorders suggesting insulin deficiency (e.g., type 1 diabetes, history of pancreatitis, or pancreatic surgery), insulin dose reduction (including insulin pump failure), and patients with a history of ketoacidosis. Patients with nephropathy may be more susceptible to DKA during treatment with SGLT2 inhibitors. Patients with these risk factors should be monitored closely. Caution should also be taken when reducing the insulin dose in patients requiring insulin (see 4 DOSAGE AND ADMINISTRATION).
Prolonged diabetic ketoacidosis
DKA may be prolonged in some patients. In most post-marketing adverse event reports, ketoacidosis lasted for 3 days or more despite Sandoz Canagliflozin discontinuation and standard treatment of diabetic ketoacidosis. Based on canagliflozin half-life, glucosuria may persist longer than expected and DKA may be prolonged in some patients. The mechanism of prolonged DKA and glucosuria is unknown. Other factors independent of canagliflozin may be involved in prolonging periods of DKA. In post-marketing adverse event reports, most cases reported prolongation that lasted from 3 to 10 days after discontinuation of Sandoz Canagliflozin, however, a few cases reported longer prolongation (see 8.5 Post-Market Adverse Reactions).
Post-operative onset of diabetic ketoacidosis
Temporarily discontinue treatment with Sandoz Canagliflozin in T2DM patients who are hospitalized for major surgical procedures, or will undergo scheduled surgery. Sandoz Canagliflozin treatment should be interrupted for a minimum of 3 days, when possible, prior to major surgery or any other procedures associated with prolonged fasting, when, based on the drug half-life, most of canagliflozin would be expected to be eliminated. Monitoring for DKA is recommended in the post-operative period (see 4.1 Dosing Considerations and 7 WARNINGS AND PRECAUTIONS, Peri-Operative Considerations).
Temporarily discontinue treatment with Sandoz Canagliflozin, if possible, in clinical situations which could predispose to ketoacidosis, such as in patients who are hospitalized for serious infections or acute serious medical illnesses.
Monitoring for early signs and symptoms of DKA is recommended even if Sandoz Canagliflozin treatment has been interrupted or discontinued. Ensure risk factors for ketoacidosis are resolved prior to considering Sandoz Canagliflozin treatment re-initiation.
Educate patients on the signs and symptoms of ketoacidosis and instruct patients to discontinue Sandoz Canagliflozin and seek medical attention immediately if signs and symptoms occur.
Hypoglycemia in Add-on Therapy with other Antihyperglycemic Agents
When canagliflozin was used as add-on therapy with insulin or an insulin secretagogue (e.g., sulfonylurea), the incidence of hypoglycemia was increased over that of placebo. Therefore, to lower the risk of hypoglycemia, a dose reduction of insulin or an insulin secretagogue may be considered (see 8 ADVERSE REACTIONS and 4.1 Dosing Considerations).
Increases in Low-Density Lipoprotein (LDL-C)
Dose-related increases in LDL-C are seen with canagliflozin treatment (see 8.4 Abnormal Laboratory Findings: Hematologic, Clinical Chemistry and Other Quantitative Data). LDL-C levels should be monitored.
Genitourinary
Genital Mycotic Infections
Sandoz Canagliflozin increases the risk of genital mycotic infections, consistent with the mechanism of increased urinary glucose excretion. Patients with a history of genital mycotic infections and uncircumcised males were more likely to develop genital mycotic infections (see 8 ADVERSE REACTIONS).
Urinary tract infections (including urosepsis and pyelonephritis)
Treatment with Sandoz Canagliflozin increases the risk for urinary tract infections (see 8 ADVERSE REACTIONS). There have been post-marketing reports of serious urinary tract infections, including urosepsis and pyelonephritis, requiring hospitalization in patients treated with canagliflozin.
Fournier’s gangrene (necrotizing fasciitis of the perineum)
Post-marketing cases of necrotizing fasciitis of the perineum (Fournier’s gangrene), a rare but serious and potentially life-threatening necrotizing infection requiring urgent surgical intervention, have been reported in female and male patients with diabetes mellitus receiving SGLT2 inhibitors, including canagliflozin. Serious outcomes have included hospitalization, multiple surgeries and death.
Patients treated with Sandoz Canagliflozin who present with pain or tenderness, erythema, or swelling in the genital or perineal area, with or without fever, or malaise should be evaluated for necrotizing fasciitis. If suspected, Sandoz Canagliflozin should be discontinued and prompt treatment should be instituted (including broad-spectrum antibiotics and surgical debridement if necessary).
Hematologic
Elevated Hemoglobin and Hematocrit
Mean hemoglobin and hematocrit increased in patients administered canagliflozin, as did the frequency of patients with abnormally elevated values for hemoglobin/hematocrit (see 8.4 Abnormal Laboratory Findings: Hematologic, Clinical Chemistry and Other Quantitative Data). Sandoz Canagliflozin should be used with caution in patients with an elevated hematocrit.
Immune
Serious hypersensitivity reactions, including angioedema and anaphylaxis, have been reported post-market in patients treated with canagliflozin. If a hypersensitivity reaction is suspected, discontinue Sandoz Canagliflozin, assess for other potential causes and initiate alternative treatment for diabetes (see 8.5 Post-Market Adverse Reactions).
Monitoring and Laboratory Tests
Blood Glucose and HbA1c
Response to Sandoz Canagliflozin treatment should be monitored by periodic measurements of blood glucose and HbA1c levels. Due to its mechanism of action, patients taking Sandoz Canagliflozin will test positive for glucose in their urine.
Renal function
Renal function should be assessed prior to initiation of Sandoz Canagliflozin and regularly thereafter, with more frequent renal function monitoring in patients whose eGFR is <60 mL/min/1.73 m2. Monitoring of renal function is recommended prior to and following initiation of any concomitant drug which might have an impact on renal function.
Reduced intravascular volume
Sandoz Canagliflozin is not recommended for use in patients who are volume depleted. Before initiating Sandoz Canagliflozin, assess volume status, particularly in patients at risk (e.g., moderate renal impairment, the elderly, in patients with low systolic blood pressure, or if on a loop diuretic, angiotensin-converting enzyme inhibitor, or angiotensin receptor blocker).
In patients with volume depletion, the condition should be corrected prior to initiation of Sandoz Canagliflozin (see 4.1 Dosing Considerations).
For patients with risk factors for volume depletion or in case of intercurrent conditions that may lead to volume depletion (such as a gastrointestinal illness), careful monitoring of volume status (e.g., physical examination, blood pressure measurements, laboratory tests including renal function tests), and serum electrolytes is recommended during treatment with Sandoz Canagliflozin. Temporary interruption of treatment with Sandoz Canagliflozin should be considered until volume depletion is corrected.
LDL-cholesterol
LDL-C levels should be measured at baseline and at regular intervals during treatment with Sandoz Canagliflozin due to dose-dependent increases in LDL-C seen with therapy.
Digoxin levels
In patients taking digoxin and canagliflozin 300 mg once daily for seven days, there was an increase in the total exposure (AUC) and peak drug concentration (Cmax) of digoxin (20% and 36%, respectively), therefore patients taking Sandoz Canagliflozin concomitantly with digoxin should be monitored appropriately.
Musculoskeletal
An increased risk of bone fractures, occurring as early as 12 weeks after treatment initiation, was observed in patients using canagliflozin. Consider factors that contribute to fracture risk prior to initiating Sandoz Canagliflozin.
Peri-Operative Considerations
Temporarily discontinue treatment with Sandoz Canagliflozin in T2DM patients who are hospitalized for major surgical procedures, or will undergo scheduled surgery. Ensure risk factors for ketoacidosis are resolved and that the patient is clinically stable and has resumed oral intake before considering Sandoz Canagliflozin treatment re-initiation. Monitoring for DKA is recommended in these patients (see 4.1 Dosing Considerations and 7 WARNINGS AND PRECAUTIONS, Endocrine and Metabolism).
Renal
Sandoz Canagliflozin increases serum creatinine and decreases eGFR in a dose dependent fashion. In clinical trials, renal function abnormalities have occurred after initiating canagliflozin. Post-marketing cases of acute kidney injury, including acute renal failure and a decline in eGFR, some requiring hospitalization and dialysis, have been reported in patients receiving SGLT2 inhibitors, including canagliflozin. Before initiating Sandoz Canagliflozin, consider factors that may predispose patients to acute kidney injury including hypovolemia, chronic renal insufficiency, congestive heart failure and concomitant medications (diuretics, ACE inhibitors, ARBs, NSAIDs). Consider temporarily discontinuing Sandoz Canagliflozin in any setting of reduced oral intake (such as acute illness or fasting) or fluid losses (such as gastrointestinal illness or excessive heat exposure); monitor patients for signs and symptoms of acute kidney injury. If acute kidney injury occurs, discontinue Sandoz Canagliflozin promptly and institute treatment (see 7 WARNINGS AND PRECAUTIONS, Cardiovascular and 8 ADVERSE REACTIONS).
Renal function should be assessed prior to initiation of Sandoz Canagliflozin and regularly thereafter. In patients with eGFR less than 60 mL/min/1.73m2, more intensive monitoring for glycemic and renal biomarkers and signs and symptoms of renal dysfunction is recommended especially if the eGFR is less than 45 mL/min/1.73m2.
The glucose-lowering benefit of canagliflozin decreases with declining renal function and has not been demonstrated for patients with eGFR <30 mL/min/1.73 m2.
In patients with type 2 diabetes already initiated on treatment for diabetic nephropathy, the use of Sandoz Canagliflozin 100 mg can be continued in patients with an eGFR <30 mL/min/1.73 m2. Sandoz Canagliflozin 100 mg should be discontinued if dialysis is initiated (see 2 CONTRAINDICATIONS and 4.2 Recommended Dose and Dosage Adjustment).
Reproductive Health: Female and Male Potential
See 7.1.1 Pregnant Women.
Fertility
No human fertility studies have been conducted. Based on animal studies, no adverse effects on fertility were seen at an exposure up to 19 times the clinical 300 mg dose (see 16 NON-CLINICAL TOXICOLOGY, Reproductive and Developmental Toxicology).
Teratogenic Risk
Sandoz Canagliflozin should not be used during pregnancy (see 7.1.1 Pregnant Women). There are no adequate and well-controlled studies of canagliflozin in pregnant women, and therefore, the safety of canagliflozin in human fetal development has not been established. Based on animal studies, canagliflozin may affect renal development and maturation. In animal studies, adverse renal effects were observed in juvenile rats when canagliflozin was administered during a period of renal development corresponding to the late second and third trimesters of human pregnancy (see 16 NON-CLINICAL TOXICOLOGY, Juvenile Toxicity).
7.1 Special Populations
7.1.1 Pregnant Women
Sandoz Canagliflozin should not be used during pregnancy. There are no adequate and well-controlled studies in pregnant women. Based on results from rat studies, canagliflozin may affect renal development and maturation. In a juvenile rat study, increased kidney weights and renal pelvic and tubular dilatation that did not fully reverse within the 1-month recovery period, were evident at greater than or equal to 0.5 times clinical exposure from a 300 mg dose (see 16 NON-CLINICAL TOXICOLOGY, Juvenile Toxicity).
7.1.2 Breast-feeding
Sandoz Canagliflozin should not be used during nursing because of the potential for serious adverse reactions in nursing infants. It is not known if canagliflozin is excreted in human milk. Available pharmacodynamic/toxicological data in animals have shown excretion of canagliflozin in the milk of lactating rats reaching levels which are approximately 1.4 times higher than plasma systemic exposure. Data in juvenile rats directly exposed to canagliflozin showed risk to the developing kidney (renal pelvic and tubular dilatations) during maturation.
7.1.3 Pediatrics
Safety and effectiveness of canagliflozin in pediatric patients under 18 years of age have not been established; therefore, Health Canada has not authorized an indication for pediatric use.
7.1.4 Geriatrics
Two thousand thirty-four (2,034) patients 65 years and older, and 345 patients 75 years and older were exposed to canagliflozin in nine clinical studies of canagliflozin (see 14 CLINICAL TRIALS).
Patients 65 years and older had a higher incidence of adverse reactions related to reduced intravascular volume with canagliflozin (such as hypotension, postural dizziness, orthostatic hypotension, syncope, and dehydration), particularly with the 300 mg daily dose, compared to younger patients; more prominent increase in the incidence was seen in patients who were 75 years and older (see 4 DOSAGE AND ADMINISTRATION and 8 ADVERSE REACTIONS, Description of Selected Adverse Reactions). Smaller reductions in HbA1c with canagliflozin relative to placebo were seen in older patients (65 years and older; -0.61% with canagliflozin 100 mg and -0.74% with canagliflozin 300 mg relative to placebo) compared to younger patients (-0.72% with canagliflozin 100 mg and -0.87% with canagliflozin 300 mg relative to placebo).
7.1.5 Hepatic Impairment
Canagliflozin has not been studied in patients with severe hepatic impairment and is therefore not recommended for use in this patient population. No dose adjustment is necessary in patients with mild or moderate hepatic impairment.
8 ADVERSE REACTIONS
8.1 Adverse Reaction Overview
The safety of canagliflozin was evaluated in fifteen double-blind, controlled Phase 3 and Phase 4 clinical studies involving 22,645 patients with type 2 diabetes, including 13,278 patients treated with canagliflozin 100 mg and 7,170 patients, treated with canagliflozin 300 mg. Of the 22,645 patients with type 2 diabetes, a total of 10,134 patients were treated in two dedicated cardiovascular outcomes studies for a mean exposure duration of 149 weeks (223 weeks in CANVAS and 94 weeks in CANVAS-R), and 8,114 patients were treated in 12 double-blind, controlled Phase 3 and Phase 4 clinical studies, for a mean exposure duration of 49 weeks. In a dedicated renal outcomes study, a total of 4,397 patients with type 2 diabetes and diabetic nephropathy had a mean duration of drug exposure of 115 weeks.
The primary assessment of safety and tolerability was conducted in a pooled analysis (N=2313) of four 26-week placebo-controlled clinical studies (monotherapy and add-on therapy with metformin, metformin and sulfonylurea, and metformin and pioglitazone). The most commonly reported adverse reactions during treatment (≥ 5%) were vulvovaginal candidiasis, urinary tract infection (UTI), and polyuria or pollakiuria. Adverse reactions leading to discontinuation of ≥ 0.5% of all canagliflozin-treated patients in these studies were vulvovaginal candidiasis (0.7% of females) and balanitis or balanoposthitis (0.5% of males).
A total of 8 serious adverse drug reactions were reported in the primary placebo-controlled safety population, including 5 reports from patients taking canagliflozin 100 mg daily (2 urticaria, 2 UTI, and 1 nausea), 2 reports from patients taking canagliflozin 300 mg daily (1 UTI, 1 constipation) and 1 report from a patient in the placebo group (reduced intravascular volume). Of these serious adverse reactions, 2 led to discontinuation in the canagliflozin group (UTI and urticaria).
8.2 Clinical Trial Adverse Reactions
Because clinical trials are conducted under very specific conditions the adverse reaction rates observed in the clinical trials may not reflect the rates observed in practice and should not be compared to the rates in the clinical trials of another drug. Adverse drug reaction information from clinical trials is useful for identifying and approximating rates of adverse drug reactions in real-world use.
Table 3 to Table 9 include treatment-emergent adverse events (TEAEs) reported in ≥ 2% of canagliflozin-treated patients.
Monotherapy (Study DIA3005)
| Table 3: Adverse events (regardless of causality) reported in ≥ 2% of patients treated with canagliflozin and more frequently than in the placebo group in a 26-week double-blind clinical trial (Study DIA3005) of canagliflozin compared with placebo | |||||||
|---|---|---|---|---|---|---|---|
| Table 3: Adverse events (regardless of causality) reported in ≥ 2% of patients treated with canagliflozin and more frequently than in the placebo group in a 26-week double-blind clinical trial (Study DIA3005) of canagliflozin compared with placebo | |||||||
System Organ Class / Preferred Term | Placebo n=192 n (%) | Canagliflozin 100 mg n=195 n (%) | Canagliflozin 300 mg n=197 n (%) | ||||
System Organ Class / Preferred Term | Placebo n=192 n (%) | Canagliflozin 100 mg n=195 n (%) | Canagliflozin 300 mg n=197 n (%) | ||||
| Gastrointestinal Disorders | |||||||
| Constipation | 2 (1.0) | 4 (2.1) | 6 (3.0) | ||||
| Nausea | 3 (1.6) | 5 (2.6) | 4 (2.0) | ||||
| General Disorders and Administration Site Conditions | |||||||
| Thirst | 1 (0.5) | 3 (1.5) | 6 (3.0) | ||||
| Infections and Infestations | |||||||
| Bronchitis | 2 (1.0) | 6 (3.1) | 2 (1.0) | ||||
| Gastroenteritis | 3 (1.6) | 2 (1.0) | 4 (2.0) | ||||
| Influenza | 6 (3.1) | 9 (4.6) | 8 (4.1) | ||||
| Nasopharyngitis | 10 (5.2) | 10 (5.1) | 16 (8.1) | ||||
| Pharyngitis | 1 (0.5) | 6 (3.1) | 4 (2.0) | ||||
| Urinary Tract Infection | 8 (4.2) | 14 (7.2) | 9 (4.6) | ||||
| Vulvovaginal Mycotic Infection | 2 (1.0) | 4 (2.1) | 2 (1.0) | ||||
| Investigations | |||||||
| Blood Creatine Phosphokinase Increased | 1 (0.5) | 0 | 4 (2.0) | ||||
| Musculoskeletal and Connective Tissue Disorders | |||||||
| Back Pain | 6 (3.1) | 5 (2.6) | 12 (6.1) | ||||
| Musculoskeletal Pain | 3 (1.6) | 4 (2.1) | 1 (0.5) | ||||
| Nervous System Disorders | |||||||
| Headache | 7 (3.6) | 14 (7.2) | 12 (6.1) | ||||
| Renal and Urinary Disorders | |||||||
| Pollakiuria | 1 (0.5) | 5 (2.6) | 6 (3.0) | ||||
| Polyuria | 0 | 0 | 6 (3.0) | ||||
| Reproductive System and Breast Disorders | |||||||
| Vulvovaginal Pruritus | 0 | 1 (0.5) | 4 (2.0) | ||||
| Respiratory, Thoracic and Mediastinal Disorders | |||||||
| Cough | 2 (1.0) | 3 (1.5) | 4 (2.0) | ||||
Combination with Metformin (Studies DIA3006 and DIA3009)
| Table 4: Adverse events (regardless of causality) reported in ≥ 2% of patients treated with canagliflozin and more frequently than in the placebo groups* in double-blind clinical trials of canagliflozin in add-on combination use with metformin, and compared to sitagliptin or placebo (Study DIA3006, 26 weeks) or to glimepiride (Study DIA3009, 52 weeks) | |||||||||||||||||||
|---|---|---|---|---|---|---|---|---|---|---|---|---|---|---|---|---|---|---|---|
| Table 4: Adverse events (regardless of causality) reported in ≥ 2% of patients treated with canagliflozin and more frequently than in the placebo groups* in double-blind clinical trials of canagliflozin in add-on combination use with metformin, and compared to sitagliptin or placebo (Study DIA3006, 26 weeks) or to glimepiride (Study DIA3009, 52 weeks) | |||||||||||||||||||
System Organ Class / Preferred Term | Study DIA3006 (26 weeks) | Study DIA3009 (52 weeks) | |||||||||||||||||
System Organ Class / Preferred Term | Study DIA3006 (26 weeks) | Study DIA3009 (52 weeks) | |||||||||||||||||
Placebo + Metformin n=183 n (%) | Canagliflozin 100 mg + Metformin n=368 n (%) | Canagliflozin 300 mg + Metformin N=367 n (%) | Sitagliptin 100 mg + Metformin n=366 n (%) | Canagliflozin 100 mg + Metformin n=483 n (%) | Canagliflozin 300 mg + Metformin n=485 n (%) | Glimepiride + Metformin n=482 n (%) | |||||||||||||
Placebo + Metformin n=183 n (%) | Canagliflozin 100 mg + Metformin n=368 n (%) | Canagliflozin 300 mg + Metformin N=367 n (%) | Sitagliptin 100 mg + Metformin n=366 n (%) | Canagliflozin 100 mg + Metformin n=483 n (%) | Canagliflozin 300 mg + Metformin n=485 n (%) | Glimepiride + Metformin n=482 n (%) | |||||||||||||
| Gastrointestinal Disorders | |||||||||||||||||||
| Diarrhea | 12 (6.6) | 12 (3.3) | 18 (4.9) | 16 (4.4) | 24 (5.0) | 33 (6.8) | 29 (6.0) | ||||||||||||
| Gastritis | 3 (1.6) | 3 (0.8) | 8 (2.2) | 3 (0.8) | 2 (0.4) | 5 (1.0) | 7 (1.5) | ||||||||||||
| Nausea | 3 (1.6) | 11 (3.0) | 8 (2.2) | 5 (1.4) | 16 (3.3) | 25 (5.2) | 13 (2.7) | ||||||||||||
| Toothache | 2 (1.1) | 3 (0.8) | 8 (2.2) | 4 (1.1) | 8 (1.7) | 7 (1.4) | 6 (1.2) | ||||||||||||
| Vomiting | 1 (0.5) | 8 (2.2) | 1 (0.3) | 3 (0.8) | 9 (1.9) | 7 (1.4) | 8 (1.7) | ||||||||||||
| General Disorders and Administration Site Conditions | |||||||||||||||||||
| Fatigue | 2 (1.1) | 10 (2.7) | 8 (2.2) | 1 (0.3) | 9 (1.9) | 7 (1.4) | 10 (2.1) | ||||||||||||
| Pyrexia | 3 (1.6) | 4 (1.1) | 5 (1.4) | 3 (0.8) | 11 (2.3) | 9 (1.9) | 7 (1.5) | ||||||||||||
| Thirst | 0 | 2 (0.5) | 4 (1.1) | 0 | 8 (1.7) | 14 (2.9) | 0 | ||||||||||||
| Infections and Infestations | |||||||||||||||||||
| Bronchitis | 2 (1.1) | 2 (0.5) | 5 (1.4) | 9 (2.5) | 11 (2.3) | 9 (1.9) | 10 (2.1) | ||||||||||||
| Gastroenteritis | 2 (1.1) | 3 (0.8) | 3 (0.8) | 2 (0.5) | 3 (0.6) | 15 (3.1) | 9 (1.9) | ||||||||||||
| Influenza | 5 (2.7) | 6 (1.6) | 4 (1.1) | 8 (2.2) | 17 (3.5) | 17 (3.5) | 8 (1.7) | ||||||||||||
| Sinusitis | 3 (1.6) | 8 (2.2) | 2 (0.5) | 6 (1.6) | 7 (1.4) | 13 (2.7) | 6 (1.2) | ||||||||||||
| Urinary Tract Infection | 4 (2.2) | 19 (5.2) | 13 (3.5) | 12 (3.3) | 27 (5.6) | 24 (4.9) | 18 (3.7) | ||||||||||||
| Vaginal Infection | 0 | 2 (0.5) | 3 (0.8) | 1 (0.3) | 11 (2.3) | 7 (1.4) | 1 (0.2) | ||||||||||||
| Vulvovaginal Mycotic Infection | 0 | 10 (2.7) | 7 (1.9) | 1 (0.3) | 6 (1.2) | 14 (2.9) | 4 (0.8) | ||||||||||||
| Musculoskeletal and Connective Tissue Disorders | |||||||||||||||||||
| Back Pain | 6 (3.3) | 8 (2.2) | 12 (3.3) | 4 (1.1) | 29 (6.0) | 18 (3.7) | 20 (4.1) | ||||||||||||
| Musculoskeletal Pain | 1 (0.5) | 3 (0.8) | 6 (1.6) | 5 (1.4) | 9 (1.9) | 10 (2.1) | 9 (1.9) | ||||||||||||
| Psychiatric Disorders | |||||||||||||||||||
| Insomnia | 0 | 3 (0.8) | 0 | 1 (0.3) | 7 (1.4) | 10 (2.1) | 6 (1.2) | ||||||||||||
| Renal and Urinary Disorders | |||||||||||||||||||
| Pollakiuria | 1 (0.5) | 21 (5.7) | 10 (2.7) | 2 (0.5) | 12 (2.5) | 12 (2.5) | 1 (0.2) | ||||||||||||
| Reproductive System and Breast Disorders | |||||||||||||||||||
| Balanoposthitis | 1 (0.5) | 2 (0.5) | 1 (0.3) | 0 | 4 (0.8) | 13 (2.7) | 2 (0.4) | ||||||||||||
| Vulvovaginal Pruritus | 0 | 4 (1.1) | 5 (1.4) | 1 (0.3) | 6 (1.2) | 20 (4.1) | 1 (0.2) | ||||||||||||
* In either study
Combination with a Sulfonylurea (Study DIA3008 SU Substudy)
| Table 5: Adverse events (regardless of causality) reported in ≥2% of patients treated with canagliflozin and more frequently than in the placebo group in a double-blind clinical trial of canagliflozin in add-on combination use with a sulfonylurea, and compared to placebo for 18 weeks (Study DIA3008 - sulfonylurea substudy) | |||||||||
|---|---|---|---|---|---|---|---|---|---|
| Table 5: Adverse events (regardless of causality) reported in ≥2% of patients treated with canagliflozin and more frequently than in the placebo group in a double-blind clinical trial of canagliflozin in add-on combination use with a sulfonylurea, and compared to placebo for 18 weeks (Study DIA3008 - sulfonylurea substudy) | |||||||||
System Organ Class / Preferred Term | Placebo + Sulfonylurea n=69 n (%) | Canagliflozin 100 mg + Sulfonylurea n=74 n (%) | Canagliflozin 300 mg + Sulfonylurea n=72 n (%) | ||||||
System Organ Class / Preferred Term | Placebo + Sulfonylurea n=69 n (%) | Canagliflozin 100 mg + Sulfonylurea n=74 n (%) | Canagliflozin 300 mg + Sulfonylurea n=72 n (%) | ||||||
| Gastrointestinal Disorders | |||||||||
| Diarrhea | 1 (1.4) | 0 | 2 (2.8) | ||||||
| General Disorders and Administration Site Conditions | |||||||||
| Chest Pain | 0 | 2 (2.7) | 1 (1.4) | ||||||
| Thirst | 0 | 1 (1.4) | 2 (2.8) | ||||||
| Infections and Infestations | |||||||||
| Herpes Zoster | 0 | 0 | 2 (2.8) | ||||||
| Vulvovaginal Candidiasis | 0 | 2 (2.7) | 0 | ||||||
| Investigations | |||||||||
| Blood Creatinine Increased | 1 (1.4) | 2 (2.7) | 1 (1.4) | ||||||
| Nervous System Disorders | |||||||||
| Dizziness | 0 | 2 (2.7) | 0 | ||||||
| Headache | 1 (1.4) | 2 (2.7) | 1 (1.4) | ||||||
| Renal and Urinary Disorders | |||||||||
| Pollakiuria | 1 (1.4) | 1 (1.4) | 3 (4.2) | ||||||
| Renal Impairment | 0 | 1 (1.4) | 2 (2.8) | ||||||
| Vascular Disorders | |||||||||
| Peripheral Arterial Occlusive Disease | 0 | 0 | 2 (2.8) | ||||||
Combination with a Metformin and a Sulfonylurea (Studies DIA3002 and DIA3015)
| Table 6: Adverse events (regardless of causality) reported in ≥ 2% of patients treated with canagliflozin and more frequently than in the placebo groups* in double-blind clinical trials of canagliflozin in add-on combination use with metformin and a sulfonylurea, and compared to placebo (Study DIA3002, 26 weeks) or sitagliptin (Study DIA3015, 52 weeks) | |||||||||||||||||
|---|---|---|---|---|---|---|---|---|---|---|---|---|---|---|---|---|---|
| Table 6: Adverse events (regardless of causality) reported in ≥ 2% of patients treated with canagliflozin and more frequently than in the placebo groups* in double-blind clinical trials of canagliflozin in add-on combination use with metformin and a sulfonylurea, and compared to placebo (Study DIA3002, 26 weeks) or sitagliptin (Study DIA3015, 52 weeks) | |||||||||||||||||
System Organ Class / Preferred Term | Study DIA3002 (26 weeks) | Study DIA3015 (52 weeks) | |||||||||||||||
System Organ Class / Preferred Term | Study DIA3002 (26 weeks) | Study DIA3015 (52 weeks) | |||||||||||||||
Placebo+ Metformin + Sulfonylurea n=156 n (%) | Canagliflozin 100 mg + Metformin + Sulfonylurea n=157 n (%) | Canagliflozin 300 mg + Metformin + Sulfonylurea N=156 n (%) | Canagliflozin 300 mg + Metformin + Sulfonylurea n=377 n (%) | Sitagliptin 100 mg+ Metformin + Sulfonylurea n=378 n (%) | |||||||||||||
Placebo+ Metformin + Sulfonylurea n=156 n (%) | Canagliflozin 100 mg + Metformin + Sulfonylurea n=157 n (%) | Canagliflozin 300 mg + Metformin + Sulfonylurea N=156 n (%) | Canagliflozin 300 mg + Metformin + Sulfonylurea n=377 n (%) | Sitagliptin 100 mg+ Metformin + Sulfonylurea n=378 n (%) | |||||||||||||
| Ear and Labyrinth Disorders | |||||||||||||||||
| Vertigo | 1 (0.6) | 1 (0.6) | 1 (0.6) | 14 (3.7) | 11 (2.9) | ||||||||||||
| Gastrointestinal Disorders | |||||||||||||||||
| Abdominal Pain | 1 (0.6) | 2 (1.3) | 1 (0.6) | 8 (2.1) | 6 (1.6) | ||||||||||||
| Abdominal Pain Upper | 2 (1.3) | 1 (0.6) | 1 (0.6) | 10 (2.7) | 2 (0.5) | ||||||||||||
| Constipation | 0 | 4 (2.5) | 5 (3.2) | 9 (2.4) | 3 (0.8) | ||||||||||||
| Diarrhea | 5 (3.2) | 5 (3.2) | 10 (6.4) | 17 (4.5) | 26 (6.9) | ||||||||||||
| Nausea | 1 (0.6) | 2 (1.3) | 4 (2.6) | 9 (2.4) | 11 (2.9) | ||||||||||||
| Infections and Infestations | |||||||||||||||||
| Bronchitis | 3 (1.9) | 4 (2.5) | 3 (1.9) | 1 (0.3) | 11 (2.9) | ||||||||||||
| Influenza | 7 (4.5) | 2 (1.3) | 3 (1.9) | 22 (5.8) | 15 (4.0) | ||||||||||||
| Nasopharyngitis | 4 (2.6) | 6 (3.8) | 8 (5.1) | 33 (8.8) | 38 (10.1) | ||||||||||||
| Sinusitis | 3 (1.9) | 4 (2.5) | 2 (1.3) | 8 (2.1) | 8 (2.1) | ||||||||||||
| Tooth Abscess | 0 | 4 (2.5) | 1 (0.6) | 0 | 2 (0.5) | ||||||||||||
| Upper Respiratory Tract Infection | 10 (6.4) | 17 (10.8) | 6 (3.8) | 33 (8.8) | 21 (5.6) | ||||||||||||
| Urinary Tract Infection | 8 (5.1) | 9 (5.7) | 8 (5.1) | 15 (4.0) | 19 (5.0) | ||||||||||||
| Vulvovaginal Mycotic Infection | 2 (1.3) | 8 (5.1) | 8 (5.1) | 12 (3.2) | 5 (1.3) | ||||||||||||
| Metabolism and Nutrition Disorders | |||||||||||||||||
| Decreased Appetite | 1 (0.6) | 0 | 4 (2.6) | 4 (1.1) | 5 (1.3) | ||||||||||||
| Hypoglycemia | 6 (3.8) | 11 (7.0) | 9 (5.8) | 66 (17.5) | 75 (19.8) | ||||||||||||
| Musculoskeletal and Connective Tissue Disorders | |||||||||||||||||
| Arthralgia | 4 (2.6) | 7 (4.5) | 7 (4.5) | 17 (4.5) | 8 (2.1) | ||||||||||||
| Back Pain | 4 (2.6) | 2 (1.3) | 5 (3.2) | 8 (2.1) | 15 (4.0) | ||||||||||||
| Musculoskeletal Pain | 1 (0.6) | 0 | 3 (1.9) | 8 (2.1) | 6 (1.6) | ||||||||||||
| Nervous System Disorders | |||||||||||||||||
| Headache | 4 (2.6) | 5 (3.2) | 2 (1.3) | 29 (7.7) | 27 (7.1) | ||||||||||||
| Renal and Urinary Disorders | |||||||||||||||||
| Pollakiuria | 1 (0.6) | 4 (2.5) | 3 (1.9) | 6 (1.6) | 5 (1.3) | ||||||||||||
| Reproductive System and Breast Disorders | |||||||||||||||||
| Vulvovaginal Pruritus | 0 | 1 (0.6) | 3 (1.9) | 15 (4.0) | 1 (0.3) | ||||||||||||
*In either study
Combination with Metformin and Pioglitazone (Study DIA3012)
| Table 7: Adverse events (regardless of causality) reported in ≥2% of patients treated with canagliflozin and more frequently than in the placebo group in a 26-week double-blind clinical trial of canagliflozin in add-on combination use with metformin and pioglitazone, and compared to placebo (Study DIA3012) | ||||||||
|---|---|---|---|---|---|---|---|---|
System Organ Class / Preferred Term | Placebo + Metformin+ Pioglitazone n=115 n (%) | Canagliflozin 100 mg + Metformin + Pioglitazone n=113 n (%) | Canagliflozin 300 mg + Metformin + Pioglitazone n=114 n (%) | |||||
| Gastrointestinal Disorders | ||||||||
| Gastritis | 2 (1.7) | 4 (3.5) | 0 | |||||
| General Disorders and Administration Site Conditions | ||||||||
| Fatigue | 2 (1.7) | 1 (0.9) | 4 (3.5) | |||||
| Edema Peripheral | 2 (1.7) | 2 (1.8) | 4 (3.5) | |||||
| Thirst | 0 | 5 (4.4) | 4 (3.5) | |||||
| Infections and Infestations | ||||||||
| Nasopharyngitis | 6 (5.2) | 6 (5.3) | 11 (9.6) | |||||
| Sinusitis | 2 (1.7) | 1 (0.9) | 3 (2.6) | |||||
| Upper Respiratory Tract Infection | 7 (6.1) | 9 (8.0) | 5 (4.4) | |||||
| Vulvovaginal Candidiasis | 0 | 1 (0.9) | 3 (2.6) | |||||
| Vulvovaginal Mycotic Infection | 0 | 3 (2.7) | 6 (5.3) | |||||
| Investigations | ||||||||
| Weight Decreased | 1 (0.9) | 1 (0.9) | 3 (2.6) | |||||
| Metabolism and Nutrition Disorders | ||||||||
| Hypoglycemia | 2 (1.7) | 1 (0.9) | 6 (5.3) | |||||
| Musculoskeletal and Connective Tissue Disorders | ||||||||
| Arthralgia | 2 (1.7) | 1 (0.9) | 6 (5.3) | |||||
| Back Pain | 3 (2.6) | 8 (7.1) | 5 (4.4) | |||||
| Pain in Extremity | 1 (0.9) | 4 (3.5) | 3 (2.6) | |||||
| Nervous System Disorders | ||||||||
| Dizziness | 1 (0.9) | 4 (3.5) | 3 (2.6) | |||||
| Headache | 4 (3.5) | 3 (2.7) | 5 (4.4) | |||||
| Renal and Urinary Disorders | ||||||||
| Pollakiuria | 1 (0.9) | 5 (4.4) | 7 (6.1) | |||||
| Reproductive System and Breast Disorders | ||||||||
| Balanitis | 0 | 3 (2.7) | 0 | |||||
| Respiratory, Thoracic and Mediastinal Disorders | ||||||||
| Oropharyngeal Pain | 2 (1.7) | 3 (2.7) | 0 | |||||
| Vascular Disorders | ||||||||
| Hypotension | 3 (2.6) | 3 (2.7) | 0 | |||||
Combination with Insulin with or without Metformin (Study DIA3008 Insulin Substudy)
| Table 8: Adverse events (regardless of causality) reported in ≥2% of patients treated with canagliflozin and more frequently than in the placebo group in a 18-week double-blind clinical trial of canagliflozin in add-on combination use with insulin and compared to placebo (Study DIA3008 - Insulin Substudy) | |||
| Table 8: Adverse events (regardless of causality) reported in ≥2% of patients treated with canagliflozin and more frequently than in the placebo group in a 18-week double-blind clinical trial of canagliflozin in add-on combination use with insulin and compared to placebo (Study DIA3008 - Insulin Substudy) | |||
System Organ Class / Preferred Term | Placebo + Insulin n=187 n (%) | Canagliflozin 100 mg + Insulin n=183 n (%) | Canagliflozin 300 mg + Insulin n=184 n (%) |
System Organ Class / Preferred Term | Placebo + Insulin n=187 n (%) | Canagliflozin 100 mg + Insulin n=183 n (%) | Canagliflozin 300 mg + Insulin n=184 n (%) |
| Ear and labyrinth disorders | |||
| Vertigo | 2 (1.1) | 2 (1.1) | 5 (2.7) |
| Gastrointestinal disorders | |||
| Abdominal pain upper | 4 (2.1) | 4 (2.2) | 1 (0.5) |
| Constipation | 3 (1.6) | 4 (2.2) | 2 (1.1) |
| Dry mouth | 1 (0.5) | 4 (2.2) | 1 (0.5) |
| Nausea | 2 (1.1) | 5 (2.7) | 3 (1.6) |
| General disorders and administration site conditions | |||
| Asthenia | 1 (0.5) | 0 | 4 (2.2) |
| Fatigue | 1 (0.5) | 8 (4.4) | 3 (1.6) |
| Infections and infestations | |||
| Bronchitis | 4 (2.1) | 2 (1.1) | 5 (2.7) |
| Influenza | 1 (0.5) | 4 (2.2) | 2 (1.1) |
| Upper respiratory tract infection | 6 (3.2) | 8 (4.4) | 5 (2.7) |
| Urinary tract infection | 3 (1.6) | 3 (1.6) | 4 (2.2) |
| Investigations | |||
| Blood creatinine increased | 3 (1.6) | 7 (3.8) | 3 (1.6) |
| Blood urea increased | 1 (0.5) | 4 (2.2) | 3 (1.6) |
| Metabolism and nutrition disorders | |||
| Hypoglycemia | 12 (6.4) | 15 (8.2) | 20 (10.9) |
| Musculoskeletal and connective tissue disorders | |||
| Back pain | 4 (2.1) | 5 (2.7) | 6 (3.3) |
| Osteoarthritis | 3 (1.6) | 4 (2.2) | 0 |
| Pain in extremity | 1 (0.5) | 0 | 5 (2.7) |
| Nervous system disorders | |||
| Dizziness | 2 (1.1) | 0 | 4 (2.2) |
| Headache | 4 (2.1) | 6 (3.3) | 4 (2.2) |
| Renal and urinary disorders | |||
| Pollakiuria | 0 | 7 (3.8) | 7 (3.8) |
| Reproductive system and breast disorders | |||
| Balanitis | 0 | 3 (1.6) | 4 (2.2) |
| Vulvovaginal pruritus | 0 | 5 (2.7) | 0 |
| Skin and subcutaneous tissue disorders | |||
| Rash | 2 (1.1) | 5 (2.7) | 2 (1.1) |
| Vascular disorders | |||
| Hypotension | 0 | 5 (2.7) | 8 (4.3) |
| Table 9: Adverse events (regardless of causality) reported in ≥2% of patients treated with canagliflozin and more frequently than in the placebo group in a 18-week double-blind clinical trial of canagliflozin in add-on combination use with insulin and metformin, and compared to placebo (Study DIA3008 - Insulin Substudy) | |||
| Table 9: Adverse events (regardless of causality) reported in ≥2% of patients treated with canagliflozin and more frequently than in the placebo group in a 18-week double-blind clinical trial of canagliflozin in add-on combination use with insulin and metformin, and compared to placebo (Study DIA3008 - Insulin Substudy) | |||
System Organ Class / Preferred Term | Placebo + Insulin + Metformin n=244 n (%) | Canagliflozin 100 mg + Insulin + Metformin n=241 n (%) | Canagliflozin 300 mg + Insulin + Metformin n=246 n (%) |
System Organ Class / Preferred Term | Placebo + Insulin + Metformin n=244 n (%) | Canagliflozin 100 mg + Insulin + Metformin n=241 n (%) | Canagliflozin 300 mg + Insulin + Metformin n=246 n (%) |
| Gastrointestinal disorders | |||
| Constipation | 2 (0.8) | 1 (0.4) | 8 (3.3) |
| Diarrhea | 7 (2.9) | 4 (1.7) | 14 (5.7) |
| Dyspepsia | 0 | 2 (0.8) | 5 (2.0) |
| Nausea | 5 (2.0) | 5 (2.1) | 8 (3.3) |
| General disorders and administration site conditions | |||
| Fatigue | 4 (1.6) | 6 (2.5) | 8 (3.3) |
| Thirst | 0 | 2 (0.8) | 10 (4.1) |
| Infections and infestations | |||
| Bronchitis | 5 (2.0) | 7 (2.9) | 3 (1.2) |
| Nasopharyngitis | 22 (9.0) | 22 (9.1) | 13 (5.3) |
| Urinary tract infection | 4 (1.6) | 3 (1.2) | 10 (4.1) |
| Vulvovaginal mycotic infection | 2 (0.8) | 4 (1.7) | 5 (2.0) |
| Metabolism and nutrition disorders | |||
| Hypoglycemia | 21 (8.6) | 23 (9.5) | 23 (9.3) |
| Musculoskeletal and connective tissue disorders | |||
| Arthralgia | 3 (1.2) | 8 (3.3) | 4 (1.6) |
| Back pain | 5 (2.0) | 3 (1.2) | 13 (5.3) |
| Pain in extremity | 4 (1.6) | 7 (2.9) | 6 (2.4) |
| Nervous system disorders | |||
| Dizziness | 0 | 1 (0.4) | 6 (2.4) |
| Headache | 7 (2.9) | 8 (3.3) | 7 (2.8) |
| Renal and urinary disorders | |||
| Pollakiuria | 1 (0.4) | 7 (2.9) | 18 (7.3) |
| Reproductive system and breast disorders | |||
| Balanitis | 1 (0.4) | 7 (2.9) | 9 (3.7) |
| Vascular disorders | |||
| Hypertension | 3 (1.2) | 8 (3.3) | 1 (0.4) |
8.3 Less Common Clinical Trial Adverse Reactions
Below is a list of less common (<2%) 1 clinical trial adverse drug reactions.
Metabolism and nutrition disorders: dehydration2
Nervous system disorders: dizziness postural2, syncope2
Skin and subcutaneous tissue disorders: rash3, urticaria
Vascular disorders: hypotension2, orthostatic hypotension2
Description of Selected Adverse Reactions
Diabetic ketoacidosis: Cases of DKA, a serious life-threatening condition requiring urgent hospitalization, have been reported in patients with type 2 diabetes mellitus treated with SGLT2 inhibitors, including canagliflozin. In the on-treatment analysis of the CANVAS/CANVAS-R
1 Adverse drug reactions (ADRs) were identified based on a comprehensive assessment of biological plausibility, mechanism of action, dose dependence in incidence rate, time of onset, seriousness and consistency of findings across four, 26-week placebo-controlled Phase 3 clinical studies. Additional supportive safety analyses were conducted on a large pooled dataset from eight active- and placebo-controlled Phase 3 clinical studies.
2 Related to reduced intravascular volume (see Adverse reactions related to reduced intravascular volume).
3 Rash includes the terms: rash erythematous, rash generalized, rash macular, rash maculopapular, rash papular, rash pruritic, rash pustular, and rash vesicular
integrated dataset, the adjusted incidence rates of adjudicated diabetic ketoacidosis were 0.08 (0.2%, 14/5,790) and 0.01 (< 0.1%, 1/4,344) per 100 subject-years, for the combined canagliflozin and the placebo groups, respectively. Fatal cases of DKA have been reported in patients treated with canagliflozin. The risk of DKA during canagliflozin treatment was greater in patients with eGFR < 60 mL/min/1.73 m2 than in patients with normal renal function or mild renal impairment. Sandoz Canagliflozin is not indicated and should not be used in patients with type 1 diabetes. In a number of reported cases, the presentation of the condition was atypical with blood glucose values below 13.9 mmol/L (250 mg/dL) (see 7 WARNINGS AND PRECAUTIONS, Endocrine and Metabolism).
In a long-term renal outcomes study in patients with type 2 diabetes and diabetic nephropathy , on-treatment incidence rates of adjudicated events of DKA were 0.22 (0.5%, 11/2,200) and 0.02 (<0.1%, 1/2,197) per 100 patient-years with canagliflozin 100 mg and placebo, respectively; of the 12 patients with DKA, 7 (6 on canagliflozin 100 mg and 1 on placebo) had an eGFR before treatment of 30 to ˂ 45 mL/min/1.73m2. Cases of DKA in the canagliflozin group occurred in the setting of an intercurrent illness requiring hospitalization (8 of 11 subjects), or with low beta cell function reserve (3 of 11 subjects).
Reduced intravascular volume: In the pooled analysis of the four 26-week, placebo-controlled studies, the incidence of all adverse reactions related to reduced intravascular volume (e.g., postural dizziness, orthostatic hypotension, hypotension, dehydration, and syncope) was 1.2% for canagliflozin 100 mg, 1.3% for canagliflozin 300 mg, and 1.1% for placebo. The incidence of these adverse reactions with canagliflozin treatment in the two active-controlled studies was similar to comparators.
In one of the dedicated long-term cardiovascular studies (CANVAS), where patients were generally older with a higher prevalence of comorbidities, the incidence rate of adverse reactions related to reduced intravascular volume were 2.34 with canagliflozin 100 mg, 2.87 with canagliflozin 300 mg, and 1.85 with placebo, events per 100 patient-years of exposure.
In the long-term renal outcomes trial, the incidence of hypotension was 2.8% in the canagliflozin 100 mg group and 1.5% in the placebo group.
To assess risk factors for these adverse reactions, a larger pooled analysis (N=12,441) of patients from 13 controlled Phase 3 and Phase 4 studies including both doses of canagliflozin was conducted. In this pooled analysis, patients on loop diuretics, patients with moderate renal impairment (eGFR 30 to <60 mL/min/1.73 m2), and patients ≥75 years of age had higher incidences of these reactions. For patients on loop diuretics, the incidence rates were 4.98 on canagliflozin 100 mg and 5.67 on canagliflozin 300 mg compared to 4.15 events per 100 patient-years of exposure in the control group. For patients with a baseline eGFR 30 to <60 mL/min/1.73 m2, the incidence rates were 5.24 on canagliflozin 100 mg and 5.35 on canagliflozin 300 mg compared to 3.11 events per 100 patient-years of exposure in the control group. In patients ≥ 75 years of age, the incidence rates were 5.27 on canagliflozin 100 mg and 6.08 on canagliflozin 300 mg compared to 2.41 events per 100 patient-years of exposure in the control group (see 7 WARNINGS AND PRECAUTIONS, Cardiovascular, 4 DOSAGE AND ADMINISTRATION, and 10 CLINICAL PHARMACOLOGY, Special Populations and Conditions).
Hypoglycemia: In individual clinical trials (see 14 CLINICAL TRIALS), episodes of hypoglycemia occurred at a higher rate when canagliflozin was co-administered with insulin or sulfonylurea (see Table 10, 7 WARNINGS AND PRECAUTIONS, Endocrine and Metabolism and 4.1 Dosing Considerations).
| Table 10: Incidence of Hypoglycemia1 in Controlled Clinical Studies | |||
|---|---|---|---|
| Table 10: Incidence of Hypoglycemia1 in Controlled Clinical Studies | |||
Monotherapy (26 weeks) | Placebo (N=192) | Canagliflozin 100 mg (N=195) | Canagliflozin 300 mg (N=197) |
| Overall [N (%)] | 5 (2.6) | 7 (3.6) | 6 (3.0) |
In Combination with Metformin (26 weeks) | Placebo + Metformin (N=183) | Canagliflozin 100 mg + Metformin (N=368) | Canagliflozin 300 mg + Metformin (N=367) |
| Overall [N (%)] | 3 (1.6) | 16 (4.3) | 17 (4.6) |
| Severe [N (%)]2 | 0 (0) | 1 (0.3) | 1 (0.3) |
In Combination with Metformin (52 weeks) | Glimepiride + Metformin (N=482) | Canagliflozin 100 mg + Metformin (N=483) | Canagliflozin 300 mg + Metformin (N=485) |
| Overall [N (%)] | 165 (34.2) | 27 (5.6) | 24 (4.9) |
| Severe [N (%)]2 | 15 (3.1) | 2 (0.4) | 3 (0.6) |
In Combination with Sulfonylurea (18 weeks) | Placebo + Sulfonylurea (N=69) | Canagliflozin 100 mg + Sulfonylurea (N=74) | Canagliflozin 300 mg + Sulfonylurea (N=72) |
| Overall [N (%)] | 4 (5.8) | 3 (4.1) | 9 (12.5) |
In Combination with Metformin + Sulfonylurea (26 weeks) | Placebo + Metformin + Sulfonylurea (N=156) | Canagliflozin 100 mg + Metformin + Sulfonylurea (N=157) | Canagliflozin 300 mg + Metformin + Sulfonylurea (N=156) |
| Overall [N (%)] | 24 (15.4) | 43 (27.4) | 47 (30.1) |
| Severe [N (%)]2 | 1 (0.6) | 1 (0.6) | 0 |
In Combination with Metformin + Sulfonylurea (52 weeks) | Sitagliptin + Metformin + Sulfonylurea (N=378) | Canagliflozin 300 mg + Metformin + Sulfonylurea (N=377) | |
| Overall [N (%)] | 154 (40.7) | 163 (43.2) | |
| Severe [N (%)]2 | 13 (3.4) | 15 (4.0) | |
In Combination with Metformin + Pioglitazone (26 weeks) | Placebo + Metformin + Pioglitazone (N=115) | Canagliflozin 100 mg + Metformin + Pioglitazone (N=113) | Canagliflozin 300 mg + Metformin + Pioglitazone (N=114) |
| Overall [N (%)] | 3 (2.6) | 3 (2.7) | 6 (5.3) |
In Combination with Insulin (18 weeks) | Placebo (N=565) | Canagliflozin 100 mg (N=566) | Canagliflozin 300 mg (N=587) |
| Overall [N (%)] | 208 (36.8) | 279 (49.3) | 285 (48.6) |
| Severe [N (%)]2 | 14 (2.5) | 10 (1.8) | 16 (2.7) |
1 Number of patients experiencing at least one event of hypoglycemia based on either biochemically documented episodes (any glucose value ≤ 3.89 mmol/L) or severe hypoglycemic events in the intent-to-treat population.
2 Severe episodes of hypoglycemia were defined as those where the patient: required the assistance of another person to recover; lost consciousness; or experienced a seizure (regardless of whether biochemical documentation of a low glucose value was obtained).
Fournier’s gangrene (Necrotizing fasciitis of the perineum): Fournier’s gangrene was identified as a SGLT2i class adverse reaction based on spontaneous event reporting. These events had not been previously identified as ADRs because there were very few subjects in the canagliflozin Phase 3 and Phase 4 clinical development program (including the CANVAS and CREDENCE programs) with adverse events of Fournier’s gangrene (incidences were <0.1% in the canagliflozin and comparator groups). All 4 events of Fournier’s gangrene (2 subjects treated with canagliflozin and 2 subjects treated with comparator) in the canagliflozin Phase 3 and Phase 4 clinical development program were serious.
Genital mycotic infections: Vulvovaginal candidiasis (including vulvovaginitis and vulvovaginal mycotic infection) was reported in 10.4% and 11.4% of female patients treated with canagliflozin 100 mg and canagliflozin 300 mg, respectively, compared to 3.2% in placebo-treated female patients. Most reports of vulvovaginal candidiasis occurred during the first four months of treatment with canagliflozin. Among female patients taking canagliflozin, 2.3% experienced more than one infection. Overall, 0.7% of all female patients discontinued canagliflozin due to vulvovaginal candidiasis (see 7 WARNINGS AND PRECAUTIONS, Genitourinary).
Candidal balanitis or balanoposthitis was reported in 4.2% and 3.7% of male patients treated with canagliflozin 100 mg and canagliflozin 300 mg, respectively, compared to 0.6% in placebo-treated male patients. Among male patients taking canagliflozin, 0.9% had more than one infection. Overall, 0.5% of male patients discontinued canagliflozin due to candidal balanitis or balanoposthitis. In uncircumcised males in a pooled analysis of 10 controlled studies, the incidence rate of phimosis was 0.56 events per 100 patient-years of exposure in patients treated with canagliflozin and 0.05 events per 100 patient-years in patients treated with comparator. In this pooled analysis, the incidence rate of circumcision was 0.38 events per 100 patient-years of exposure in male patients treated with canagliflozin compared to 0.10 events per 100 patients-years in male patients treated with comparator (see 7 WARNINGS AND PRECAUTIONS, Genitourinary).
In the CANVAS integrated dataset, the adjusted-incidence rates of any male mycotic genital infection were 3.17 and 0.96 per 100 patient-years in the combined canagliflozin and placebo groups, respectively.
Urinary tract infections: Urinary tract infections were more frequently reported for canagliflozin 100 mg and 300 mg (5.9% versus 4.3%, respectively) compared to 4.0% with placebo. Most infections were mild to moderate with no increase in the occurrence of serious adverse events (see 7 WARNINGS AND PRECAUTIONS, Genitourinary). Subjects responded to standard treatments while continuing canagliflozin treatment. The incidence of recurrent infections was not increased with canagliflozin.
Falls: In the pool of all Phase 3 studies, the incidence rate of AEs coded as related to a fall was 7.3, 8.0, and 11.8 per 1000 patient years of exposure to comparator, canagliflozin 100 mg, and canagliflozin 300 mg, respectively.
Bone fractures: In a cardiovascular study (CANVAS) of 4,327 patients with established or at least two risk factors for cardiovascular disease, the incidence rates of all adjudicated bone fracture were 1.59, 1.79, and 1.09 per 100 patient-years of follow up to canagliflozin 100 mg, canagliflozin 300 mg, and placebo, respectively, with the fracture imbalance initially occurring within the first 26 weeks of therapy.
In a second cardiovascular study (CANVAS-R) of 5,807 patients with established or at least two risk factors for cardiovascular disease, the incidence rates of all adjudicated bone fracture were 1.14 and 1.32 events per 100 patient-years of follow up to canagliflozin and placebo, respectively.
In a long-term renal outcomes study (CREDENCE) of 4,397 patients with type 2 diabetes and diabetic nephropathy, the incidence rates of all adjudicated bone fracture were 1.18 and 1.21 events per 100 patient-years of follow-up for canagliflozin 100 mg and placebo, respectively. In other type 2 diabetes studies with canagliflozin, which enrolled a general diabetes population of 7,729 patients, the incidence rates of all adjudicated bone fracture were 1.18 and 1.08 events per 100 patient-years of follow up to canagliflozin and control, respectively.
Decreases in Bone Mineral Density: Bone mineral density (BMD) was measured by dual-energy X-ray absorptiometry in a clinical trial of 714 older adults (mean age 64 years). At 2 years, patients randomized to canagliflozin 100 mg and canagliflozin 300 mg had placebo-corrected declines in BMD at the total hip of 0.9% and 1.2%, respectively, and at the lumbar spine of 0.3% and 0.7%, respectively. Placebo-adjusted BMD declines were 0.1% at the femoral neck for both canagliflozin doses and 0.4% at the distal forearm for patients randomized to canagliflozin 300 mg. The placebo-adjusted change at the distal forearm for patients randomized to canagliflozin 100 mg was 0%.
Photosensitivity: In the CANVAS outcome trials integrated dataset, the adjusted-incidence rates of photosensitivity adverse events were 1.03 (0.3%, 19/5790) and 0.26 (0.1%, 3/4344) events per 1,000 subject-years in the combined canagliflozin and the placebo groups, respectively. In a dataset from 12 other phase 3 or 4 trials (excluding the CANVAS outcome trials) that enrolled a diabetic population of 8114 patients, an imbalance in phototoxicity adverse events was not seen with canagliflozin relative to control.
Skin ulcers and peripheral ischemia: In the pool of 8 clinical studies with 78 weeks of mean duration of exposure, skin ulcers occurred in 0.7%, 1.1%, and 1.5% of patients and peripheral ischemia occurred in 0.1%, 0.4%, and 0.2% of patients receiving comparator, canagliflozin 100 mg, and canagliflozin 300 mg, respectively. An imbalance in these events generally were seen within the first 24 weeks of treatment and occurred in patients with known or at high risk for atherosclerotic disease, longer duration of diabetes, presence of diabetic complications, and diuretic use. In the on-treatment analysis set of the CREDENCE renal outcomes trial, there was a higher incidence rate of adverse events of diabetic foot reported in the canagliflozin group compared with the placebo group: 8.47 (43 subjects) and 4.89 (24 subjects) per 1,000 subject-years, respectively.
Renal Cell Carcinoma: In the CANVAS outcome trials integrated dataset, the adjusted-incidence rates of any renal cell carcinoma adverse event were 0.62 (0.2%, 14/5790) and 0.21 (0.1%, 3/4344) per 1,000 subject-years in the canagliflozin and the placebo groups, respectively. Whether this numerical imbalance is related to canagliflozin treatment is unknown.
Lower limb amputation: An approximately 2-fold increased risk of lower limb amputations associated with canagliflozin use was observed in CANVAS and CANVAS-R, two large, randomized, placebo-controlled trials evaluating patients with type 2 diabetes who had either established cardiovascular disease or were at risk for cardiovascular disease. The imbalance occurred as early as the first 26 weeks of therapy. Patients in CANVAS and CANVAS-R were followed for an average of 5.7 and 2.1 years, respectively. The amputation data for CANVAS and CANVAS-R are shown in Table 11 and Table 12, respectively. See 7 WARNINGS AND PRECAUTIONS, Cardiovascular.
| Table 11: CANVAS Amputations | ||||||||||||||
|---|---|---|---|---|---|---|---|---|---|---|---|---|---|---|
| Placebo (N=1441) | Canagliflozin 100 mg (N=1445) | Canagliflozin 300 mg (N=1441) | Canagliflozin Pooled (N=2886) | |||||||||||
| Patients with an amputation, n (%) | 22 (1.5) | 50 (3.5) | 45 (3.1) | 95 (3.3) | ||||||||||
| Total amputations | 33 | 83 | 79 | 162 | ||||||||||
| Amputation incidence rate (per 1000 patient-years) | 2.8 | 6.2 | 5.5 | 5.9 | ||||||||||
| Hazard ratio (95% CI) | 2.24 (1.36, 3.69) | 2.01 (1.20, 3.34) | 2.12 (1.34, 3.38) | |||||||||||
Note: Incidence is based on the number of patients with at least one amputation, and not the total number of amputation events. A patient’s follow-up is calculated from Day 1 to the first amputation event date. Some patients had more than one amputation.
| Table 12: CANVAS-R Amputations | ||||||
|---|---|---|---|---|---|---|
| Table 12: CANVAS-R Amputations | ||||||
Placebo (N=2903) | Canagliflozin 100 mg (with up-titration to 300 mg) (N=2904) | |||||
Placebo (N=2903) | Canagliflozin 100 mg (with up-titration to 300 mg) (N=2904) | |||||
| Patients with an amputation, n (%) | 25 (0.9) | 45 (1.5) | ||||
| Total amputations | 36 | 59 | ||||
| Amputation incidence rate (per 1000 patient-years) | 4.2 | 7.5 | ||||
| Hazard Ratio (95% CI) | -- | 1.80 (1.10, 2.93) | ||||
Note: Incidence is based on the number of patients with at least one amputation, and not the total number of amputation events. A patient’s follow-up is calculated from Day 1 to the first amputation event date. Some patients had more than one amputation.
In a data pool of patients from 12 other phase 3 or 4 trials (excluding CANVAS program) that enrolled a diabetic population of 8114 patients, the majority of which were without cardiovascular disease, no difference in lower limb amputation risk was observed on canagliflozin relative to control.
The risk of lower limb amputations associated with the use of canagliflozin 100 mg relative to placebo was 12.3 vs 11.2 events per 1000 patient-years, respectively in CREDENCE, a long-term renal outcomes study of 4,397 patients with type 2 diabetes and diabetic nephropathy, with a mean follow-up duration of 136 weeks (see Table 13 and 7 WARNINGS AND PRECAUTIONS, Cardiovascular).
| Table 13: Lower limb amputations CREDENCE (On-study analysis) | ||||||||
|---|---|---|---|---|---|---|---|---|
Placebo (N=2197) | Canagliflozin 100 mg (N=2200) | |||||||
| Patients with an amputation, n (%) | 63 (2.9) | 70 (3.2) | ||||||
| Total amputations | 96 | 87 | ||||||
| Amputation incidence rate (per 1000 patient-years) | 11.2 | 12.3 | ||||||
| Hazard Ratio (95% CI) | -- | 1.11 (0.79, 1.56) | ||||||
Note: Incidence is based on the number of patients with at least one amputation, and not the total number of amputation events. A patient’s follow-up is calculated from Day 1 to the first amputation event date. Some patients had more than one amputation.
Elderly Patients: Compared to younger patients, patients 65 years and older had a higher incidence of adverse reactions related to reduced intravascular volume with canagliflozin, including hypotension, postural dizziness, orthostatic hypotension, syncope, and dehydration. In particular, in patients ≥75 years of age, adverse reactions related to reduced intravascular volume occurred with incidence rates of 5.27, 6.08, and 2.41 events per 100 patient-years of exposure for canagliflozin 100 mg, canagliflozin 300 mg, and the control group, respectively. Decreases in eGFR (-3.41 and -4.67 mL/min/1.73 m2) were reported with canagliflozin 100 mg and 300 mg, respectively, compared to the control group (-4.15 mL/min/1.73 m2) (see 7.1.4 Geriatrics and 4 DOSAGE AND ADMINISTRATION).
Patients with Type 2 Diabetes Mellitus and an eGFR 45 to < 60 mL/min/1.73 m2 Treated for Glycemic Control or for the Reduction of MACE: In a pooled analysis of patients (N=722) with a baseline eGFR 45 to <60 mL/min/1.73 m2, the incidence rates of adverse reactions related to reduced intravascular volume were 4.61 for canagliflozin 100 mg and 4.37 with canagliflozin 300 mg relative to 3.00 events per 100 patient-years of exposure for placebo (see 7 WARNINGS AND PRECAUTIONS and 4 DOSAGE AND ADMINISTRATION). Serum creatinine levels increased from baseline to end of treatment by 5.92 and 6.98 mcmol/L for canagliflozin 100 mg and 300 mg, respectively, relative to 7.03 mcmol/L with placebo. Blood urea nitrogen (BUN) levels increased from baseline to end of treatment by 0.92 and 0.77 mcmol/L for canagliflozin 100 mg and 300 mg, respectively, relative to 0.57 mcmol/L with placebo. The incidence rates of decreases in eGFR (< 80 mL/min/1.73 m2 and > 30% decrease from baseline) at any time during treatment were 5.17, 6.62, and 5.82 events per 100 patient-years of exposure for canagliflozin 100 mg, canagliflozin 300 mg, and placebo, respectively. At the last post-baseline value, incidence rates for such decreases were 2.52 for patients treated with canagliflozin 100 mg, 1.91 for patients treated with canagliflozin 300 mg, and 3.20 events per 100 patient-years of exposure for placebo (see 7 WARNINGS AND PRECAUTIONS).
The incidences of elevated serum potassium (> 5.4 mEq/L and 15% above baseline) at any post-baseline value were 4.11 for canagliflozin 100 mg, 4.33 for canagliflozin 300 mg, and 3.8 events per 100 patient-years of exposure for placebo. Rare, more severe elevations were seen in patients with moderate renal impairment who had prior elevated potassium concentrations and/or who were on multiple medications that reduce potassium excretion, such as potassium-sparing diuretics and angiotensin-converting-enzyme (ACE) inhibitors.
Serum phosphate changes from baseline to end of treatment were 0.00 and 0.02 mmol/L for canagliflozin 100 mg and 300 mg, respectively, compared to 0.00 mmol/L for placebo. The incidence rates of elevated serum phosphate (> 1.65 mmol/L and 25% above baseline) at any post-baseline value were 0.93 for canagliflozin 100 mg, 1.15 for canagliflozin 300 mg, and 0.71 events per 100 patient-years of exposure for placebo.
Patients with Type 2 Diabetes Mellitus and an eGFR 30 to < 60 mL/min/1.73 m2 Treated for Diabetic Nephropathy: In a long-term renal outcomes study in patients with type 2 diabetes and diabetic nephropathy, the incidence rate for renal-related adverse events was lower in the canagliflozin 100-mg group compared with the placebo group (7.23 and 10.55 per 100 patient-years in canagliflozin 100mg and placebo, respectively).
For the subset of patients with an eGFR before treatment of 45 to < 60 mL/min/1.73m2, the incidence rates of adverse reactions related to volume depletion were similar: 2.3 events per 100 patient-years for canagliflozin 100 mg and 2.6 events per 100 patient-years of exposure for placebo. In the same study, for patients with an eGFR 30 to < 45mL/min/1.73m2 the incidence rate was higher for canagliflozin 100 mg (4.9 events per 100 patient-years) than for placebo (2.6 events per 100 patient-years).
8.4 Abnormal Laboratory Findings: Hematologic, Clinical Chemistry and Other Quantitative Data
Laboratory values, described below, are derived from the pooled analysis of 26-week, placebo-controlled clinical studies unless otherwise noted.
Increases in serum potassium: Mean percent changes from baseline in blood potassium were 0.5% and 1.0% for canagliflozin 100 mg and 300 mg, respectively, compared to 0.6% for placebo. Episodes of elevated serum potassium (> 5.4 mEq/L and 15% above baseline) were seen in 4.4% of patients treated with canagliflozin 100 mg, 7.0% of patients treated with canagliflozin 300 mg, and 4.8% of patients treated with placebo.
In a trial in patients with moderate renal impairment (eGFR 30 to < 50 mL/min/1.73 m2), increases in serum potassium to >5.4 mEq/L and 15% above baseline were seen in 16.1%, 12.4%, and 27.0% of patients treated with placebo, canagliflozin 100 mg, and canagliflozin 300 mg, respectively. Elevations to ≥ 6.5 mEq/L occurred in 1.1%, 2.2%, and 2.2% of patients treated with placebo, canagliflozin 100 mg, and canagliflozin 300 mg, respectively.
In a long-term renal outcomes study in patients with type 2 diabetes and diabetic nephropathy, no increase in adverse events of hyperkalemia, and no absolute (> 6.5mEq/L) or relative (> upper limit of normal and > 15% increase from baseline) increases in serum potassium were observed with canagliflozin 100 mg relative to placebo.
Increases in serum creatinine and blood urea nitrogen (BUN): Mean percent changes from baseline in creatinine, with commensurate decreases in eGFR, were 2.8% and 4.0% for canagliflozin 100 mg and 300 mg, respectively, compared to 1.5% for placebo. Mean percent increases from baseline in BUN were 17.1% and 18.0% for canagliflozin 100 mg and 300 mg, respectively, compared to 2.7% for placebo. These changes were generally observed within six weeks of treatment initiation. Subsequently, serum creatinine concentrations gradually trended toward baseline and BUN levels remained stable.
The proportion of patients with larger decreases in eGFR (>30%) from baseline, occurring at any time during treatment, was 2.0% with canagliflozin 100 mg and 4.1% with canagliflozin 300 mg relative to 2.1% with placebo. At study end, decreases of >30% from baseline were seen for 0.7% of subjects with canagliflozin 100 mg, 1.4% with canagliflozin 300 mg, and 0.5% with placebo (see 7 WARNINGS AND PRECAUTIONS). After discontinuation of canagliflozin therapy, these changes in laboratory values improved or returned to baseline.
In an integrated analysis of data from two long-term cardiovascular outcome studies, patients treated with canagliflozin experienced an initial fall in mean eGFR that thereafter stabilized (see Figure 1) whereas patients treated with placebo experienced a progressive decline in eGFR.
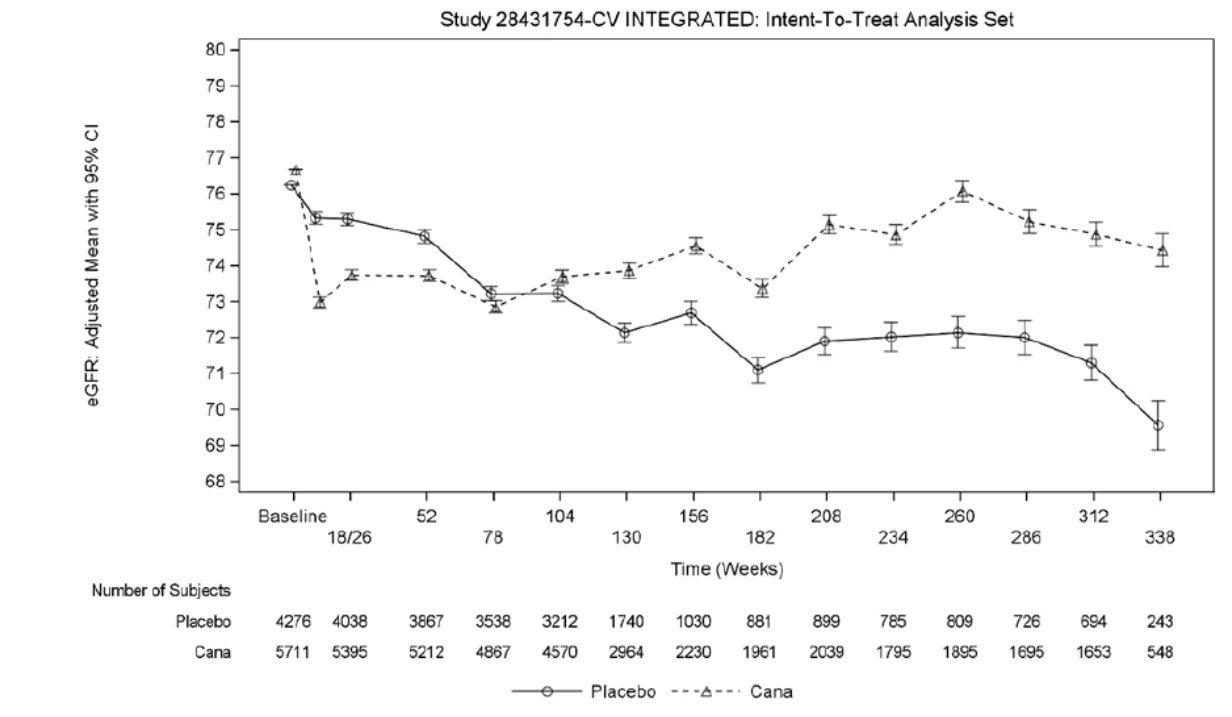
Figure 1: Adjusted mean eGFR over time
In a long-term renal outcomes trial, patients treated with canagliflozin experienced an acute decrease in eGFR at Week 3, followed by an attenuated decline over time from week 3 to end of treatment. Placebo-treated patients demonstrated a progressive linear decline over time. After Week 52, the LS mean decrease in eGFR was smaller in the canagliflozin 100 mg group than in the placebo group (Figure 2).
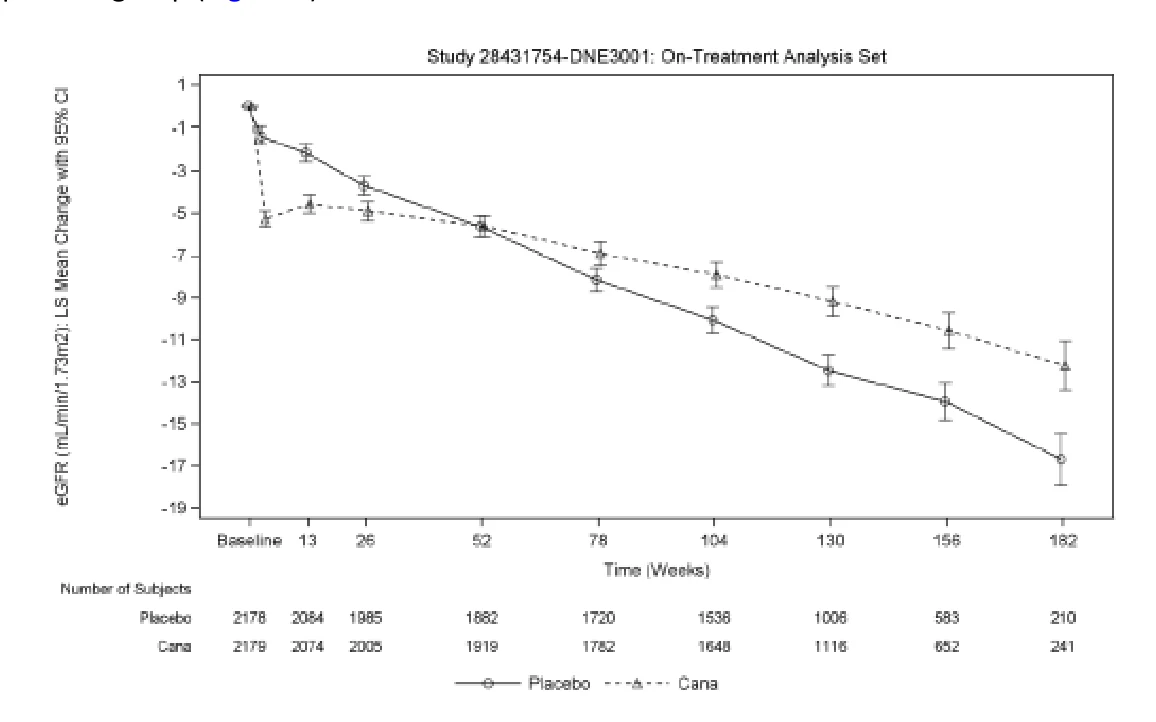
Figure 2: LS Mean Change From Baseline in eGFR Over Time (On-Treatment Analysis Set)
Lipid changes: Compared to placebo, mean increases from baseline in low density lipoprotein cholesterol (LDL-C) were 0.11 mmol/L (4.5%) and 0.21 mmol/L (8.0%) with canagliflozin 100 mg and canagliflozin 300 mg, respectively. Increases in total cholesterol of 0.12 mmol/L (2.5%) and 0.21 mmol/L (4.3%) were seen, relative to placebo, for canagliflozin 100 mg and canagliflozin 300 mg, respectively. Increases in non-HDL-C relative to placebo were 0.05 mmol/L (1.5%) and 0.13 mmol/L (3.6%) with canagliflozin 100 mg and 300 mg, respectively. Increases in high-density lipoprotein cholesterol (HDL-C) were 0.06 mmol/L (5.4%), and 0.07 mmol/L (6.3%) relative to placebo for canagliflozin 100 mg and canagliflozin 300 mg, respectively. The LDL-C/HDL-C ratios did not change with either canagliflozin dose compared to placebo.
Increases in hemoglobin: Mean hemoglobin concentration increased from baseline 4.7 g/L (3.5%) with canagliflozin 100 mg and 5.1 g/L (3.8%) with canagliflozin 300 mg, compared to a decrease of -1.8 g/L (-1.1%) with placebo. After 26 weeks of treatment, 0.8%, 4.0%, and 2.7% of patients treated with placebo, canagliflozin 100 mg, and canagliflozin 300 mg, respectively, had a hemoglobin level above the upper limit of normal.
Increases in serum phosphate: Dose-related increases in serum phosphate levels were observed with canagliflozin. In the pool of four placebo-controlled trials, the mean percent change in serum phosphate levels were 3.6% and 5.1% with canagliflozin 100 mg and canagliflozin 300 mg, respectively, compared to 1.5% with placebo. Episodes of elevated serum phosphate (>1.65 mmol/L and 25% above baseline) were seen in 0.6% and 1.6% of patients treated with canagliflozin 100 mg and 300 mg, respectively, compared to 1.3% of patients treated with placebo.
Decreases in serum urate: Moderate decreases in the mean percent change from baseline in serum urate were observed in the canagliflozin 100 mg and 300 mg groups (-10.1% and -10.6%, respectively) compared with placebo, where a slight increase from baseline (1.9%) was observed. Decreases in serum urate in the canagliflozin groups were maximal or near maximal by Week 6 and maintained with dosing. A transient increase in urinary uric acid excretion was seen, which was not persistent.
Electrolytes: The following changes from baseline to end of treatment in serum electrolytes were observed during canagliflozin treatment in the CANVAS integrated database.
| Table 14: Placebo-adjusted Mean Changes from Baseline in Electrolytes at Week 18 or 26a in the CANVAS program | ||||||||
|---|---|---|---|---|---|---|---|---|
| Table 14: Placebo-adjusted Mean Changes from Baseline in Electrolytes at Week 18 or 26a in the CANVAS program | ||||||||
| Analyte [normal range, unit] | Baseline, mean (SE) | Placebo-corrected change from baseline at Week 18 or 26a, mean (95%) | p-value | |||||
| Analyte [normal range, unit] | Baseline, mean (SE) | Placebo-corrected change from baseline at Week 18 or 26a, mean (95%) | p-value | |||||
| Sodium [135 – 145 mmol/L] | ||||||||
| Canagliflozin | 139.3 (0.036) | 0.40 (0.304; 0.496) | <0.001 | |||||
| Potassium [3.5 – 5.0 mmol/L] | ||||||||
| Canagliflozin | 4.44 (0.006) | 0.01 (-0.005; 0.028) | 0.171 | |||||
| Magnesium [0.75 – 0.95 mmol/L] | ||||||||
| Canagliflozin | 0.77 (0.001) | 0.08 (0.074; 0.080) | <0.001 | |||||
| Bicarbonate [24 – 30 mmol/L] | ||||||||
| Canagliflozin | 23.33 (0.036) | -0.41 (-0.504; -0.307) | <0.001 | |||||
| Phosphate [0.80 - 1.50 mmol/L] | ||||||||
| Canagliflozin | 1.16 (0.002) | 0.03 (0.028; 0.040) | <0.001 | |||||
| Calcium [2.07 - 2.64 mmol/L] | ||||||||
| Canagliflozin | 2.41 (0.002) | 0.02 (0.012;0.020) | <0.001 | |||||
a CANVAS study blood chemistries obtained at week 18, CANVAS-R study blood chemistries obtained at week 26
SE = standard error
ANCOVA for Week 18 or 26 includes the baseline electrolyte as a linear covariate, and treatment and study as fixed effects.
The following shifts from normal range at baseline to below or above the normal range at worst value on treatment were reported in the treated set in the CANVAS integrated database:
- Increases in serum sodium above the upper limit of normal occurred more frequently in patients receiving canagliflozin than in those receiving placebo (2.63 per 100 subject years for canagliflozin and 1.80 per 100 subject years for placebo).
- Decreases in serum magnesium below the lower limit of normal occurred more frequently in patients receiving placebo (0.65 per 100 subject years for canagliflozin and 3.80 per 100 subject years for placebo), whilst increases in serum magnesium above the upper limit of normal occurred more frequently in patients receiving canagliflozin than in those receiving placebo (1.25 per 100 subject years for canagliflozin and 0.88 per 100 subject years for placebo).
- Decreases of serum bicarbonate below the lower limit of normal occurred more frequently in patients receiving canagliflozin than in those receiving placebo (2.91 per 100 subject years for canagliflozin, 2.39 per 100 subject years for placebo).
- Increases of serum phosphate above the upper limit of normal occurred more frequently in patients receiving canagliflozin than in those receiving placebo (1.36 per 100 subject years for canagliflozin and 1.00 per 100 subject years for placebo).
8.5 Post-Market Adverse Reactions
Gastrointestinal Disorders: pancreatitis acute
Metabolism and nutrition disorders: diabetic ketoacidosis
Immune system disorders: anaphylactic reaction
Skin and subcutaneous tissue disorders: angioedema
Renal and urinary disorders: acute kidney injury, including acute renal failure (with or without volume depletion)
Genitourinary: severe urinary tract infections; urosepsis and pyelonephritis
Musculoskeletal: bone fractures
Infections and Infestations: Fournier’s gangrene (necrotizing fasciitis of the perineum)
9 DRUG INTERACTIONS
9.2 Drug Interactions Overview
Canagliflozin did not induce CYP450 enzyme expression (3A4, 2C9, 2C19, 2B6, and 1A2) in cultured human hepatocytes. Canagliflozin did not inhibit the CYP450 isoenzymes (1A2, 2A6, 2C19, 2D6, or 2E1) and weakly inhibited CYP2B6, CYP2C8, CYP2C9, and CYP3A4 based on in vitro studies with human hepatic microsomes. Canagliflozin is a weak inhibitor of P-gp.
Canagliflozin is also a substrate of drug transporters P-glycoprotein (P-gp), Breast Cancer Resistance Protein (BCRP) and Multi-Drug Resistance-Associated Protein 2 (MRP2).
Inhibition of BCRP by canagliflozin cannot be excluded at an intestinal level and increased exposure may therefore occur for drugs transported by BCRP, e.g., certain statins like rosuvastatin and some anti-cancer agents.
9.3 Drug-Behavioural Interactions
Patients should be alerted to the elevated risk of adverse reactions related to reduced intravascular volume, such as postural dizziness, and to the risk of hypoglycemia when Sandoz Canagliflozin is used as add-on therapy with insulin or an insulin secretagogue (see 7 WARNINGS AND PRECAUTIONS, Cardiovascular, 8 ADVERSE REACTIONS, Description of Selected Adverse Reactions and 4.1 Dosing Considerations).
9.4 Drug-Drug Interactions
The drugs listed are based on either drug interaction case reports or studies, or potential interactions due to the expected magnitude and seriousness of the interaction.
Effects of other drugs on canagliflozin
In clinical studies, the effects of other drugs on canagliflozin were assessed. Cyclosporin (P-gp inhibitor), hydrochlorothiazide, oral contraceptives (ethinyl estradiol and levonorgestrel), metformin, and probenecid (UGT, MRP2, OATP, OAT1 and OAT3 inhibitor) had no clinically relevant effect on the pharmacokinetics of canagliflozin.
| Table 15: Effect of Co-administered Drugs on Systemic Exposure of Canagliflozin | ||||||||||||
|---|---|---|---|---|---|---|---|---|---|---|---|---|
| Co-administered Drug | Dose of Co-administered Drug1 | Dose of Canagliflozin1 | Geometric Mean Ratio (Ratio With/Without Co-administered Drug) No Effect = 1.0 | Clinical Comment | ||||||||
AUC2 (90% CI) | Cmax (90% CI) | |||||||||||
| Cyclosporin | 400 mg | 300 mg once daily for 8 days | 1.23 (1.19; 1.27) | 1.01 (0.91; 1.11) | No dosage adjustment for Sandoz Canagliflozin required | |||||||
| Ethinyl estradiol and levonorgestrel | 0.03 mg ethinyl estradiol and 0.15 mg levonorgestrel | 200 mg once daily for 6 days | 0.91 (0.88; 0.94) | 0.92 (0.84; 0.99) | No dosage adjustment for Sandoz Canagliflozin required | |||||||
| Hydrochlorothiazide | 25 mg once daily for 35 days | 300 mg once daily for 7 days | 1.12 (1.08; 1.17) | 1.15 (1.06; 1.25) | No dosage adjustment for Sandoz Canagliflozin required | |||||||
| Metformin | 2000 mg | 300 mg once daily for 8 days | 1.10 (1.05; 1.15) | 1.05 (0.96; 1.16) | No dosage adjustment for Sandoz Canagliflozin required | |||||||
| Probenecid | 500 mg twice daily for 3 days | 300 mg once daily for 17 days | 1.21 (1.16; 1.25) | 1.13 (1.00; 1.28) | No dosage adjustment for Sandoz Canagliflozin required | |||||||
| Inducers of UGT enzymes / drug transporters | ||||||||||||
| Rifampin | 600 mg once daily for 8 days | 300 mg | 0.49 (0.44; 0.54) | 0.72 (0.61; 0.84) | Consider increasing the Sandoz Canagliflozin dose to 300 mg once daily if patients are currently tolerating Sandoz Canagliflozin 100 mg once daily (refer to 4 DOSAGE AND ADMINISTRATION). | |||||||
| Phenytoin, phenobarbital, barbiturates, carbamazepine, ritonavir, efavirenz, or St. John’s Wort | N/A3 | Consider increasing the Sandoz Canagliflozin dose to 300 mg once daily if patients are currently tolerating Sandoz Canagliflozin 100 mg once daily (refer to 4 DOSAGE AND ADMINISTRATION). | ||||||||||
1 Single dose unless otherwise noted
2 AUCinf for drugs given as a single dose and AUC24h for drugs given as multiple doses
3 N/A = Not applicable
Effects of canagliflozin on other drugs
Canagliflozin at steady-state had no clinically relevant effect on the pharmacokinetics of metformin, oral contraceptives (ethinyl estradiol and levonorgestrel-CYP3A4 substrates), glyburide (CYP2C9 substrate), simvastatin (CYP3A4 substrate), acetaminophen, hydrochlorothiazide, or warfarin (CYP2C9 substrate), in healthy subjects.
Pharmacokinetic Interactions
Lithium: The concomitant use of Sandoz Canagliflozin or other SGLT2 inhibitors with lithium may decrease serum lithium levels through increased renal lithium elimination. Therefore, serum lithium concentration should be monitored more frequently with Sandoz Canagliflozin initiation, following dosage changes or following discontinuation. The patient should be referred to their lithium prescriber for serum lithium concentration monitoring and clinical supervision as required during treatment.
| Table 16: Effect of Canagliflozin on Systemic Exposure of Co-Administered Drugs | ||||||||||
|---|---|---|---|---|---|---|---|---|---|---|
| Table 16: Effect of Canagliflozin on Systemic Exposure of Co-Administered Drugs | ||||||||||
| Co-Administered Drug | Dose of Co-Administered Drug1 | Dose of Canagliflozin1 | Geometric Mean Ratio (Ratio With/ Without Co-Administered Drugs) No Effect = 1.0 | Clinical Comment | ||||||
| Co-Administered Drug | Dose of Co-Administered Drug1 | Dose of Canagliflozin1 | Geometric Mean Ratio (Ratio With/ Without Co-Administered Drugs) No Effect = 1.0 | Clinical Comment | ||||||
AUC2 (90% CI) | Cmax (90% CI) | |||||||||
AUC2 (90% CI) | Cmax (90% CI) | |||||||||
| Digoxin | 0.5 mg once daily first day followed by 0.25 mg once daily for 6 days | 300 mg once daily for 7 days | Digoxin | 1.20 (1.12; 1.28) | 1.36 (1.21; 1.53) | Patients taking Sandoz Canagliflozin with concomitant digoxin should be monitored appropriately | ||||
| Ethinyl estradiol and levonorgestrel | 0.03 mg ethinyl estradiol and 0.15 mg levonorgestrel | 200 mg once daily for 6 days | ethinyl estradiol | 1.07 (0.99; 1.15) | 1.22 (1.10; 1.35) | No dosage adjustment required for ethinyl estradiol and levonorgestrel | ||||
| Levonorgestrel | 1.06 (1.00; 1.13) | 1.22 (1.11; 1.35) | ||||||||
| Glyburide | 1.25 mg | 200 mg once daily for 6 days | Glyburide | 1.02 (0.98; 1.07) | 0.93 (0.85; 1.01) | No dosage adjustment required for glyburide | ||||
| 3-cis-hydroxy-glyburide | 1.01 (0.96; 1.07) | 0.99 (0.91; 1.08) | ||||||||
| 4-trans-hydroxy-glyburide | 1.03 (0.97; 1.09) | 0.96 (0.88; 1.04) | ||||||||
| Hydrochloro-thiazide | 25 mg once daily for 35 days | 300 mg once daily for 7 days | Hydrochloro-thiazide | 0.99 (0.95; 1.04) | 0.94 (0.87; 1.01) | No dosage adjustment required for hydrochlorothiazide | ||||
| Metformin | 2000 mg | 300 mg once daily for 8 | Metformin | 1.20 (1.08; | 1.06 (0.93; | No dosage adjustment | ||||
| days | 1.34) | 1.20) | required for metformin | |||||||
| Acetaminophen | 1000 mg | 300 mg twice daily for 25 days | Acetaminophen | 1.063 (0.98; 1.14) | 1.00 (0.92; 1.09) | No dosage adjustment required for acetaminophen | ||||
| Simvastatin | 40 mg | 300 mg once daily for 7 days | Simvastatin | 1.12 (0.94; 1.33) | 1.09 (0.91; 1.31) | No dosage adjustment required for simvastatin | ||||
| simvastatin acid | 1.18 (1.03; 1.35) | 1.26 (1.10; 1.45) | ||||||||
| Warfarin | 30 mg | 300 mg once daily for 12 days | (R)-warfarin | 1.01 (0.96; 1.06) | 1.03 (0.94; 1.13) | No dosage adjustment required for warfarin | ||||
| (S)-warfarin | 1.06 (1.00; 1.12) | 1.01 (0.90; 1.13) | ||||||||
1 Single dose unless otherwise noted
2 AUCinf for drugs given as a single dose and AUC24h for drugs given as multiple doses.
3 AUC0-12h
Sandoz Canagliflozin is not recommended for use in patients receiving loop diuretics. Sandoz Canagliflozin may add to the effect of diuretics and may increase the risk of hypovolemia and hypotension (see 7 WARNINGS AND PRECAUTIONS and 4 DOSAGE AND ADMINISTRATION).
9.5 Drug-Food Interactions
Interactions with food have not been established.
9.6 Drug-Herb Interactions
St John’s Wort (Hypericum perforatum) is a CYP3A4 inducer and co-administration with Sandoz Canagliflozin may result in loss of efficacy or reduced clinical response. Dosage adjustment may be required (see 4.2 Recommended Dose and Dosage Adjustment).
9.7 Drug-Laboratory Test Interactions
Due to its mechanism of action, patients taking Sandoz Canagliflozin will test positive for glucose in their urine.
Increases in urinary glucose excretion with Sandoz Canagliflozin can falsely lower 1,5-anhydroglucitol (1,5 AG) levels and make measurements of 1,5 AG unreliable in assessing glycemic control. Therefore, 1,5-AG assays should not be used for assessment of glycemic control in patients on canagliflozin. For further detail, it may be advisable to contact the specific manufacturer of the 1,5-AG assay.
10 CLINICAL PHARMACOLOGY
10.1 Mechanism of Action
Sodium-glucose co-transporter 2 (SGLT2), expressed in the proximal renal tubules, is responsible for the majority of the reabsorption of filtered glucose from the tubular lumen. Patients with diabetes have been shown to have elevated renal glucose reabsorption which may contribute to persistent elevated glucose concentrations. Canagliflozin is an orally-active inhibitor of SGLT2. By inhibiting SGLT2, canagliflozin reduces reabsorption of filtered glucose and lowers the renal threshold for glucose (RTG), and thereby increases urinary glucose excretion, which decreases elevated plasma glucose concentrations by an insulin-independent mechanism in patients with type 2 diabetes. The increased urinary glucose excretion with SGLT2 inhibition also translates to an osmotic diuresis, with the diuretic effect leading to a reduction in systolic blood pressure; the increase in urinary glucose excretion results in a loss of calories and therefore a reduction in body weight, as demonstrated in studies of patients with type 2 diabetes.
Canagliflozin’s action to increase UGE directly lowering plasma glucose is independent of insulin. Improvement in homeostasis model assessment for beta-cell function (HOMA beta-cell) and improved beta-cell insulin secretion response to a mixed-meal challenge has been observed in clinical studies with canagliflozin.
In Phase 3 studies, pre-meal administration of canagliflozin 300 mg provided a greater reduction in post-meal glucose excursion than observed with the 100 mg dose. This effect at the 300 mg dose of canagliflozin may, in part, be due to local inhibition of intestinal SGLT1 (an important intestinal glucose co-transporter) related to transient high concentrations of canagliflozin in the intestinal lumen prior to drug absorption (canagliflozin is a low potency inhibitor of SGLT1). Studies have shown no glucose malabsorption with canagliflozin.
10.2 Pharmacodynamics
Following single and multiple oral doses of canagliflozin to patients with type 2 diabetes, dose-dependent decreases in RTG and increases in urinary glucose excretion were observed. From a starting value of RTG of approximately 13 mmol/L, maximal suppression of 24-hour mean RTG was seen with the 300 mg daily dose to approximately 4 to 5 mmol/L in patients with type 2 diabetes in Phase 1 studies (see model in Figure 3), suggesting a low risk for treatment-induced hypoglycemia. The reductions in RTG led to increased UGE in subjects with type 2 diabetes treated with either 100 mg or 300 mg of canagliflozin ranging from 77 to 119 g/day across the Phase 1 studies; the UGE observed translates to a loss of 308 to 476 kcal/day. The reductions in RTG and increases in UGE were sustained over a 26-week dosing period in patients with type 2 diabetes. Moderate increases (generally <400-500 mL) in daily urine volume were seen that attenuated over several days of dosing. Urinary uric acid excretion was transiently increased by canagliflozin (increased by 19% compared to baseline on day 1 and then attenuating to 6% on day 2 and 1% on day 13). This was accompanied by a sustained reduction in serum uric acid concentration of approximately 20%.
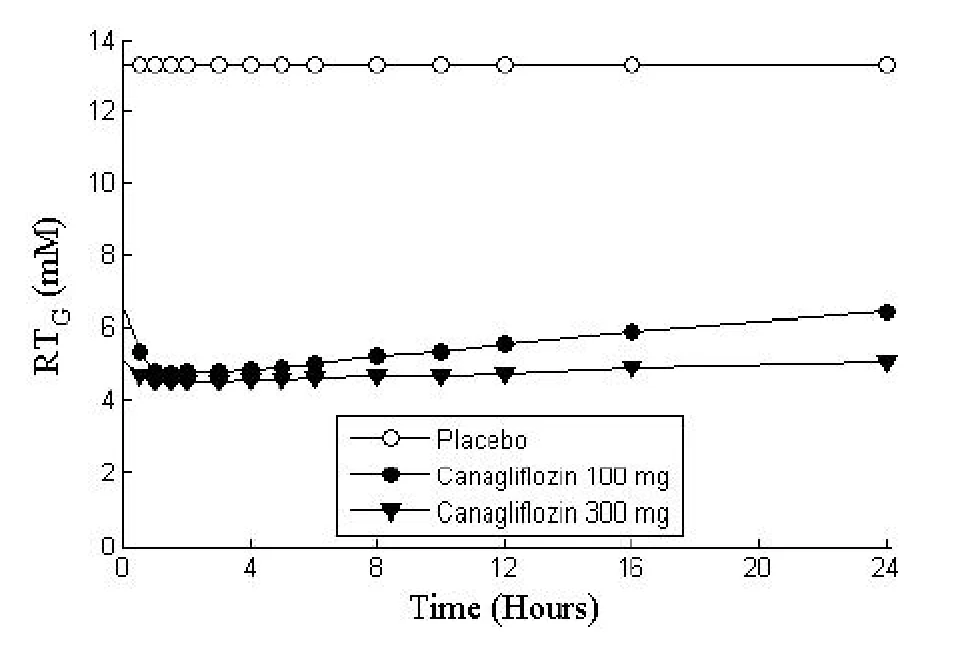
Figure 3: Predicted (PK/PD Modelled) 24-Hour Profile for RTG in Subjects with Type 2 Diabetes Treated with Canagliflozin 100 mg and 300 mg
In a single-dose study in patients with type 2 diabetes, treatment with 300 mg before a mixed meal delayed intestinal glucose absorption and reduced postprandial glucose through both renal and non-renal mechanisms.
Cardiac electrophysiology
In a randomized, double-blind, placebo-controlled, active-comparator, 4-way crossover study, 60 healthy subjects were administered a single oral dose of canagliflozin 300 mg, canagliflozin 1200 mg (4 times the maximum recommended dose), moxifloxacin, and placebo. No meaningful changes in QTc interval were observed with either the recommended dose of 300 mg or the 1200 mg dose. At the 1200 mg dose, peak canagliflozin plasma concentrations were approximately 1.4 times the steady-state peak concentrations following a 300 mg once-daily dose.
10.3 Pharmacokinetics
Pharmacokinetics of canagliflozin were comparable between healthy volunteers and type 2 diabetic patients based on clinical trials and population pharmacokinetic data. After single-dose oral administration of 100 mg and 300 mg in healthy subjects, canagliflozin was rapidly absorbed, with peak plasma concentrations (median Tmax) occurring 1 to 2 hours post-dose. Plasma Cmax and AUC of canagliflozin increased in a dose-proportional manner from 50 mg to 300 mg. The apparent terminal half-life (t1/2) (expressed as mean ± standard deviation) was 10.6 ± 2.13 hours to 13.1 ± 3.28 hours for the 100 mg and 300 mg doses, respectively. Steady-state was reached after 4 to 5 days of once-daily dosing with canagliflozin 100 mg to 300 mg. Canagliflozin does not exhibit time-dependent pharmacokinetics, and accumulated in plasma up to 36% following multiple doses of 100 mg and 300 mg.
| Table 17: Summary of Canagliflozin’s Pharmacokinetic Parameters in Healthy Subjects and T2DM Patients at Steady State | |||||||||||||
|---|---|---|---|---|---|---|---|---|---|---|---|---|---|
| N | Cmax (SD) (ng/mL) | t1/2 (h) | AUC24h (SD) (ng.h/mL) | Cl/F | Vd/F | ||||||||
| Healthy Volunteersa | |||||||||||||
| 100 mg multiple oral doses qd | 9 | 1,118 (143) | 13.3 (4.8) | 6,056 (959) | 16.4 (2.16) | 304 (79.7) | |||||||
| 300 mg multiple oral doses qd | 9 | 3,379 (728) | 13.5 (3.2) | 19,252 (5,348) | 16.4 (3.60) | 319 (104) | |||||||
| T2DM Patientsb | |||||||||||||
| 100 mg multiple oral doses qd | 8 | 1,227 (481) | 13.7 (2.1) | 8,225 (1,947) | 13.0 (4.43) | 250 (50.7) | |||||||
| 300 mg multiple oral doses qd | 10 | 4,678 (1,685) | 14.9 (4.8) | 30,995 (11,146) | 11.3 (5.21) | 226 (89.4) | |||||||
a From Study DIA1030
b From Study DIA1023
Absorption
The mean absolute oral bioavailability of canagliflozin is approximately 65%. Co-administration of a high-fat meal with canagliflozin had no effect on the pharmacokinetics of canagliflozin; therefore, Sandoz Canagliflozin may be taken with or without food. However, based on the potential to reduce postprandial plasma glucose excursions due to delayed intestinal glucose absorption, it is recommended that Sandoz Canagliflozin preferably be taken before the first meal of the day (see 4.4 Administration).
Distribution
The mean steady-state volume of distribution of canagliflozin following a single intravenous infusion in healthy subjects was 83.5 L, suggesting extensive tissue distribution. Canagliflozin is extensively bound to proteins in plasma (99%), mainly to albumin. Protein binding is independent of canagliflozin plasma concentrations. Plasma protein binding is not meaningfully altered in patients with renal or hepatic impairment.
Metabolism
O-glucuronidation is the major metabolic elimination pathway for canagliflozin, which is mainly glucuronidated by UDP glucuronosyl transferase 1A9 (UGT1A9) and 2B4 (UGT2B4) to two inactive O-glucuronide metabolites. CYP3A4-mediated (oxidative) metabolism of canagliflozin is minimal (approximately 7%) in humans.
Elimination
Following administration of a single oral [14C] canagliflozin dose to healthy subjects, 41.5%, 7.0%, and 3.2% of the administered radioactive dose was recovered in faeces as canagliflozin, a hydroxylated metabolite, and an O-glucuronide metabolite, respectively. Enterohepatic circulation of canagliflozin was negligible.
Approximately 33% of the administered radioactive dose was excreted in urine, mainly as O-glucuronide metabolites (30.5%). Less than 1% of the dose was excreted as unchanged canagliflozin in urine. Renal clearance for the 100 mg and 300 mg doses ranged from 1.30 to 1.55 mL/min.
Canagliflozin is a low-clearance drug, with a mean systemic clearance of approximately 192 mL/min in healthy subjects following intravenous administration.
Special Populations and Conditions
Pediatrics: Based on the data submitted and reviewed by Health Canada, the safety and efficacy of canagliflozin in pediatric patients < 18 years of age have not been established; therefore, Health Canada has not authorized an indication for pediatric use (see 7.1.3 Pediatrics).
An open-label, sequential, multiple-dose, multicentre pediatric Phase 1 study examined the pharmacokinetics and pharmacodynamics of canagliflozin in children and adolescents ≥ 11 to < 18 years of age (mean age 14.6 years) with type 2 diabetes mellitus who were on a stable dose of metformin. The mean body weight was 107.15 kg (range: 48.5 to 168.6 kg).
The patients were treated with canagliflozin once-daily 100 mg or 300 mg for 14 days.
| Table 18: Mean (SD) Plasma Canagliflozin Pharmacokinetic Parameters on Day 14 | |||||||
|---|---|---|---|---|---|---|---|
| Parameters | Canagliflozin 100 mg QD (N=8) Mean (Std. Dev.) | Canagliflozin 300 mg QD (N=9) Mean (Std. Dev.) | |||||
| Cmax (ng/mL) | 951 (429) | 3,260 (1,330) | |||||
| AUC (h*ng/mL) | 6,190 (1,770) | 28,392 (12,412) | |||||
| t1/2 (h) | 11.3 (2.5) | 15.2 (6.9) | |||||
| CLss/F (L/h) | 17.5 (5.78) | 12.3 (6.90) | |||||
- Geriatrics: Age had no clinically meaningful effect on the pharmacokinetics of canagliflozin based on a population pharmacokinetic analysis. However, patients 65 years and older had a higher incidence of adverse reactions related to reduced intravascular volume with canagliflozin (see 4 DOSAGE AND ADMINISTRATION, 7.1.4 Geriatrics and 8 ADVERSE REACTIONS).
- Sex: Dose normalized exposures of canagliflozin in females were 22% higher than in males, based on population pharmacokinetic analysis. These increases in exposures are not clinically meaningful and hence no dosage adjustment of Sandoz Canagliflozin is necessary based on sex.
- Genetic Polymorphism: Both UGT1A9 and UGT2B4 are subject to genetic polymorphism. In a pooled analysis of clinical data, increases in canagliflozin AUC of 26% were observed in UGT1A9*1/*3 carriers and 18% in UGT2B4*2/*2 carriers. These increases in canagliflozin exposure are not expected to be clinically relevant and no dosage adjustment is necessary based on UGT1A9 and UGT2B4 genetic polymorphisms. The effect of being homozygote (UGT1A9*3/*3, frequency <0.1%) is probably more marked, but has not been investigated.
- Ethnic Origin: Dose normalized exposures of canagliflozin were comparable in white and non-white subjects, Blacks, Asians, and other ethnicities. A population PK analysis of canagliflozin in 942 white subjects and 674 non-white subjects showed no significant impact of ethnic origin on canagliflozin PK and hence no dosage adjustment of Sandoz Canagliflozin is necessary based on ethnic origin.
Hepatic Insufficiency: Relative to subjects with normal hepatic function, the geometric mean ratios for Cmax and AUC∞ of canagliflozin were 107% and 110%, respectively, in subjects with Child-Pugh class A (mild hepatic impairment) and 96% and 111%, respectively, in subjects with Child-Pugh class B (moderate hepatic impairment) following administration of a single 300 mg dose of canagliflozin.
These differences are not considered to be clinically meaningful. No dose adjustment is necessary in patients with mild or moderate hepatic impairment. There is no clinical experience in patients with Child-Pugh class C (severe) hepatic impairment and, therefore, Sandoz Canagliflozin is not recommended for use in this patient population.
Renal Insufficiency: A single-dose, open-label study evaluated the pharmacokinetics of canagliflozin 200 mg in subjects with varying degrees of renal impairment, classified using the Modification of Diet in Renal Disease (MDRD)-eGFR formula, compared to healthy subjects. The study included 3 subjects with normal renal function (eGFR ≥ 90 mL/min/1.73 m2), 10 subjects with mild renal impairment (eGFR 60 to < 90 mL/min/1.73 m2), 9 subjects with moderate renal impairment (eGFR 30 to < 60 mL/min/1.73 m2), and 10 subjects with severe renal impairment (eGFR 15 to < 30 mL/min/1.73 m2) as well as 8 subjects with end stage renal disease (ESRD) on hemodialysis.
The Cmax of canagliflozin was moderately increased by 13%, 29%, and 29% in subjects with mild, moderate, and severe renal failure, respectively, but not in subjects on hemodialysis. Compared to healthy subjects, plasma AUC of canagliflozin was increased by approximately 17%, 63%, and 50% in subjects with mild, moderate, and severe renal impairment, respectively, but was similar for ESRD subjects and healthy subjects. Increases in canagliflozin AUC of this magnitude are not considered clinically relevant, however, the pharmacodynamic response to canagliflozin declines with increasing severity of renal impairment (see 2 CONTRAINDICATIONS and 7 WARNINGS AND PRECAUTIONS). Canagliflozin was negligibly removed by hemodialysis.
- Body Weight: For subjects with body weight < 78.2 kg, the dose normalized exposures of canagliflozin increased by 33%, based on population pharmacokinetic analysis. These increases in exposures are not clinically meaningful and hence no dosage adjustment of Sandoz Canagliflozin is necessary based on body weight.
11 STORAGE, STABILITY AND DISPOSAL
Sandoz Canagliflozin tablets should be stored at 15-30°C. Patients should be instructed to talk to their pharmacist about any medications that have expired, or that they no longer use. Medications should not be disposed in wastewater or household waste.
12 SPECIAL HANDLING INSTRUCTIONS
Keep Sandoz Canagliflozin out of the sight and reach of children.
PART II: SCIENTIFIC INFORMATION
13 PHARMACEUTICAL INFORMATION
Drug Substance
Common name: canagliflozin
Chemical name: (1S)-1,5-anhydro-1-[3-[[5-(4-fluorophenyl)-2-thienyl]methyl]-4-methylphenyl]-D-glucitol hemihydrate
Molecular formula: C24H25FO5S. 1/2 H2O
Molecular mass: Hemihydrate: 453.53 g/mol
Structural formula:
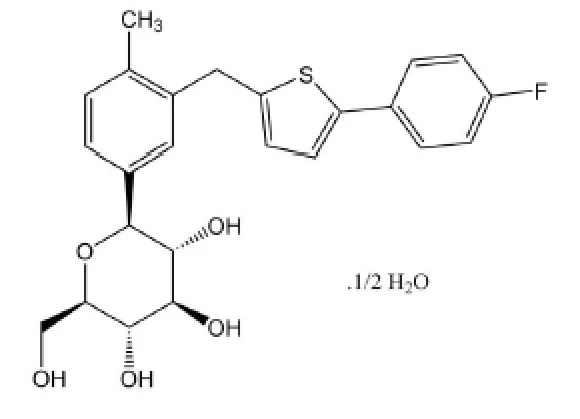
Physicochemical properties: Canagliflozin is practically insoluble in aqueous media from pH 1.1 to 12.9. There is no detectable pKa value for this substance.
14 CLINICAL TRIALS
14.1 Clinical Trials by Indication
Type 2 Diabetes Mellitus
| Table 19: Summary of Patient Demographics for Clinical Trials in Type 2 Diabetes Mellitus | |||||
| Table 19: Summary of Patient Demographics for Clinical Trials in Type 2 Diabetes Mellitus | |||||
| Table 19: Summary of Patient Demographics for Clinical Trials in Type 2 Diabetes Mellitus | |||||
| Study # | Study design | Dosage, route of administration and duration | Study subjects (n) | Mean age (Range) | Sex (% F/M) |
| Study # | Study design | Dosage, route of administration and duration | Study subjects (n) | Mean age (Range) | Sex (% F/M) |
| Study # | Study design | Dosage, route of administration and duration | Study subjects (n) | Mean age (Range) | Sex (% F/M) |
| Monotherapy | |||||
| DIA3005 | Randomized, double-blind, placebo-controlled, parallel-group, multicentre | Canagliflozin 100 or 300 mg/day or Placebo 26-week | Total: 584 Canagliflozin 100 mg: 195 Canagliflozin 300 mg: 197 Placebo: 192 | 55.4 (24-79) | 55.8/44.2 |
| Add-on Therapy with Metformin (≥ 1500 mg/day) | |||||
| DIA3006 | Randomized, double-blind, active-controlled, parallel-group, multicentre | Canagliflozin 100 or 300 mg/day or Sitagliptin 100 mg/day or Placebo 26-week | Total: 1284 Canagliflozin 100 mg: 368 Canagliflozin 300 mg: 367 Sitagliptin 100 mg: 366 Placebo: 183 | 55.4 (21-79) | 52.9/47.1 |
| DIA3009 | Randomized, double-blind, active-controlled, parallel-group, multicentre | Canagliflozin 100 or 300 mg/day or Glimepiride 1- 8 mg (titration protocol) 52-week | Total: 1450 Canagliflozin 100 mg: 483 Canagliflozin 300 mg: 485 Glimepiride: 482 | 56.2 (22-80) | 47.9/52.1 |
| Add-on Therapy with a Sulfonylurea (stable dose) | |||||
| DIA3008 SU Substudy | Randomized, double-blind, placebo-controlled, parallel-group, multicentre | Canagliflozin 100 or 300 mg/day or Placebo 18-week | Total: 127 Canagliflozin 100 mg: 42 Canagliflozin 300 mg: 40 Placebo: 45 | 64.8 (44-82) | 43.3/56.7 |
| Add-on Therapy with Metformin (≥ 1500 mg/day) and a Sulfonylurea (stable dose) | |||||
| DIA3002 | Randomized, double-blind, placebo-controlled, parallel-group, multicentre | Canagliflozin 100 or 300 mg/day or Placebo 26-week | Total: 469 Canagliflozin 100 mg: 157 Canagliflozin 300 mg: 156 Placebo: 156 | 56.8 (27-79) | 49.0/51.0 |
| DIA3015 | Randomized, double-blind, active-controlled, parallel-group, multicentre | Canagliflozin 300 mg/day or Sitagliptin 100 mg/day or Placebo 52-week | Total: 755 Canagliflozin 300 mg: 377 Sitagliptin 100 mg: 378 | 56.7 (21-91) | 44.1/55.9 |
| Add-on Therapy with Metformin (≥ 1500 mg/day) and Pioglitazone (30 or 45 mg/day) | |||||
| DIA3012 | Randomized, double-blind, placebo-controlled, parallel-group, multicentre | Canagliflozin 100 or 300 mg/day or Placebo 26-week | Total: 342 Canagliflozin 100 mg: 113 Canagliflozin 300 mg: 114 Placebo: 115 | 57.4 (27-78) | 36.8/63.2 |
| Add-on with Insulin (≥20 units/day) as monotherapy or in combination with other AHA(s)1 | |||||
| DIA3008 Insulin Substudy | Randomized, double-blind, placebo-controlled, parallel-group, multicentre | Canagliflozin 100 or 300 mg/day or Placebo 18-week | Total: 1718 Canagliflozin 100 mg: 566 Canagliflozin 300 mg: 587 Placebo: 565 | 62.8 (32-85) | 33.5/66.5 |
| Special Populations | |||||
DIA3010 (Older Adults) | Randomized, double-blind, placebo-controlled, parallel-group, Multicentre | Canagliflozin 100 or 300 mg/day + any AHA1 or Placebo + any AHA1 26-week | Total: 714 Canagliflozin 100 mg: 241 Canagliflozin 300 mg: 236 Placebo: 237 | 63.6 (55-80) | 44.5/55.5 |
DIA3004 (Renal Impairment ) | Randomized, double-blind, placebo-controlled, parallel-group, Multicentre | Canagliflozin 100 or 300 mg/day + any AHA1 or Placebo + any AHA1 26-week | Total: 269 Canagliflozin 100 mg: 90 Canagliflozin 300 mg: 89 Placebo: 90 | 68.5 (39-96) | 39.4/60.6 |
1 AHA = antihyperglycemic agent
A total of 10,285 patients with type 2 diabetes were randomized in nine double-blind, controlled clinical efficacy and safety studies conducted to evaluate the effects of canagliflozin on glycemic control. The racial distribution was 72% White, 16% Asian, 4% Black, and 8% other groups. Approximately 16% of patients were Hispanic. Approximately 58% of patients were male. Patients had an overall mean age of 59.6 years (range 21 to 96 years), with 3082 patients 65 years of age and older and 510 patients 75 years of age and older. One study was conducted in patients with moderate renal impairment with an eGFR 30 to <50 mL/min/1.73 m2 (N=269) and three other studies included patients with moderate renal impairment (eGFR 30 to <60 mL/min/1.73 m2) (N=816). Two other placebo-controlled studies investigated the use of canagliflozin, added onto the current diabetes treatment regimen, one in older patients, and one in patients with moderate renal impairment.
Study Results
In patients with type 2 diabetes, treatment with canagliflozin produced statistically significant improvements in HbA1c, fasting plasma glucose (FPG), 2-hour postprandial glucose (PPG), and body weight, compared to placebo. Canagliflozin was effective in reducing HbA1c in a broad range of patients regardless of disease duration and concomitant use of antihyperglycemic agents. The durability of these reductions in HbA1c was demonstrated in two Phase 3 studies, with minimal attenuation of the glycemic response to canagliflozin over 52 weeks, in contrast to the deterioration of the glycemic response observed with comparators.
Statistically significant improvements in glycemic control relative to placebo were observed with canagliflozin when given as monotherapy, as-add on therapy with metformin or a sulfonylurea, metformin and a sulfonylurea, metformin and pioglitazone or as add-on therapy with insulin (with or without other antihyperglycemic agents).
In addition, significant improvements in HbA1c were observed with canagliflozin in subjects with moderate renal impairment (eGFR 30 to < 60 mL/min/1.73 m2) and in older patients. Reductions in HbA1c were observed across subgroups including age, sex, race, baseline body mass index (BMI), and baseline beta-cell function. Greater reductions in HbA1c relative to placebo were observed in patients with higher baseline HbA1c or eGFR values.
Monotherapy (Study DIA3005)
A total of 584 patients with inadequate glycemic control (HbA1c of ≥7% to ≤10%) on diet and exercise participated in a randomized, double-blind, placebo-controlled, parallel-group, 3-arm, multicentre clinical study to evaluate the efficacy of canagliflozin over 26 weeks. The mean age was 55 years, 44% of patients were men, and the mean baseline eGFR was 87 mL/min/1.73 m2. Patients taking other antihyperglycemic agents (N=281) discontinued the agent and underwent a drug washout period of approximately 8 weeks immediately followed by a 2-week, single-blind, placebo run-in period. Patients not taking an oral antihyperglycemic agent (off therapy for at least 8 weeks) (N=303) with inadequate glycemic control entered a 2-week, single-blind, placebo run-in period. Patients were randomized to take canagliflozin 100 mg, canagliflozin 300 mg, or placebo, administered once daily. As shown in Table 20, statistically significant (p<0.001) reductions in HbA1c, FPG, PPG, and body weight relative to placebo were observed. In addition, a greater percentage of patients achieved an HbA1c <7.0% compared to placebo. Statistically significant (p<0.001) reductions in systolic blood pressure were observed with canagliflozin 100 mg and 300 mg relative to placebo of -3.7 mmHg and -5.4 mmHg, respectively.
Patients who were not eligible for inclusion in the main placebo-controlled study due to more severe hyperglycemia (HbA1c >10 and ≤ 12%) participated in a separate active-treatment substudy (N=91) and were treated with either canagliflozin 100 mg or canagliflozin 300 mg (see Table 20).
| Table 20: Results from 26-Week Placebo-Controlled Clinical Study with Canagliflozin as Monotherapy1 | |||||||||||
|---|---|---|---|---|---|---|---|---|---|---|---|
| Table 20: Results from 26-Week Placebo-Controlled Clinical Study with Canagliflozin as Monotherapy1 | |||||||||||
| Efficacy Parameter | Canagliflozin 100 mg (N=195) | Canagliflozin 300 mg (N=197) | Placebo (N=192) | ||||||||
| Efficacy Parameter | Canagliflozin 100 mg (N=195) | Canagliflozin 300 mg (N=197) | Placebo (N=192) | ||||||||
| HbA1c (%) | |||||||||||
| Baseline (mean) | 8.06 | 8.01 | 7.97 | ||||||||
| Change from baseline (adjusted mean) | -0.77 | -1.03 | 0.14 | ||||||||
| Difference from placebo (adjusted mean) (95% CI) | -0.912 (-1.09; -0.73) | -1.162 (-1.34; -0.99) | N/A3 | ||||||||
| Percent of Patients Achieving HbA1c <7% | 44.52 | 62.42 | 20.6 | ||||||||
| Fasting Plasma Glucose (mmol/L) | |||||||||||
| Baseline (mean) | 9.57 | 9.57 | 9.20 | ||||||||
| Change from baseline (adjusted mean) | -1.51 | -1.94 | 0.46 | ||||||||
| Difference from placebo (adjusted mean) (95% CI) | -1.972 (-2.34; -1.60) | -2.412 (-2.78; -2.03) | N/A3 | ||||||||
| 2-hour Postprandial Glucose (mmol/L) | |||||||||||
| Baseline (mean) | 13.87 | 14.10 | 12.74 | ||||||||
| Change from baseline (adjusted mean) | -2.38 | -3.27 | 0.29 | ||||||||
| Difference from placebo (adjusted mean) (95% CI) | -2.672 (-3.28; -2.05) | -3.552 (-4.17; -2.94) | N/A3 | ||||||||
| Body Weight | |||||||||||
| Baseline (mean) in kg | 85.9 | 86.9 | 87.5 | ||||||||
| % change from baseline (adjusted mean) | -2.8 | -3.9 | -0.6 | ||||||||
| Difference from placebo (adjusted mean) (95% CI) | -2.22 (-2.9; -1.6) | -3.32 (-4.0; -2.6) | N/A3 | ||||||||
| Separate Active-Treatment Substudy of Patients with High Baseline HbA1c Levels (>10 to ≤12%) | |||||||||||
| Efficacy Parameter | Canagliflozin 100 mg (N=47) | Canagliflozin 300 mg (N=44) | |||||||||
| HbA1c (%) | |||||||||||
| Baseline (mean) | 10.59 | 10.62 | |||||||||
| Change from baseline (adjusted mean) | -2.13 | -2.56 | |||||||||
| Percent of Patients Achieving HbA1c <7% | 17.4 | 11.6 | |||||||||
| Fasting Plasma Glucose (mmol/L) | |||||||||||
| Baseline (mean) | 13.18 | 13.50 | |||||||||
| Change from baseline (adjusted mean) | -4.54 | -4.79 | |||||||||
| 2-hour Postprandial Glucose (mmol/L) | |||||||||||
| Baseline (mean) | 18.34 | 19.68 | |||||||||
| Change from baseline (adjusted mean) | -6.58 | -6.98 | |||||||||
| Body Weight | |||||||||||
| Baseline (mean) in kg | 83.2 | 81.6 | |||||||||
| % change from baseline (adjusted mean) | -3.0 | -3.8 | |||||||||
1 Intent-to-treat population using last observation in study prior to glycemic rescue therapy
2 p<0.001 compared to placebo
3 N/A = Not applicable
Add-on Therapy with Metformin (Study DIA3006)
A total of 1284 patients with inadequate glycemic control (HbA1c of ≥ 7% to ≤ 10.5%) on metformin monotherapy (2,000 mg/day or at least 1,500 mg/day if higher dose not tolerated) participated in a randomized, double-blind, placebo- and active-controlled, parallel-group, 4-arm, multicentre clinical study to evaluate the efficacy of canagliflozin as add-on therapy with metformin over 26 weeks. The mean age was 55 years, 47% of patients were men, and the mean baseline eGFR was 89 mL/min/1.73 m2. Patients already on metformin (N=1009) at screening with inadequate glycemic control completed a 2-week, single-blind, placebo run-in period. Other patients on metformin and another oral agent or a lower than required dose of metformin (N=275) were switched to a regimen of metformin monotherapy. After at least 8 weeks on a stable dose of metformin monotherapy, patients entered a 2-week, single-blind, placebo run-in period. Patients were randomized to the addition of canagliflozin 100 mg, canagliflozin 300 mg, sitagliptin 100 mg, or placebo, administered once daily.
As shown in Table 21, statistically significant (p<0.001) reductions in HbA1c, FPG, PPG, and body weight relative to placebo were observed. In addition, a greater percentage of patients achieved an HbA1c < 7.0% compared to placebo. Statistically significant (p<0.001) reductions in systolic blood pressure were observed with canagliflozin 100 mg and 300 mg relative to placebo of -5.4 mmHg and -6.6 mmHg, respectively.
| Table 21: Results from Placebo-Controlled Clinical Study of Canagliflozin as Add-on Therapy with Metformin1 | |||||||||||
|---|---|---|---|---|---|---|---|---|---|---|---|
| Efficacy Parameter | Canagliflozin+ Metformin 26 weeks | Placebo + Metformin (N=183) | |||||||||
100 mg (N=368) | 300 mg (N=367) | ||||||||||
| HbA1c (%) | |||||||||||
| Baseline (mean) | 7.94 | 7.95 | 7.96 | ||||||||
| Change from baseline (adjusted mean) | -0.79 | -0.94 | -0.17 | ||||||||
| Difference from placebo (adjusted mean) (95% CI) | -0.622 (-0.76; -0.48) | -0.772 (-0.91; -0.64) | N/A3 | ||||||||
| Percent of patients achieving HbA1c < 7% | 45.52 | 57.82 | 29.8 | ||||||||
| Fasting Plasma Glucose (mmol/L) | |||||||||||
| Baseline (mean) | 9.36 | 9.59 | 9.12 | ||||||||
| Change from baseline (adjusted mean) | -1.52 | -2.10 | 0.14 | ||||||||
| Difference from placebo (adjusted mean) (95% CI) | -1.652 (-1.99; -1.32) | -2.232 (-2.57; -1.90) | N/A3 | ||||||||
| 2-hour Postprandial Glucose (mmol/L) | |||||||||||
| Baseline (mean) | 14.30 | 14.54 | 13.81 | ||||||||
| Change from baseline (adjusted mean) | -2.66 | -3.17 | -0.55 | ||||||||
| Difference from placebo (adjusted mean) (95% CI) | -2.122 (-2.73; -1.51) | -2.622 (-3.24; -2.01) | N/A3 | ||||||||
| Body Weight | |||||||||||
| Baseline (mean) in kg | 88.7 | 85.4 | 86.7 | ||||||||
| % change from baseline (adjusted mean) | -3.7 | -4.2 | -1.2 | ||||||||
| Difference from placebo (adjusted mean) (95% CI) | -2.52 (-3.1; -1.9) | -2.92 (-3.5; -2.3) | N/A3 | ||||||||
1 Intent-to-treat population using last observation in study prior to glycemic rescue therapy
2 p<0.001 compared to placebo
3 N/A = Not applicable
Active-Controlled Study versus Glimepiride as add-on therapy with Metformin (Study DIA3009)
A total of 1450 patients with inadequate glycemic control (HbA1c level of ≥ 7% to ≤ 9.5%) on metformin monotherapy (≥ 2,000 mg/day or at least 1,500 mg/day if higher dose not tolerated) participated in a randomized, double-blind, active-controlled, parallel-group, 3-arm, multicentre clinical study to evaluate the efficacy of canagliflozin as add-on therapy with metformin over 52 weeks. The mean age was 56 years, 52% of patients were men, and the mean baseline eGFR was 90 mL/min/1.73 m2. Patients on metformin (N=928) at a stable protocol-specified dose entered a 2-week, single-blind, placebo run-in period. Other patients (N=522) entered a metformin dose titration and dose stabilization/antihyperglycemic agent washout period, immediately followed by the 2-week run-in period. Following the run-in period, patients with inadequate glycemic control were randomized to the addition of canagliflozin 100 mg, canagliflozin 300 mg, or glimepiride (titration allowed throughout the 52-week study to 6 to 8 mg), administered once daily.
As shown in Table 22 and Figure 4, after 52 weeks, treatment with canagliflozin 100 mg provided similar reductions in HbA1c from baseline compared to glimepiride (with the upper bound of the 95% confidence interval around the between-group difference less than the pre-specified non-inferiority margin of 0.3%); canagliflozin 300 mg provided a superior (p<0.05) reduction from baseline in HbA1c compared to glimepiride (with the upper bound of the 95% confidence interval below 0). Statistically significant (p<0.001) reductions in body weight were observed with canagliflozin compared to glimepiride. Reductions in systolic blood pressure were observed with canagliflozin 100 mg and 300 mg relative to glimepiride of -3.5 mmHg and -4.8 mmHg, respectively. The incidence of hypoglycemia with canagliflozin was significantly lower (p<0.001) compared to glimepiride.
| Table 22: Results from 52-Week Clinical Study Comparing Canagliflozin to Glimepiride as Add-on Therapy with Metformin1 | ||||||||||||
|---|---|---|---|---|---|---|---|---|---|---|---|---|
| Table 22: Results from 52-Week Clinical Study Comparing Canagliflozin to Glimepiride as Add-on Therapy with Metformin1 | ||||||||||||
| Efficacy Parameter | Canagliflozin + Metformin 52 Weeks | Glimepiride (titrated) + Metformin (N=482) | ||||||||||
| Efficacy Parameter | Canagliflozin + Metformin 52 Weeks | Glimepiride (titrated) + Metformin (N=482) | ||||||||||
100 mg (N=483) | 300 mg (N=485) | |||||||||||
100 mg (N=483) | 300 mg (N=485) | |||||||||||
| HbA1c (%) | ||||||||||||
| Baseline (mean) | 7.78 | 7.79 | 7.83 | |||||||||
| Change from baseline (adjusted mean) | -0.82 | -0.93 | -0.81 | |||||||||
| Difference from glimepiride (adjusted mean) (95% CI) | -0.012 (-0.11; 0.09) | -0.122 (-0.22; -0.02) | N/A3 | |||||||||
| Percent of patients achieving HbA1c < 7% | 53.6 | 60.1 | 55.8 | |||||||||
| Fasting Plasma Glucose (mmol/L) | ||||||||||||
| Baseline (mean) | 9.18 | 9.09 | 9.20 | |||||||||
| Change from baseline (adjusted mean) | -1.35 | -1.52 | -1.02 | |||||||||
| Difference from glimepiride (adjusted mean) (95% CI) | -0.33 (-0.56; -0.11) | -0.51 (-0.73; -0.28) | N/A3 | |||||||||
| Body Weight | ||||||||||||
| Baseline (mean) in kg | 86.8 | 86.6 | 86.6 | |||||||||
| % change from baseline (adjusted mean) | -4.2 | -4.7 | 1.0 | |||||||||
| Difference from glimepiride (adjusted mean) (95% CI) | -5.24 (-5.7; -4.7) | -5.74 (-6.2; -5.1) | N/A3 | |||||||||
1 Intent-to-treat population using last observation in study prior to glycemic rescue therapy
2 Met pre-specified criteria for non-inferiority to glimepiride (with the upper bound of the 95% CI around the between-group difference less than the pre-specified non-inferiority margin of <0.3%). In a pre-specified assessment, the upper bound of the 95% CI for canagliflozin 300 mg, but not for canagliflozin 100 mg was < 0, indicating a superior (p<0.05) reduction in HbA1c relative to glimepiride with canagliflozin 300 mg.
3 N/A = Not applicable
4 p<0.001
5 Includes only patients who had both baseline and post-baseline values
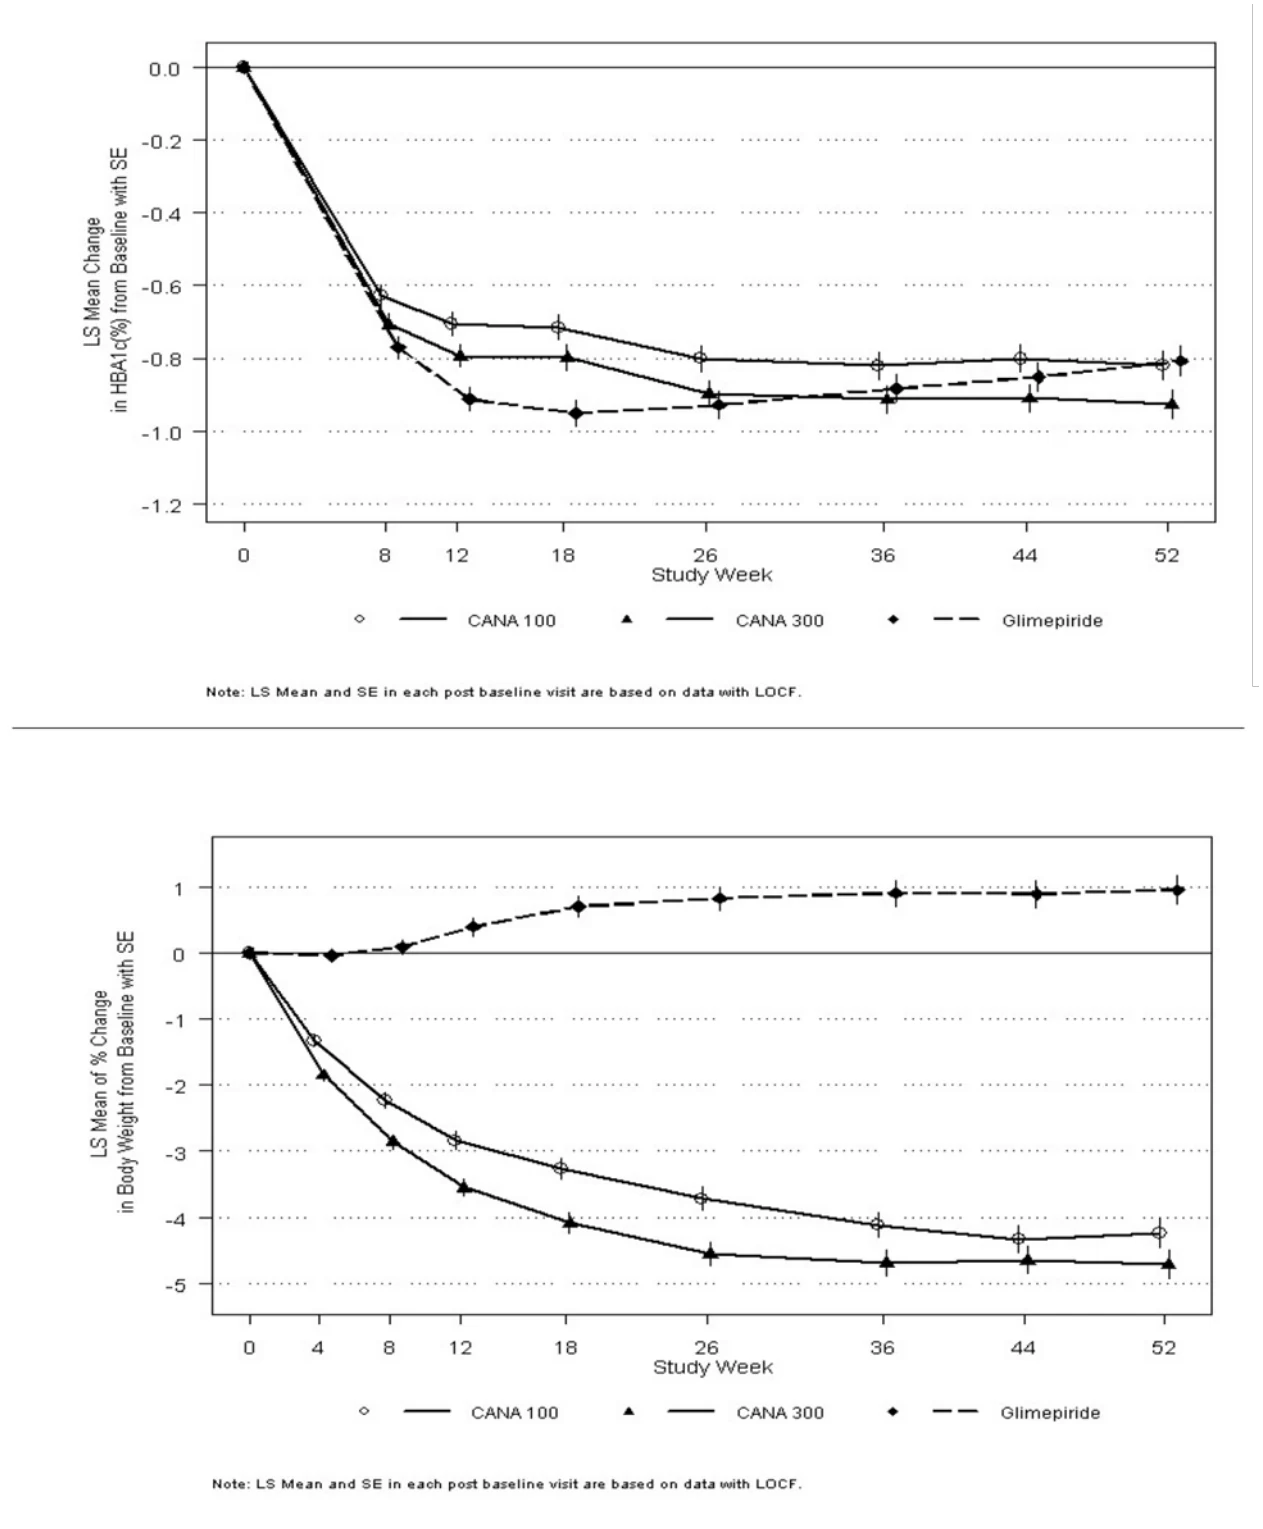
Figure 4: Mean Changes from Baseline for HbA1c (%) and Body Weight Over 52 Weeks in a Study Comparing Canagliflozin to Glimepiride as Add-on Therapy with Metformin
Add-on Therapy with Sulfonylurea (DIA3008 Substudy)
A total of 127 patients with inadequate glycemic control (HbA1c of ≥7% to ≤10.5%) on sulfonylurea monotherapy participated in a randomized, double-blind, placebo-controlled, parallel-group, 3-arm, multicentre substudy of a cardiovascular outcomes study to evaluate the efficacy of canagliflozin as add-on therapy with sulfonylurea over 18 weeks. The mean age was 65 years, 57% of patients were men, and the mean baseline eGFR was 69 mL/min/1.73 m2. Patients on sulfonylurea monotherapy at a stable protocol-specified dose (≥ 50% maximal dose) for at least 10 weeks completed a 2-week, single-blind, placebo run-in period. After the run-in period, patients with inadequate glycemic control were randomized to the addition of canagliflozin 100 mg, canagliflozin 300 mg, or placebo, administered once daily.
As shown in Table 23, statistically significant (p<0.001) reductions in HbA1c and FPG relative to placebo were observed at Week 18. In addition, a greater percentage of patients achieved an HbA1c <7.0% compared to placebo. Patients treated with canagliflozin 300 mg exhibited reductions in body weight compared to placebo. Reductions in systolic blood pressure were observed with canagliflozin 100 mg and 300 mg relative to placebo of -0.1 mmHg and -1.8 mmHg, respectively. An increased incidence of hypoglycemia was observed in this study (see 7 WARNINGS AND PRECAUTIONS and 8 ADVERSE REACTIONS).
| Table 23: Results from Placebo-Controlled Clinical Study of Canagliflozin as Add-on Therapy with a Sulfonylurea1 | ||||||||||||
|---|---|---|---|---|---|---|---|---|---|---|---|---|
| Efficacy Parameter | Canagliflozin + Sulfonylurea 18 weeks | Placebo + Sulfonylurea (N=45) | ||||||||||
100 mg (N=42) | 300 mg (N=40) | |||||||||||
| HbA1c (%) | ||||||||||||
| Baseline (mean) | 8.29 | 8.28 | 8.49 | |||||||||
| Change from baseline (adjusted mean) | -0.70 | -0.79 | 0.04 | |||||||||
| Difference from placebo (adjusted mean) (95% CI) | -0.742 (-1.15; -0.33) | -0.832 (-1.24; -0.41) | N/A4 | |||||||||
| Percent of patients achieving HbA1c < 7% | 25.0 | 33.33 | 5.0 | |||||||||
| Fasting Plasma Glucose (mmol/L) | ||||||||||||
| Baseline (mean) | 10.29 | 9.84 | 10.27 | |||||||||
| Change from baseline (adjusted mean) | -1.41 | -2.00 | 0.67 | |||||||||
| Difference from placebo (adjusted mean) (95% CI) | -2.07 (-2.99; -1.15) | -2.662 (-3.59; -1.74) | N/A4 | |||||||||
| Body Weight | ||||||||||||
| Baseline (mean) in kg | 85.1 | 80.4 | 85.5 | |||||||||
| % change from baseline (adjusted mean) | -0.6 | -2.0 | -0.2 | |||||||||
| Difference from placebo (adjusted mean) (95% CI) | -0.4 (-1.8; 1.0) | -1.83 (-3.2; -0.4) | N/A4 | |||||||||
1 Intent-to-treat population using last observation in study prior to glycemic rescue therapy
2 p<0.001 compared to placebo
3 p<0.025 compared to placebo
4 N/A = Not applicable
Add-on Therapy with Metformin and Sulfonylurea (Study DIA3002)
A total of 469 patients with inadequate glycemic control (HbA1c level of ≥7% to ≤10.5%) on the combination of metformin (2,000 mg/day or at least 1,500 mg/day if higher dose not tolerated) and sulfonylurea (maximal or near-maximal effective dose) participated in a randomized, double-blind, placebo-controlled, parallel-group, 3-arm, multicentre clinical study to evaluate the efficacy of canagliflozin as add-on therapy with metformin and sulfonylurea over 26 weeks. The mean age was 57 years, 51% of patients were men, and the mean baseline eGFR was 89 mL/min/1.73 m2. Patients on near-maximal or maximal effective doses of metformin and sulfonylurea (N=372) entered a 2-week, single-blind, placebo run-in period. Other patients (N=97) entered a metformin and sulfonylurea dose titration and dose stabilization/antihyperglycemic agent washout period of up to 12 weeks, immediately followed by the 2-week run-in period. Following the run-in period, patients with inadequate glycemic control were randomized to the addition of canagliflozin 100 mg, canagliflozin 300 mg, or placebo administered once daily.
As shown in Table 24, statistically significant (p<0.001) reductions in HbA1c, FPG, and body weight relative to placebo were observed. In addition, a greater percentage of patients achieved an HbA1c <7.0% compared to placebo. Reductions in systolic blood pressure were observed with canagliflozin 100 mg and 300 mg relative to placebo of -2.2 mmHg and -1.6 mmHg, respectively. An increased incidence of hypoglycemia was observed in this study (see 7 WARNINGS AND PRECAUTIONS and 8 ADVERSE REACTIONS).
| Table 24: Results from 26-Week Placebo-Controlled Clinical Study of Canagliflozin as Add-on Therapy with Metformin and Sulfonylurea1 | |||||||||||
|---|---|---|---|---|---|---|---|---|---|---|---|
| Table 24: Results from 26-Week Placebo-Controlled Clinical Study of Canagliflozin as Add-on Therapy with Metformin and Sulfonylurea1 | |||||||||||
| Efficacy Parameter | Canagliflozin + Metformin and Sulfonylurea 26 Weeks | Placebo + Metformin and Sulfonylurea (N=156) | |||||||||
| Efficacy Parameter | Canagliflozin + Metformin and Sulfonylurea 26 Weeks | Placebo + Metformin and Sulfonylurea (N=156) | |||||||||
100 mg (N=157) | 300 mg (N=156) | ||||||||||
100 mg (N=157) | 300 mg (N=156) | ||||||||||
| HbA1c (%) | |||||||||||
| Baseline (mean) | 8.13 | 8.13 | 8.12 | ||||||||
| Change from baseline (adjusted mean) | -0.85 | -1.06 | -0.13 | ||||||||
| Difference from placebo (adjusted mean) (95% CI) | -0.712 (-0.90; -0.52) | -0.922 (-1.11; -0.73) | N/A3 | ||||||||
| Percent of patients achieving HbA1c < 7% | 43.22 | 56.62 | 18.0 | ||||||||
| Fasting Plasma Glucose (mmol/L) | |||||||||||
| Baseline (mean) | 9.60 | 9.34 | 9.42 | ||||||||
| Change from baseline (adjusted mean) | -1.01 | -1.69 | 0.23 | ||||||||
| Difference from placebo (adjusted mean) (95% CI) | -1.242 (-1.75; -0.73) | -1.922 (-2.43; -1.41) | N/A3 | ||||||||
| Body Weight | |||||||||||
| Baseline (mean) in kg | 93.5 | 93.5 | 90.8 | ||||||||
| % change from baseline (adjusted mean) | -2.1 | -2.6 | -0.7 | ||||||||
| Difference from placebo (adjusted mean) | -1.42 | -2.02 | N/A3 | ||||||||
| (95% CI) | (-2.1; -0.7) | (-2.7; -1.3) | |||||||||
1 Intent-to-treat population using last observation in study prior to glycemic rescue therapy
2 p<0.001 compared to placebo
3 N/A = Not applicable or not measured in this study
Active-Controlled Study versus Sitagliptin as Add-on Therapy with Metformin and Sulfonylurea (Study DIA3015)
A total of 755 patients with inadequate glycemic control (HbA1c level of ≥ 7.0% to ≤ 10.5%) on the combination of metformin (2,000 mg/day or at least 1,500 mg/day if higher dose not tolerated) and sulfonylurea (near-maximal or maximal effective dose) participated in a double-blind, active-controlled, parallel-group, 2-arm, multicentre clinical study to evaluate the efficacy of canagliflozin 300 mg as add-on therapy with metformin and sulfonylurea versus sitagliptin 100 mg as add-on therapy with metformin and sulfonylurea over 52 weeks. The mean age was 57 years, 56% of patients were men, and the mean baseline eGFR was 88 mL/min/1.73 m2. Patients on near-maximal or maximal effective doses of metformin and sulfonylurea (N=716) entered a 2-week single-blind, placebo run-in period. Other patients (N=39) entered a metformin and sulfonylurea dose titration and dose stabilization period of up to 12 weeks, immediately followed by the 2-week run-in period. Following the run-in period, patients with inadequate glycemic control were randomized to the addition of canagliflozin 300 mg or sitagliptin 100 mg.
As shown in Table 25 and Figure 5 after 52 weeks, canagliflozin 300 mg provided a superior (p<0.05) reduction in HbA1c compared to sitagliptin 100 mg (with the upper bound of the 95% confidence interval around the between-group difference below 0). In addition, a greater percent of patients achieved an HbA1c of <7.0% with canagliflozin 300 mg relative to sitagliptin: 47.6% of patients receiving canagliflozin 300 mg and 35.3% of patients receiving sitagliptin. Patients treated with canagliflozin 300 mg exhibited a significant mean decrease in percent change from baseline body weight compared to patients administered sitagliptin 100 mg. A statistically significant (p<0.001) reduction in systolic blood pressure was observed with canagliflozin 300 mg of -5.9 mmHg relative to sitagliptin. A similar increased incidence of hypoglycemia was observed with both canagliflozin 300 mg and sitagliptin in this study, consistent with the expected increase of hypoglycemia when agents not associated with hypoglycemia are added to sulfonylurea (see 7 WARNINGS AND PRECAUTIONS and 8 ADVERSE REACTIONS). The proportion of patients who met glycemic withdrawal criteria (based on FPG until Week 26 and HbA1c thereafter) was lower with canagliflozin 300 mg (10.6%) compared with sitagliptin 100 mg (22.5%).
| Table 25: Results from 52-Week Clinical Study Comparing Canagliflozin to Sitagliptin as Add-on Therapy with Metformin and Sulfonylurea1 | ||||||||
|---|---|---|---|---|---|---|---|---|
| Efficacy Parameter | Canagliflozin 300 mg + Metformin and Sulfonylurea (N=377) | Sitagliptin 100 mg + Metformin and Sulfonylurea (N=378) | ||||||
| HbA1c (%) | ||||||||
| Baseline (mean) | 8.12 | 8.13 | ||||||
| Change from baseline (adjusted mean) | -1.03 | -0.66 | ||||||
| Difference from sitagliptin (adjusted mean) (95% CI) | -0.372 (-0.50; -0.25) | N/A4 | ||||||
| Percent of patients achieving HbA1c <7% | 47.6 | 35.3 | ||||||
| Fasting Plasma Glucose (mmol/L) | ||||||||
| Baseline (mean) | 9.42 | 9.09 | ||||||
| Change from baseline (adjusted mean) | -1.66 | -0.32 | ||||||
| Difference from sitagliptin (adjusted mean) (95% CI) | -1.34 (-1.66; -1.01) | N/A4 | ||||||
| Body Weight | ||||||||
| Baseline (mean) in kg | 87.6 | 89.6 | ||||||
| % change from baseline (adjusted mean) | -2.5 | 0.3 | ||||||
| Difference from sitagliptin (adjusted mean) (95% CI) | -2.83 (-3.3; -2.2) | N/A4 | ||||||
1 Intent-to-treat population using last observation in study prior to glycemic rescue therapy
2 Met pre-specified criteria for non-inferiority to sitagliptin (with the upper bound of the 95% CI around the between-group difference less than the pre-specified non-inferiority margin of <0.3%); in a pre-specified assessment, the upper bound of the 95% CI for canagliflozin 300 mg was <0, indicating a superior (p<0.05) reduction in HbA1c relative to sitagliptin with canagliflozin 300 mg.
3 p<0.001
4 N/A = Not applicable
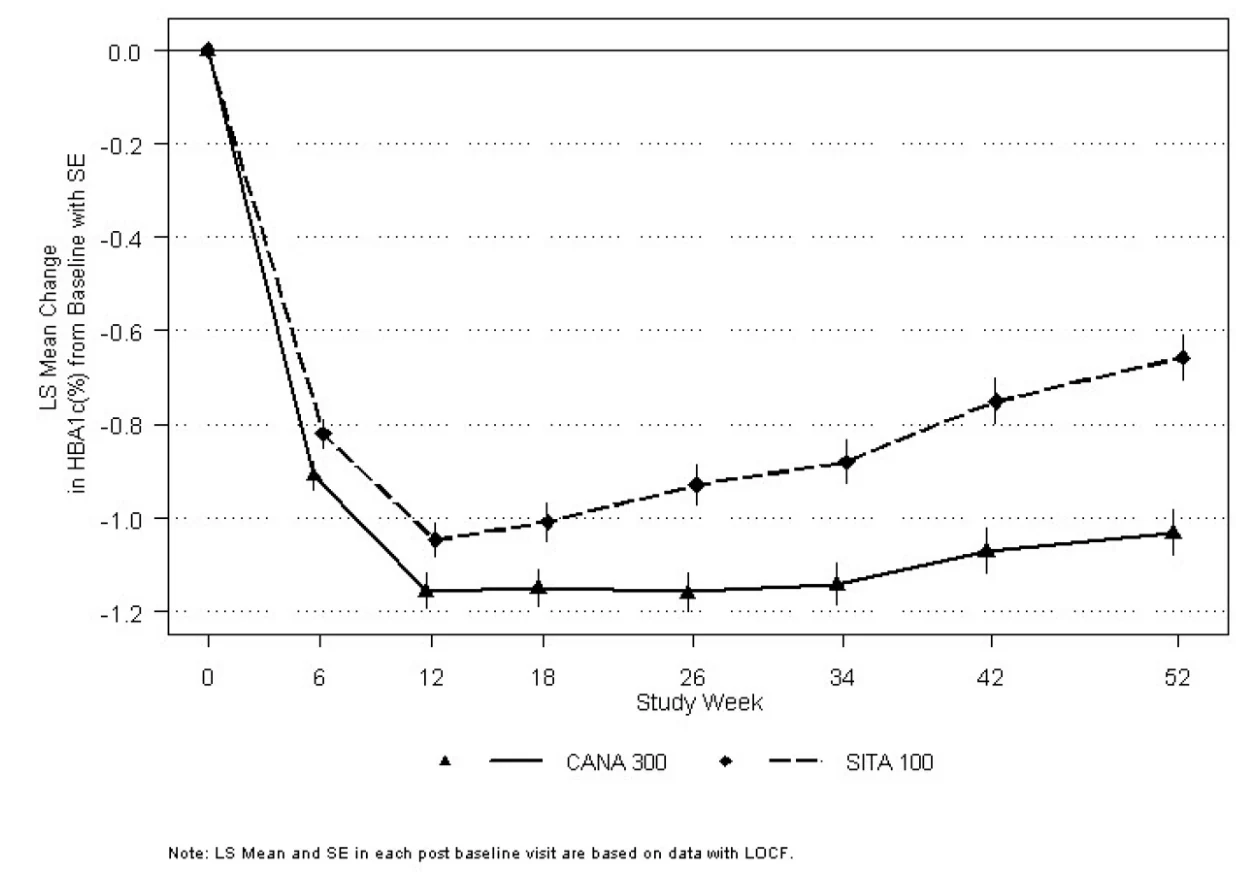
Figure 5: Mean Change from Baseline for HbA1c (%) Over 52 Weeks in a Study Comparing Canagliflozin to Sitagliptin as Add-on Therapy with Metformin and Sulfonylurea
Add-on Therapy with Metformin and Pioglitazone (Study DIA3012)
A total of 342 patients with inadequate glycemic control (HbA1c level of ≥7.0% to ≤10.5%) on the combination of metformin (2,000 mg/day or at least 1,500 mg/day if higher dose not tolerated) and pioglitazone (30 or 45 mg/day) participated in a randomized, double-blind, placebo-controlled, parallel-group, 3-arm, multicentre clinical study to evaluate the efficacy of canagliflozin as add-on therapy with metformin and pioglitazone over 26 weeks. The mean age was 57 years, 63% of patients were men, and the mean baseline eGFR was 86 mL/min/1.73 m2. Patients already on protocol-specified doses of metformin and pioglitazone (N=163) entered a 2-week, single-blind, placebo run-in period. Other patients (N=181) entered a metformin and pioglitazone dose titration and dose stabilization period for up to 12 weeks with at least 8 weeks on stable doses of metformin and pioglitazone, immediately followed by the 2-week run-in period. Following the run-in period, patients with inadequate glycemic control were randomized (N=344) to the addition of canagliflozin 100 mg, canagliflozin 300 mg, or placebo, administered once daily.
As shown in Table 26, statistically significant (p<0.001) reductions in HbA1c, baseline FPG, and body weight relative to placebo were observed for canagliflozin at Week 26. In addition, a greater percent of patients achieved an HbA1c of <7.0% compared to placebo. Statistically significant reductions in systolic blood pressure were observed with canagliflozin 100 mg and 300 mg relative to placebo of -4.1 mmHg (p=0.005) and -3.5 mmHg (p=0.016), respectively.
| Table 26: Results from 26-Week Placebo-Controlled Clinical Study of Canagliflozin as Add-on Therapy with Metformin and Pioglitazone1 | ||||||||||||
|---|---|---|---|---|---|---|---|---|---|---|---|---|
| Efficacy Parameter | Canagliflozin + Metformin and Pioglitazone 26 Weeks | Placebo + Metformin and Pioglitazone (N=115) | ||||||||||
100 mg (N=113) | 300 mg (N=114) | |||||||||||
| HbA1c (%) | ||||||||||||
| Baseline (mean) | 7.99 | 7.84 | 8.00 | |||||||||
| Change from baseline (adjusted mean) | -0.89 | -1.03 | -0.26 | |||||||||
| Difference from placebo (adjusted mean) (95% CI) | -0.622 (-0.81; -0.44) | -0.762 (-0.95; -0.58) | N/A3 | |||||||||
| Percent of patients achieving HbA1c < 7% | 46.92 | 64.32 | 32.5 | |||||||||
| Fasting Plasma Glucose (mmol/L) | ||||||||||||
| Baseline (mean) | 9.38 | 9.11 | 9.13 | |||||||||
| Change from baseline (adjusted mean) | -1.49 | -1.84 | 0.14 | |||||||||
| Difference from placebo (adjusted mean) (95% CI) | -1.632 (-2.05; -1.21) | -1.982 (-2.41; -1.56) | N/A3 | |||||||||
| Body Weight | ||||||||||||
| Baseline (mean) in kg | 94.2 | 94.4 | 94 | |||||||||
| % change from baseline (adjusted mean) | -2.8 | -3.8 | -0.1 | |||||||||
| Difference from placebo (adjusted mean) (95% CI) | -2.72 (-3.6; -1.8) | -3.72 (-4.6; -2.8) | N/A3 | |||||||||
1 Intent-to-treat population using last observation in study prior to glycemic rescue therapy
2 p<0.001 compared to placebo
3 N/A = Not applicable or not measured in this study
Add-on Therapy with Insulin (with or without Metformin) (Derived from DIA3008 substudy)
A total of 1718 patients with inadequate glycemic control (HbA1c level of ≥7.0 to ≤10.5%) on insulin ≥30 units/day or insulin add-on therapy with other antihyperglycemic agents participated in a randomized, double-blind, placebo-controlled, parallel-group, 3-arm, multicentre substudy of a cardiovascular outcomes study; this substudy evaluated the efficacy of canagliflozin as add-on therapy with insulin over 18 weeks. The mean age was 63 years, 66% of patients were men, and the mean baseline eGFR was 75 mL/min/1.73 m2. Patients on basal, bolus, or basal/bolus insulin, with the majority on a background basal/bolus insulin regimen, for at least 10 weeks entered a 2-week, single-blind, placebo run-in period. After the run-in period, patients with inadequate glycemic control were randomized to the addition of canagliflozin 100 mg, canagliflozin 300 mg, or placebo, administered once daily. The mean daily insulin dose at baseline was 83 units, which was similar across treatment groups.
Patients were stratified by (a) insulin monotherapy, (b) insulin and metformin only therapy, and (c) insulin and other antihyperglycemic agent therapy. Corresponding to approved indications, Table 27 and Table 28 show statistically significant (p<0.001) reductions in HbA1c, FPG, and body weight relative to placebo were observed for canagliflozin at Week 18 in patients both on an insulin monotherapy and insulin+metformin background. In addition, a greater percentage of patients achieved an HbA1c <7.0% compared to placebo. In the insulin monotherapy stratum, reductions in systolic blood pressure were observed with canagliflozin 100 mg and 300 mg relative to placebo of -2.9 mmHg (p=0.027) and -4.2 mmHg (p=0.001), respectively. In the insulin and metformin only stratum, reductions in systolic blood pressure were observed with canagliflozin 100 mg and 300 mg relative to placebo of -2.9 mmHg (p=0.011) and -4.8 mmHg (p<0.001), respectively. An increased incidence of hypoglycemia was observed in this study (see 4 DOSAGE AND ADMINISTRATION, 7 WARNINGS AND PRECAUTIONS, and 8 ADVERSE REACTIONS).
| Table 27: Results from 18-Week Placebo-Controlled Clinical Study of Canagliflozin as Add-on Therapy with Insulin ≥30 Units/Day (With Insulin Only)1 | ||||
|---|---|---|---|---|
| Efficacy Parameter | Canagliflozin + Insulin 18 Weeks | Placebo + Insulin (N=187) | ||
100 mg (N=183) | 300 mg (N=184) | |||
| HbA1c (%) | ||||
| Baseline (mean) | 8.28 | 8.32 | 8.16 | |
| Change from baseline (adjusted mean) | -0.61 | -0.70 | -0.06 | |
| Difference from placebo (adjusted mean) (95% CI) | -0.542 (-0.70; -0.39) | -0.632 (-0.79; -0.48) | N/A3 | |
| Percent of patients achieving HbA1c <7% | 24.72 | 24.02 | 9.3 | |
| Fasting Plasma Glucose (mmol/L) | ||||
| Baseline | 9.62 | 9.49 | 9.65 | |
| Change from baseline (adjusted mean) | -1.10 | -1.33 | 0.32 | |
| Difference from placebo (adjusted mean) (95% CI) | -1.432 (-1.98; -0.88) | -1.652 (-2.20; -1.09) | N/A3 | |
| Body Weight | ||||
| Baseline (mean) in kg | 95.8 | 93.5 | 94.5 | |
| % change from baseline (adjusted mean) | -1.9 | -1.9 | 0.3 | |
| Difference from placebo (adjusted mean) (95% CI) | -2.22 (-2.7; -1.6) | -2.12 (-2.7; -1.6) | N/A3 | |
1 Intent-to-treat population using last observation in study prior to glycemic rescue therapy
2 p<0.001 compared to placebo
3 N/A = Not applicable
| Table 28: Results from 18-Week Placebo-Controlled Clinical Study of Canagliflozin as Add-on Therapy with Insulin ≥30 Units/Day (With Insulin and Metformin)1 | ||||
|---|---|---|---|---|
| Efficacy Parameter | Canagliflozin + Insulin + Metformin 18 Weeks | Placebo + Insulin + Metformin (N=244) | ||
100 mg (N=241) | 300 mg (N=246) | |||
| HbA1c (%) | ||||
| Baseline (mean) | 8.28 | 8.21 | 8.21 | |
| Change from baseline (adjusted mean) | -0.66 | -0.77 | 0.01 | |
| Difference from placebo (adjusted mean) (95% CI) | -0.672 (-0.79; -0.55) | -0.782 (-0.90; -0.66) | N/A3 | |
| Percent of patients achieving HbA1c <7% | 19.62 | 26.72 | 7.1 | |
| Fasting Plasma Glucose (mmol/L) | ||||
| Baseline | 9.38 | 9.35 | 9.34 | |
| Change from baseline (adjusted mean) | -1.06 | -1.48 | 0.09 | |
| Difference from placebo (adjusted mean) (95% CI) | -1.152 (-1.56; -0.73) | -1.572 (-1.98; -1.16) | N/A3 | |
| Body Weight | ||||
| Baseline (mean) in kg | 97.4 | 98.4 | 99.9 | |
| % change from baseline (adjusted mean) | -1.9 | -2.7 | 0.0 | |
| Difference from placebo (adjusted mean) (95% CI) | -1.92 (-2.4; -1.5) | -2.72 (-3.2; -2.3) | N/A3 | |
1 Intent-to-treat population using last observation in study prior to glycemic rescue therapy 2 p < 0.001 compared to placebo 3 N/A = Not applicable | ||||
Studies in Special Populations
Study in older patients (DIA3010)
A total of 714 older patients (≥55 to ≤80 years of age) with inadequate glycemic control (baseline HbA1c level of ≥7.0 to ≤10.0%) on current diabetes therapy (either diet and exercise alone or in combination with oral or parenteral agents) participated in a randomized, double-blind, placebo-controlled study to evaluate the efficacy of canagliflozin as add-on therapy with current diabetes treatment over 26 weeks. The mean age was 64 years, 55% of patients were men, and the mean baseline eGFR was 77 mL/min/1.73 m2. Patients with inadequate glycemic control on their current diabetes therapy were randomized to the addition of canagliflozin 100 mg, canagliflozin 300 mg, or placebo, administered once daily. As shown in Table 29, statistically significant (p<0.001) changes from baseline in HbA1c, FPG, and body weight were observed for canagliflozin at Week 26. In addition, a greater percent of patients achieved an HbA1c of <7.0% compared to placebo (see 10 CLINICAL PHARMACOLOGY, Special Populations and Conditions). Statistically significant (p<0.001) reductions in systolic blood pressure were observed with canagliflozin 100 mg and 300 mg relative to placebo of -4.6 mmHg and -7.9 mmHg, respectively.
A subset of patients (N=211) participated in the body composition substudy using DXA body composition analysis. This demonstrated that approximately two-thirds of the weight loss with canagliflozin was due to loss of fat mass relative to placebo.
| Table 29: Results from 26-Week Placebo-Controlled Clinical Study of Canagliflozin as Add-on Therapy with Antihyperglycemic Agents in Older Patients Inadequately Controlled on Antihyperglycemic Agents (AHAs)1 | ||||
|---|---|---|---|---|
| Efficacy Parameter | Canagliflozin + Current AHA 26 Weeks | Placebo + Current AHA N=237 | ||
100 mg N=241 | 300 mg N=236 | |||
| HbA1c (%) | ||||
| Baseline (mean) | 7.77 | 7.69 | 7.76 | |
| Change from baseline (adjusted mean) | -0.60 | -0.73 | -0.03 | |
| Difference from placebo (adjusted mean) (95% CI) | -0.572 (-0.71; -0.44) | -0.702 (-0.84; -0.57) | N/A3 | |
| Percent of patients achieving HbA1c < 7% | 47.72 | 58.52 | 28.0 | |
| Fasting Plasma Glucose (mmol/L) | ||||
| Baseline (mean) | 8.93 | 8.49 | 8.68 | |
| Change from baseline (adjusted mean) | -1.00 | -1.13 | 0.41 | |
| Difference from placebo (adjusted mean) (95% CI) | -1.412 (-1.76; -1.07) | -1.542 (-1.88; -1.19) | N/A3 | |
| Body Weight | ||||
| Baseline (mean) in kg | 88.4 | 88.8 | 91.3 | |
| % change from baseline (adjusted mean) | -2.4 | -3.1 | -0.1 | |
| Difference from placebo (adjusted mean) (95% CI) | -2.32 (-2.8; -1.7) | -3.02 (-3.5; -2.4) | N/A3 | |
1 Intent-to-treat population using last observation in study prior to glycemic rescue therapy 2 p<0.001 compared to placebo 3 N/A = Not applicable | ||||
Patients with renal impairment (DIA3004)
A total of 269 patients with moderate renal impairment and eGFR 30 to <50 mL/min/1.73 m2 inadequately controlled on current diabetes therapy (baseline HbA1c level of ≥7.0 to ≤10.5%) participated in a randomized, double-blind, placebo-controlled clinical study to evaluate the efficacy of canagliflozin as add-on therapy with current diabetes treatment (diet or antihyperglycemic agent therapy with most patients on insulin and/or sulfonylurea) over 26 weeks. The mean age was 68 years, 61% of patients were men, and the mean baseline eGFR was 39 mL/min/1.73 m2. Patients with inadequate glycemic control on their current diabetes therapy were randomized to the addition of canagliflozin 100 mg, canagliflozin 300 mg, or placebo administered once daily.
As shown in Table 30, significant reductions in HbA1c relative to placebo were observed for canagliflozin 100 mg and canagliflozin 300 mg, respectively at Week 26. In addition, a greater percentage of patients achieved an HbA1c <7.0% compared to placebo. Patients treated with canagliflozin exhibited mean decreases in percent change from baseline body weight compared to placebo. Reductions in systolic blood pressure were observed with canagliflozin 100 mg and 300 mg relative to placebo of -5.7 mmHg and -6.1 mmHg, respectively. An increased incidence of hypoglycemia was observed in this study (see 7 WARNINGS AND PRECAUTIONS, 8 ADVERSE REACTIONS and 10 CLINICAL PHARMACOLOGY, Special Populations and Conditions).
| Table 30: Results from 26-Week Placebo-Controlled Clinical Study of Canagliflozin as Add-on Therapy with Antihyperglycemic Agents (AHAs) in Patients with Moderate Renal Impairment1 | ||||
|---|---|---|---|---|
| Efficacy Parameter | Canagliflozin + AHA (if any) 26 Weeks | Placebo + AHA (if any) N=90 | ||
100 mg N=90 | 300 mg N=89 | |||
| HbA1c (%) | ||||
| Baseline (mean) | 7.89 | 7.97 | 8.02 | |
| Change from baseline (adjusted mean) | -0.33 | -0.44 | -0.03 | |
| Difference from placebo (adjusted mean) (95% CI) | -0.30 (-0.53; -0.07) | -0.402 (-0.63; -0.17) | N/A3 | |
| Percent of patients achieving HbA1c <7% | 27.3 | 32.6 | 17.2 | |
| Fasting Plasma Glucose (mmol/L) | ||||
| Baseline (mean) | 9.41 | 8.80 | 8.93 | |
| Change from baseline (adjusted mean) | -0.83 | -0.65 | 0.03 | |
| Difference from placebo (adjusted mean) (95% CI) | -0.85 (-1.58; -0.13) | -0.67 (-1.41; 0.06) | N/A3 | |
| Body Weight | ||||
| Baseline (mean) in kg | 90.5 | 90.2 | 92.7 | |
| % change from baseline (adjusted mean) | -1.2 | -1.5 | 0.3 | |
| Difference from placebo (adjusted mean) (95% CI) | -1.62 (-2.3; -0.8) | -1.82 (-2.6; -1.0) | N/A3 | |
1 Intent-to-treat population using last observation in study prior to glycemic rescue therapy 2 p<0.001 compared to placebo 3 N/A = Not applicable | ||||
Integrated analysis of patients with moderate renal impairment: An analysis of a pooled patient population (N=1085) with moderate renal impairment (baseline eGFR 30 to <60 mL/min/1.73 m2) from four placebo-controlled studies was conducted to evaluate the change from baseline HbA1c and percent change from baseline in body weight in these patients. The mean eGFR in this analysis was 48 mL/min/1.73 m2, which was similar across all treatment groups. Most patients were on insulin and/or sulfonylurea.
This analysis demonstrated that canagliflozin provided statistically significant (p<0.001) reductions in HbA1c and body weight compared to placebo (see Table 31). An increased incidence of hypoglycemia was observed in this integrated analysis (see 7 WARNINGS AND PRECAUTIONS and 8 ADVERSE REACTIONS).
| Table 31: Integrated Analysis of Four Phase 3 Clinical Studies in Patients with Moderate Renal Impairment1 | ||||
|---|---|---|---|---|
| Efficacy Parameter | Canagliflozin + AHA (if any) | Placebo + AHA (if any) N=382 | ||
100 mg N=338 | 300 mg N=365 | |||
| HbA1C (%) | ||||
| Baseline (mean) | 8.10 | 8.10 | 8.01 | |
| Change from baseline (adjusted mean) | -0.52 | -0.62 | -0.14 | |
| Difference from placebo (adjusted mean) (95%CI) | -0.382 (-0.50; -0.26) | -0.472 (-0.59; -0.35) | N/A3 | |
| Body Weight | ||||
| Baseline (mean) in kg | 90.3 | 90.1 | 92.4 | |
| % change from baseline (adjusted mean) | -2.0 | -2.4 | -0.5 | |
| Difference from placebo (adjusted mean) (95%CI) | -1.62 (-2.0; -1.1) | -1.92 (-2.3; -1.5) | N/A3 | |
1 Intent-to-treat population using last observation in study prior to glycemic rescue therapy 2 p<0.001 3 N/A = Not applicable | ||||
Cardiovascular Outcomes
Table 32: Summary of Patient Demographics for Clinical Trials in Cardiovascular Outcomes
| Study # | Study design | Dosage, route of administration and duration | Study subjects (n) | Mean age (Range) | Sex % (F/M) |
|---|---|---|---|---|---|
| Study # | Study design | Dosage, route of administration and duration | Study subjects (n) | Mean age (Range) | Sex % (F/M) |
| DIA3008 | Randomized, double-blind, placebo-controlled, parallel-group, Multicentre | Canagliflozin 100 or 300 mg/day or Placebo mean 223 weeks exposure to study drug | Total: 4330 Canagliflozin 100 mg: 1445 Canagliflozin 300 mg: 1443 Placebo: 1442 | 62.4 (32-87) | 33.9/66.1 |
| DIA4003 | Randomized, double-blind, placebo-controlled, | Canagliflozin 100 up-titrated to 300 mg/day at week 13 or later at | Total: 5813 Canagliflozin 100 mg up titrated: 2907 | 64 (30-90) | 37.2/62.8 |
parallel-group, Multicentre | investigators’ discretion mean 94 weeks exposure to study drug | Placebo: 2906 | |||
Cardiovascular Outcomes (CANVAS (DIA3008) and CANVAS-R (DIA4003))
The effect of canagliflozin on cardiovascular risk in adults with type 2 diabetes who had established cardiovascular (CV) disease or were at risk for CVD (two or more CV risk factors), was evaluated in the CANVAS Program (CANVAS and CANVAS-R studies). These studies were multicenter, multi-national, randomized, double-blind, placebo-controlled parallel group, time- and event-driven, with similar inclusion and exclusion criteria and patient populations. The studies compared the risk of experiencing a Major Adverse Cardiovascular Event (MACE) defined as the composite of cardiovascular death, nonfatal myocardial infarction and nonfatal stroke, between canagliflozin and placebo on a background of standard of care treatments for diabetes and atherosclerotic cardiovascular disease. Additional pre-specified, adjudicated endpoints included CV death, fatal/non-fatal myocardial infarction, fatal/non-fatal stroke, hospitalization for heart failure, and all-cause mortality.
In CANVAS, subjects were randomly assigned 1:1:1 to canagliflozin 100 mg, canagliflozin 300 mg, or matching placebo. In CANVAS-R, subjects were randomly assigned 1:1 to canagliflozin 100 mg or matching placebo, and titration to 300 mg was permitted at the investigator’s discretion (based on tolerability and glycemic needs) at Week 13 or later visits. Concomitant antidiabetic and atherosclerotic therapies could be adjusted, at the discretion of investigators, to ensure participants were treated according to the standard care for these diseases.
A total of 10,134 patients were treated (4,327 in CANVAS and 5,807 in CANVAS-R; total of 4,344 randomly assigned to placebo and 5,790 to canagliflozin). For the integrated CANVAS trials, the mean duration of treatment was 149.2 weeks (mean of 222.8 weeks for CANVAS and 94.4 weeks for CANVAS-R) and the mean duration of study follow-up was 188.2 weeks (mean of 295.9 for CANVAS and 108.0 weeks for CANVAS-R). Vital status was obtained for 99.6% of the subjects. The proportion of subjects who completed the study was 96.0%. Approximately 78% of the study population was Caucasian, 13% was Asian, and 3% was Black. The mean age was 63 years and approximately 64% were male. All patients in the study had inadequately controlled type 2 diabetes mellitus at baseline (HbA1c ≥7.0% to ≤10.5%). The mean HbA1c at baseline was 8.2% and mean duration of diabetes was 13.5 years. Baseline renal function was normal or mildly impaired in 80% of patients and moderately impaired in 20% of patients (mean eGFR 77 mL/min/1.73 m2). There were 526 patients with eGFR 30 - <45 mL/min/1.73 m2, 1485 patients with eGFR 45 - <60 mL/min/1.73 m2, and 5625 with eGFR 60 - <90 mL/min/1.73 m2. At baseline, 99% of patients were treated with one or more antidiabetic medications including metformin (77%), insulin (50%), and sulfonylurea (43%).
Sixty-six percent of subjects had a history of established cardiovascular disease, with 56% having a history of coronary disease, 19% with cerebrovascular disease, and 21% with peripheral vascular disease; 14% had a history of heart failure. At baseline, the mean systolic blood pressure was 137 mmHg, the mean diastolic blood pressure was 78 mmHg, the mean LDL was 2.29 mmol/L, the mean HDL was 1.2 mmol/L, and the mean urinary albumin to creatinine ratio (UACR) was 115 mg/g. At baseline, approximately 80% of patients were treated with renin angiotensin system inhibitors, 54% with beta-blockers, 13% with loop diuretics, 36% with non-loop diuretics, 75% with statins, and 74% with antiplatelet agents (including aspirin).
The primary endpoint in the CANVAS Program was the time to first occurrence of a composite MACE endpoint of cardiovascular death, nonfatal myocardial infarction, or nonfatal stroke, considering all events up to individual trial completion. The MACE hazard ratio (HR) in patients treated with canagliflozin compared with placebo and its 95% CI was estimated using a stratified Cox proportional hazards regression model with stratification by study and by established cardiovascular disease (HR: 0.86; 95% CI 0.75, 0.97, p<0.0001 for non-inferiority; p=0.0158 for superiority). According to the primary hypothesis, the integrated canagliflozin treatment (CANVAS and CANVAS-R) was found to be non-inferior to placebo, since the upper bound of the 95% CI was below 1.3 and superior to placebo, since the upper bound of the 95% CI was also below 1.0. Each of the components of the MACE composite endpoint showed a similar reduction when assessed as independent endpoints (see Figure 6). Results for the 100 mg and 300 mg canagliflozin doses were consistent with results for the combined dose groups. The reduction in MACE was accounted for by the subgroup of patients with established cardiovascular disease (HR 0.82; 95% CI 0.72, 0.95) (see Figure 6), whilst the subgroup of patients with only risk factors for cardiovascular disease at baseline had a hazard ratio whose 95% confidence interval included one (HR 0.98; 95% CI 0.74, 1.30).
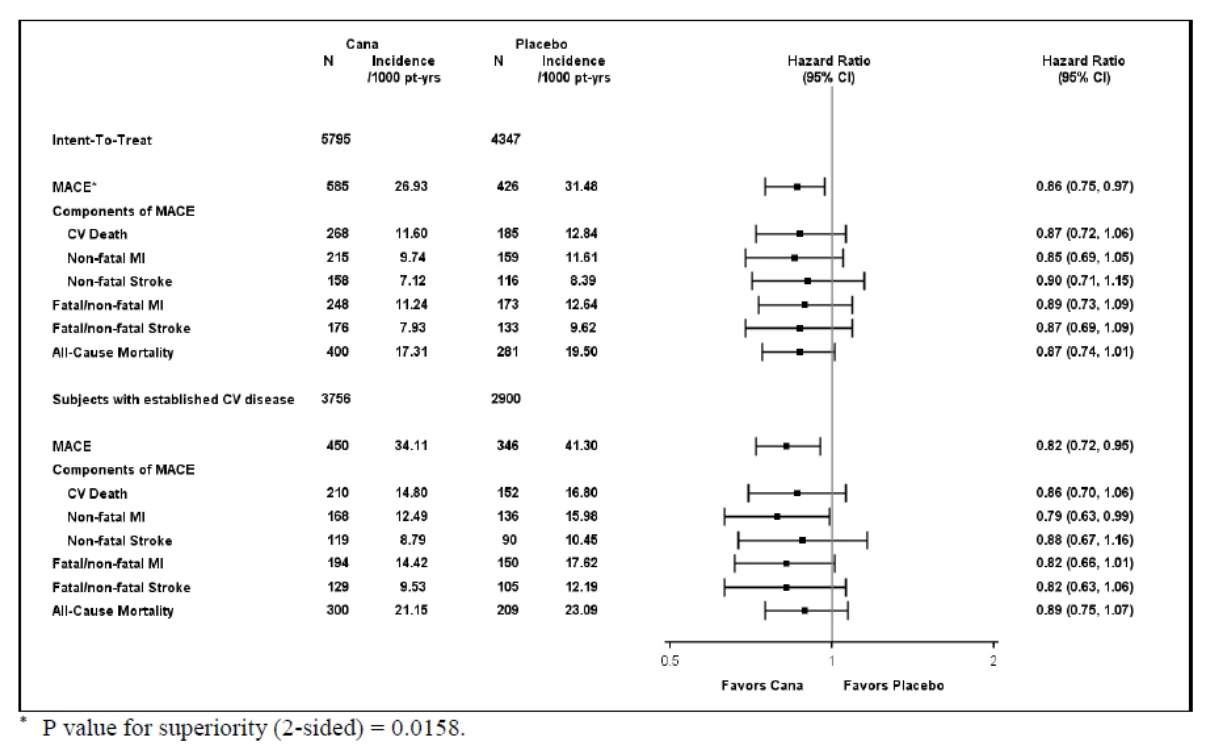
Figure 6: Treatment Effect for Cardiovascular Events (CANVAS Integrated and Subjects with Established CV Disease
Based on the Kaplan-Meier plot for the first occurrence of MACE, shown below, the reduction in MACE in the canagliflozin group was observed as early as Week 26 and was maintained throughout the remainder of the study (Figure 7 and Figure 8).
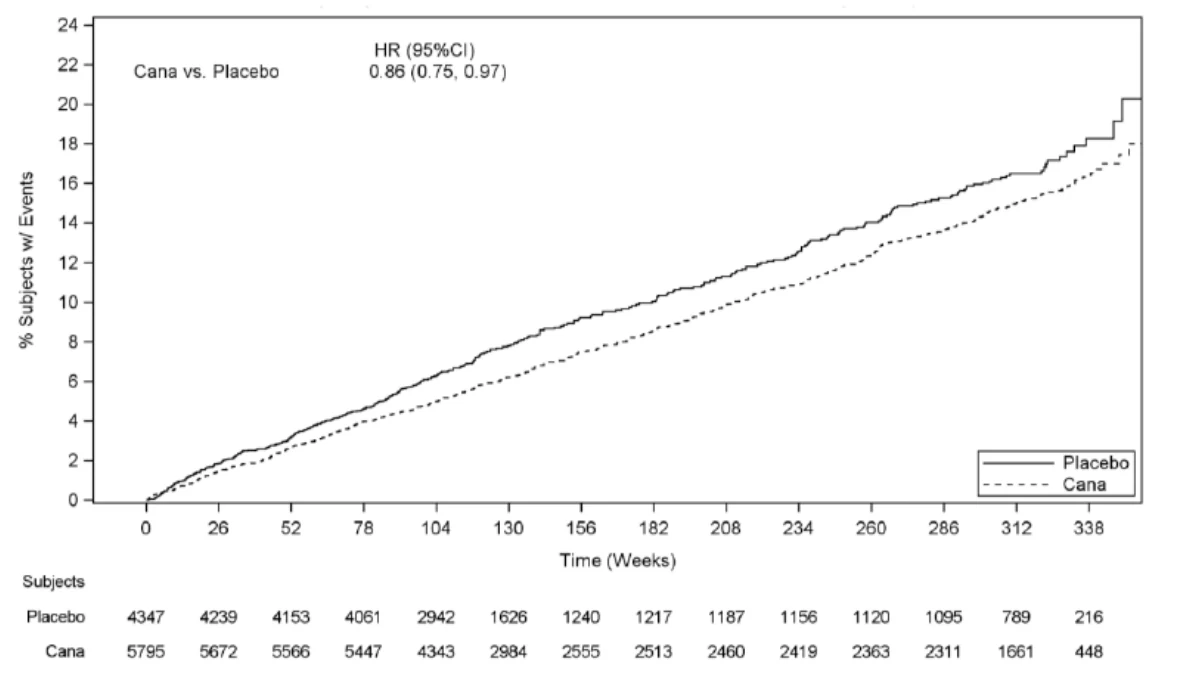
Figure 7: Time to First Occurrence of MACE (CANVAS Integrated)
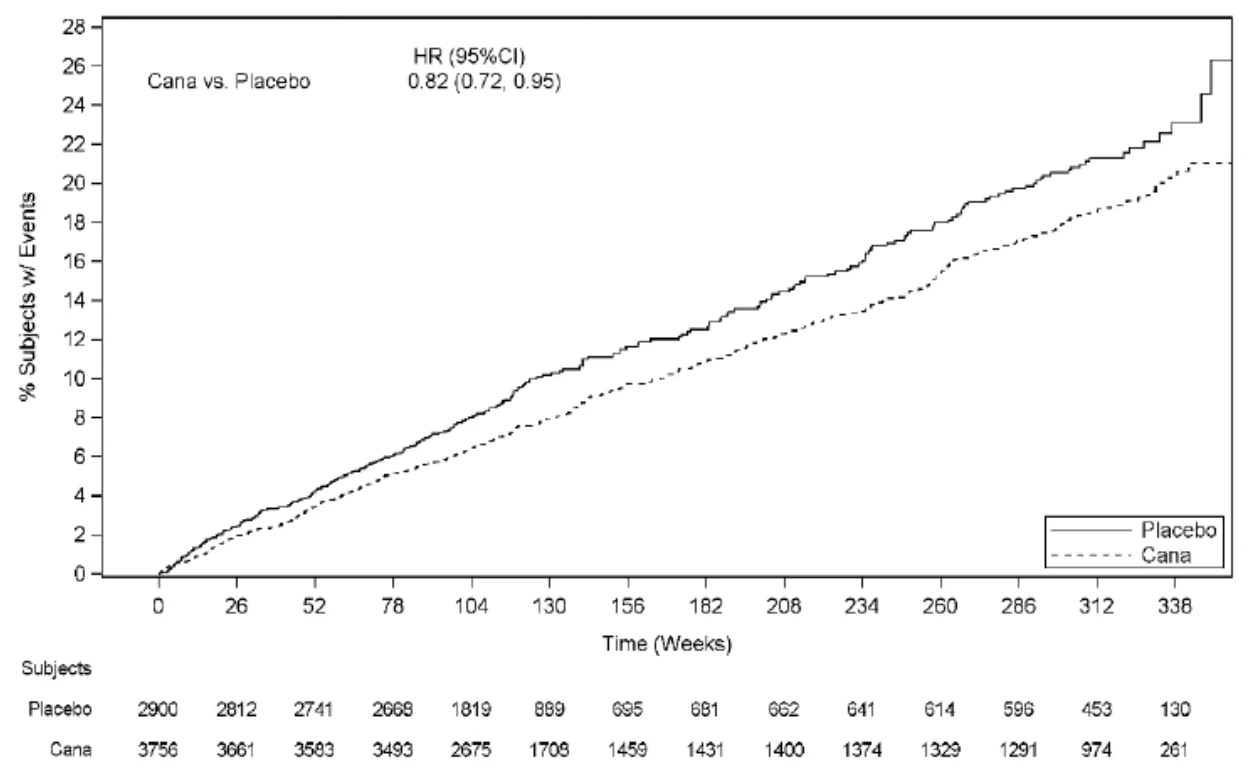
Figure 8: Time to First Occurrence of MACE (Subjects with Established CV Disease)
In the CANVAS program, subjects treated with canagliflozin had a lower risk of hospitalization for heart failure compared to those treated with placebo.
| Table 33: Treatment Effect for Hospitalized Heart Failure and the Composite of Death or Hospitalization due to Heart Failure | ||||||
|---|---|---|---|---|---|---|
Placebo N=4347 Event rate per 100 patient-years | Canagliflozin N=5795 Event rate per 100 patient-years | Hazard ratio vs. Placebo (95% CI) | ||||
| Hospitalized heart failure (time to first occurrence; intent-to-treat analysis set) | 0.87 | 0.55 | 0.67 (0.52, 0.87)1 | |||
| Death or Hospitalization due to heart failure (time to first occurrence; intent-to-treat analysis set) | 0.97 | 0.64 | 0.70 (0.55, 0.89) | |||
1 p=0.0021; nominal value
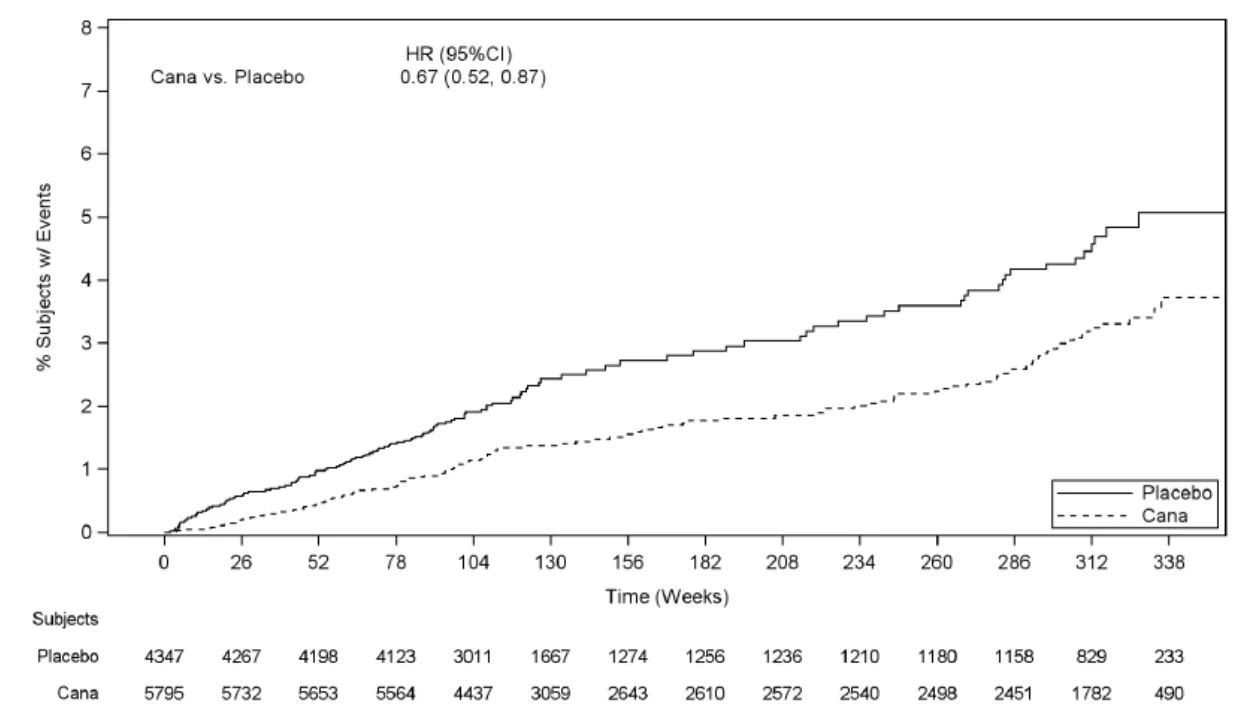
Figure 9: Time to First Occurrence of Hospitalization of Heart Failure
Diabetic Nephropathy
Table 34: Summary of Patient Demographics for Clinical Trials in Diabetic Nephropathy
| Study # | Study design | Dosage, route of administration and duration | Study subjects (n) | Mean age (Range) | Sex % (F/M) |
|---|---|---|---|---|---|
| DNE3001 | Randomized, double-blind, placebo-controlled, parallel-group, Multicentre | Canagliflozin 100 mg or Placebo mean 115 weeks exposure to study drug | Total: 4401 Canagliflozin 100 mg: 2202 Placebo: 2199 | 63 (30-89) | 33.9/66.1 |
Renal and Cardiovascular Outcomes in Patients with Type 2 Diabetes Mellitus and Diabetic Nephropathy (CREDENCE DNE3001)
The Canagliflozin and Renal Events in Diabetes with Established Nephropathy Clinical Evaluation Trial (CREDENCE) studied the effect of canagliflozin 100 mg relative to placebo on progression to end-stage kidney disease (ESKD), doubling of serum creatinine, and renal or cardiovascular (CV) death in adults with type 2 diabetes and diabetic nephropathy with (eGFR) ≥ 30 to < 90 mL/min/1.73m2 and albuminuria (˃ 33.9 to ≤ 565.6 mg/mmol of creatinine), who were receiving standard of care including maximally tolerated labelled dose of an angiotensin-converting enzyme inhibitor (ACEi) or angiotensin receptor blocker (ARB). This study was a multicenter, randomized, double-blind, event-driven, placebo-controlled, parallel-group, 2-arm study.
In CREDENCE, subjects were randomly assigned 1:1 to canagliflozin 100mg or placebo, stratified by screening estimated glomerular filtration rate (eGFR) ≥30 to <45, ≥45 to <60, ≥60 to <90mL/min/1.73 m2. Treatment with canagliflozin 100 mg was continued in patients until the initiation of dialysis or renal transplantation.
A total of 4,401 subjects were randomized (2,199 randomly assigned to placebo and 2,202 to canagliflozin 100 mg), followed for a mean duration of 136 weeks, and included in the intent-to-treat analysis set. Four of the randomized subjects were not dosed, leading to 4,397 subjects (exposed for a mean duration of 115 weeks) in the on-treatment analysis set. Vital status was obtained for 99.9% of subjects across the study. The majority (67%) of the study population identified as White, 20% as Asian, and 5% as Black; 32% of all subjects were of Hispanic or Latino ethnicity. The mean age was 63 years and approximately 66% were male.
The mean baseline HbA1c was 8.3%, with 53.2% of subjects having baseline HbA1c ≥ 8%, and the baseline median urine albumin/creatinine was 104.75 mg/mmol. The most frequent antihyperglycemic agents (AHA) medications used at baseline were insulin (65.5%), biguanides (57.8%), and sulfonylureas (28.8%). Nearly all subjects (99.9%) were on ACEi or ARB at randomization. About 92% of the subjects were on cardiovascular therapies (not including ACEi/ARBs) at baseline, with approximately 60% taking an anti-thrombotic agent (including aspirin) and 69% on statins.
The mean baseline eGFR was 56.2 mL/min/1.73 m2 and approximately 60% of the population had a baseline eGFR of <60 mL/min/1.73 m2. Subjects had a mean duration of diabetes of approximately 16 years. The proportion of subjects with prior CV disease was 50.4%; 14.8% had a history of heart failure. While the entire study population had nephropathy at baseline, about 64% of the population had at least 2 microvascular complications (i.e. diabetic nephropathy and another microvascular complication). At baseline, 5.4% of subjects in the canagliflozin 100 mg arm had a history of amputation and 5.2% of subjects in the placebo arm.
The primary composite endpoint in the CREDENCE study was the time to first occurrence of ESKD (defined as an eGFR <15 mL/min/1.73 m2, initiation of chronic dialysis or renal transplant), doubling of serum creatinine, and renal or CV death. Canagliflozin 100 mg significantly reduced the risk of first occurrence of the primary composite endpoint of ESKD, doubling of serum creatinine, and renal or CV death [p<0.0001; HR:0.70; 95% CI:0.59, 0.82] (see Figure 10 and Figure 11). The treatment effect reflected a reduction in progression to ESKD, doubling of serum creatinine and cardiovascular death. There were few renal deaths during the trial. The efficacy of canagliflozin 100 mg on the primary endpoint composite was generally consistent across major demographic and disease subgroups, including a subgroup defined by the 3 screening eGFR strata.
Canagliflozin 100 mg significantly reduced the risk of the following secondary endpoints, as shown in Figure 10 below: Composite endpoint of CV Death and Hospitalized Heart Failure [HR:0.69; 95% CI: 0.57 to 0.83; p=0.0001], MACE (Major Adverse Cardiovascular Events) (comprised of non-fatal MI, non-fatal stroke and CV death) [HR:0.80; 95% CI:0.67 to 0.95; p=0.0121], Hospitalized Heart Failure [HR:0.61; 95% CI:0.47to 0.80; p=0.0003], and Renal composite endpoint (comprised of ESKD, doubling of serum creatinine, and renal death) [HR:0.66; 95% CI:0.53 to 0.81; p<0.0001].
For both primary and secondary endpoints, the HR in subjects treated with canagliflozin 100 mg compared with placebo and its 95% CI were estimated using a stratified Cox proportional hazards regression model with treatment as the explanatory variable and stratified by screening eGFR (≥30 to <45, ≥45 to <60, ≥60 to <90mL/min/1.73 m2).
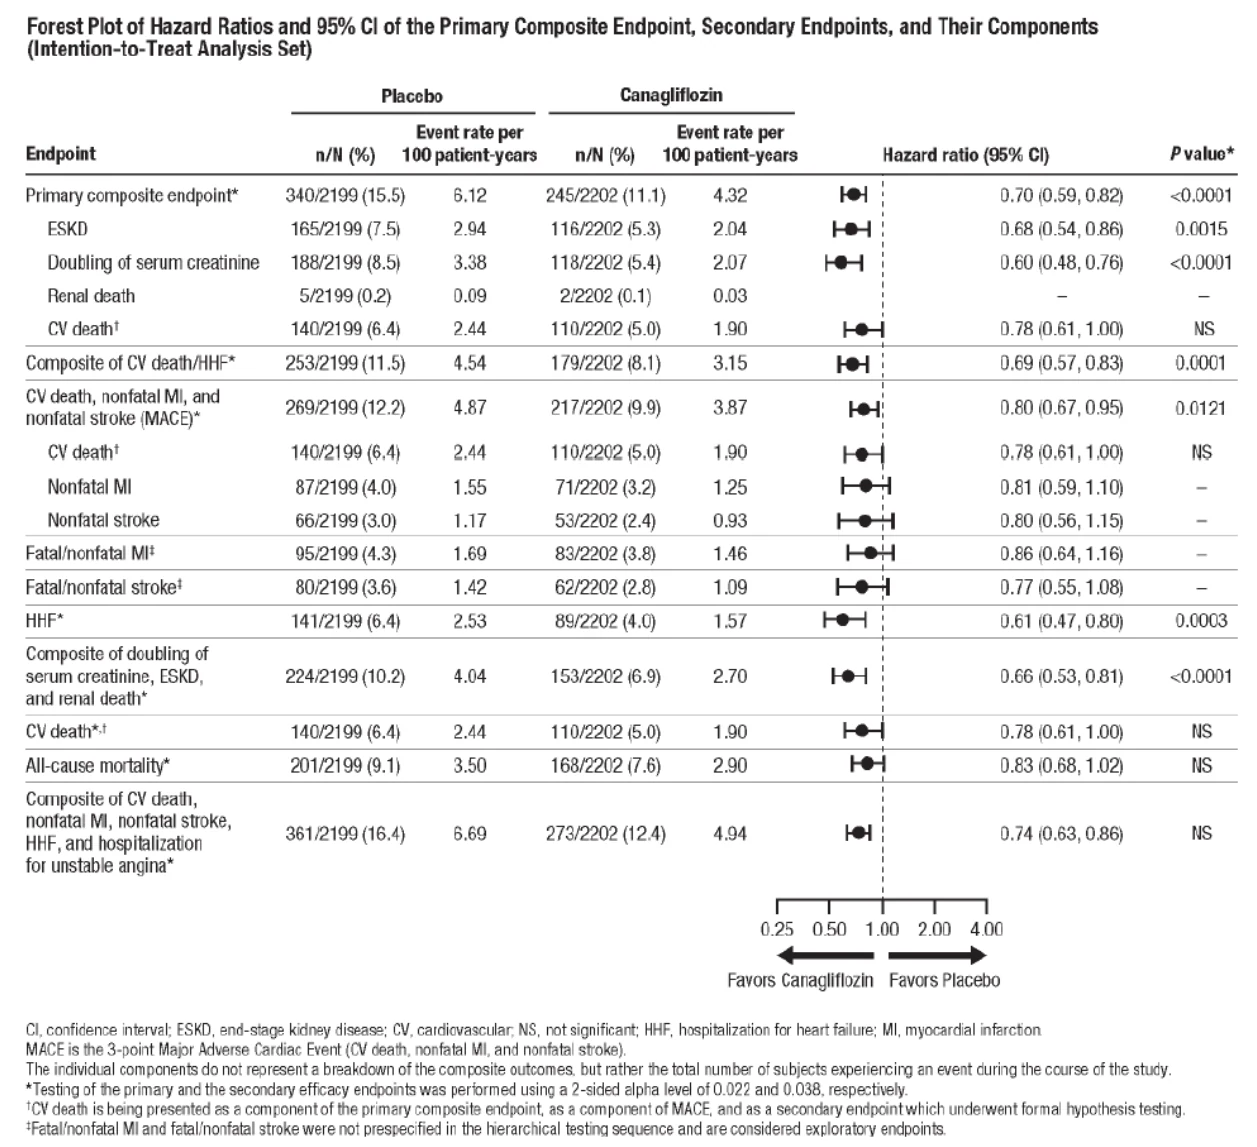
Figure 10: Treatment Effect for the Primary and Secondary Composite Endpoints and their Components
Based on the Kaplan-Meier plot for the time to first occurrence of the primary composite endpoint of ESKD, doubling of serum creatinine, renal death, and CV death shown below, the curves began to separate by Week 52 and continued to diverge thereafter (see Figure 11).
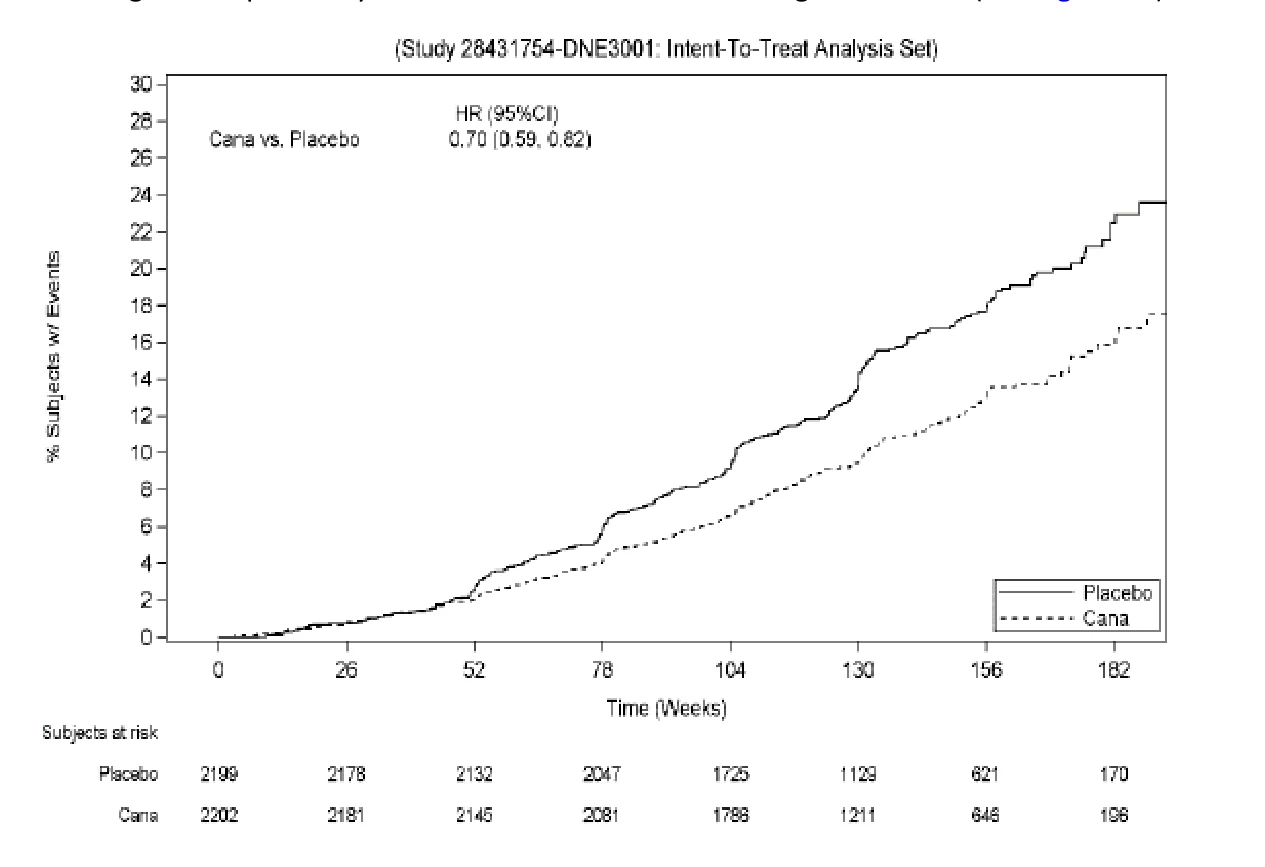
Figure 11: Time to First Occurrence of the Primary Composite Endpoint (ESKD, Doubling of Serum Creatinine, Renal Death, CV Death)
The Kaplan-Meier plot for the first occurrence of hospitalized heart failure over time is shown in Figure 12. Canagliflozin significantly reduced the risk of hospitalized heart failure as compared with placebo (HR: 0.61; 95% CI: 0.47, 0.80; p=0.0003). The Kaplan-Meier curves separated within the first 26 weeks of treatment and continued to diverge thereafter.
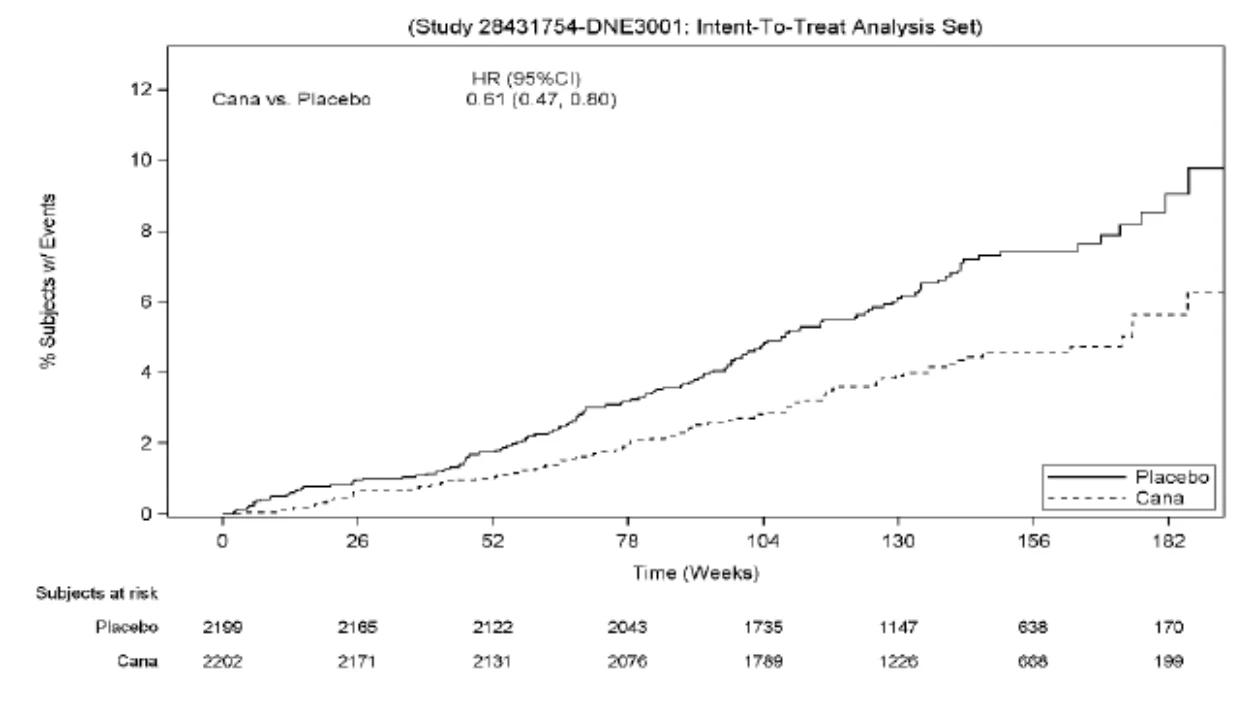
Figure 12: Time to First Occurrence of Hospitalized Heart Failure
The Kaplan-Meier plot for the first occurrence of the secondary renal composite endpoint of doubling of serum creatinine, ESKD, and renal death over time is shown in Figure 13. Canagliflozin significantly reduced the risk of the secondary renal composite endpoint as compared with placebo (HR: 0.66; 95% CI: 0.53, 0.81; p<0.0001). The Kaplan-Meier curves separated within the first 52 weeks of treatment and continued to diverge thereafter.
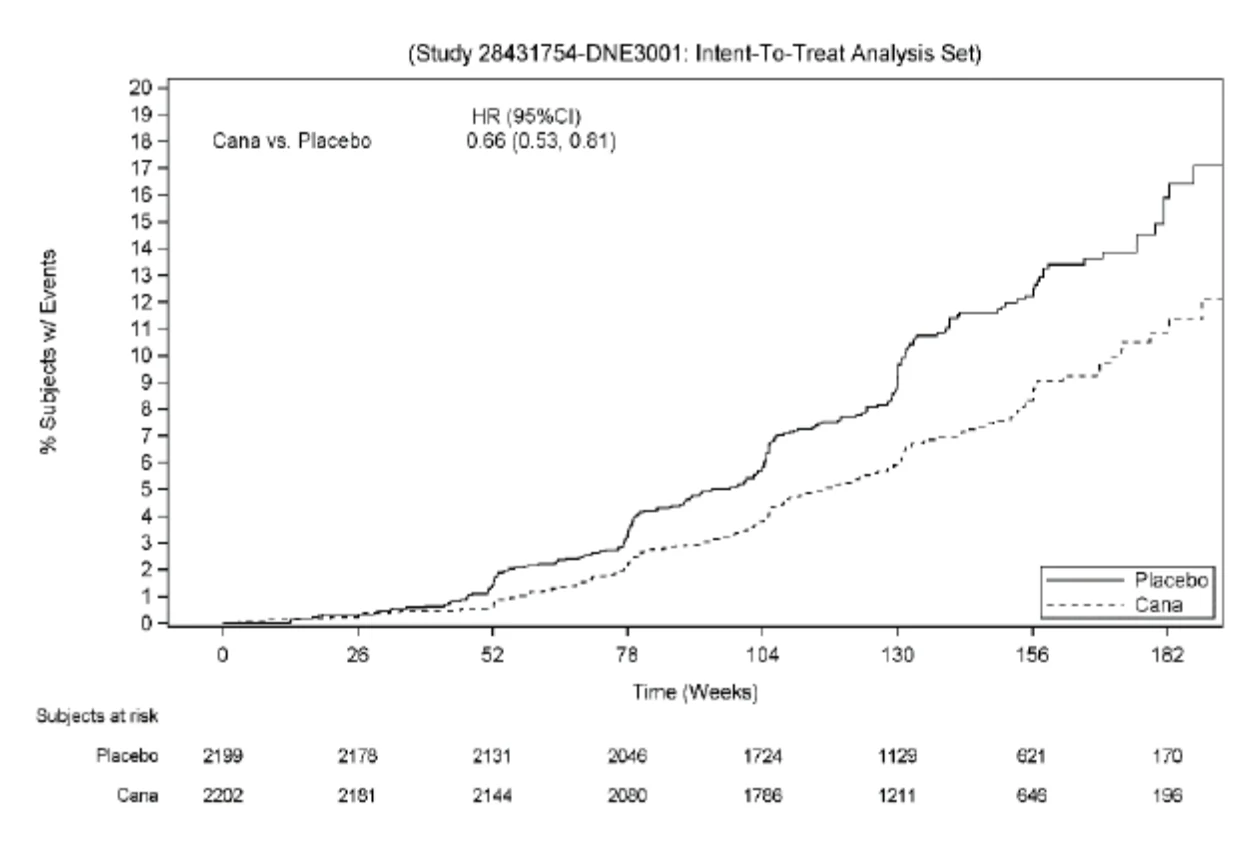
Figure 13: Time to First Occurrence of Renal Composite Endpoint (Doubling of Serum Creatinine/ESKD/Renal Death)
14.2 Comparative Bioavailability Studies
A randomized, blinded, single-dose, two-period, two-treatment, two-sequence, crossover, comparative bioavailability study of Sandoz Canagliflozin 300 mg tablets (Sandoz Canada Inc.) and INVOKANA® 300 mg tablets (Janssen Inc., Canada) was conducted in healthy, adult male and female subjects under fasting conditions. Comparative bioavailability data from 31 subjects that were included in the statistical analysis are presented in the following table:
SUMMARY TABLE OF THE COMPARATIVE BIOAVAILABILITY DATA
Canagliflozin (1 x 300 mg) Geometric Mean Arithmetic Mean (CV %) | ||||
|---|---|---|---|---|
Canagliflozin (1 x 300 mg) Geometric Mean Arithmetic Mean (CV %) | ||||
| Parameter | Test1 | Reference2 | % Ratio of Geometric Means | 90 % Confidence Interval |
| Parameter | Test1 | Reference2 | % Ratio of Geometric Means | 90 % Confidence Interval |
AUCT (ng·h/mL) | 26852.4 27609.1 (24.9) | 26605.1 27554.0 (27.6) | 100.9 | 97.8 - 104.2 |
AUCI (ng·h/mL) | 27611.0 28372.5 (24.6) | 27672.7 28676.2 (27.6) | 99.8 | 96.7 - 102.9 |
Cmax (ng/mL) | 2658.1 2741.0 (26.3) | 2696.0 2771.0 (23.8) | 98.6 | 91.2 - 106.6 |
Tmax3 (h) | 4.0 (0.8 - 5.5) | 4.5 (1.0 - 7.0) | ||
T1/24 (h) | 14.5 (36.9) | 15.7 (36.2) | ||
1 Sandoz Canagliflozin (canagliflozin) tablets, 300 mg (Sandoz Canada Inc.)
2 INVOKANA® (canagliflozin) tablets, 300 mg (Janssen Inc., Canada)
3 Expressed as the median (range) only
4 Expressed as the arithmetic mean (CV %) only
15 MICROBIOLOGY
No microbiological information is required for this product.
16 NON-CLINICAL TOXICOLOGY
General Toxicology: Non-clinical data reveal no particular hazard for humans based on conventional studies of safety pharmacology, repeated dose toxicity, and genotoxicity. Canagliflozin has relatively low acute oral toxicity, with maximum non-lethal single doses of 2000 mg/kg in mice (both sexes) and male rats, and 1000 mg/kg in female rats.
Repeat-dose oral toxicity studies were conducted in mice, rats and dogs for up to 3, 6 and 12 months, respectively. Canagliflozin was generally well tolerated up to oral doses of 4 mg/kg/day in rats and 100 mg/kg/day in mice and dogs (up to approximately 0.5, 11, and 20 times the clinical dose of 300 mg based on AUC exposure for rats, mice and dogs, respectively). The major adverse effects, observed mainly in rats, were related to the pharmacologic mode of action of canagliflozin, and these included increased urinary glucose, increased urine volume, increased urinary excretion of electrolytes, decreased plasma glucose at high dose levels, and reduced body weight. The primary targets of toxicity were the kidney and bone. In the 3-month rat study, minimal mineralization of renal interstitium and/or pelvis were observed in some animals given doses of ≥4 mg/kg/day. In the 6-month rat study, renal tubular dilatation was seen at all doses (4, 20 and 100 mg/kg/day), and an increased incidence and severity of transitional epithelial hyperplasia in the renal pelvis was observed at 100 mg/kg/day. In dogs, treatment-related tubular regeneration/degeneration and tubular dilatation occurred only at the high dose of 200/100 mg/kg/day. Trabecular hyperostosis was observed in the repeat-dose studies in rats, but not in mice and dogs. In the 2-week rat study, canagliflozin at 150 mg/kg/day caused minimal to mild hyperostosis but in 3- and 6-month rat studies, hyperostosis was detected at 4 mg/kg/day, the lowest dose tested. A 1-month mechanistic rat study showed that hyperostosis occurred in young, actively growing animals (6 to 8 weeks old, as in the toxicity studies) but not in older (6-month old) animals where bone growth has substantially slowed.
Carcinogenicity: The carcinogenicity of canagliflozin was evaluated in 2-year studies in mice and rats at oral doses of 10, 30, or 100 mg/kg/day. Canagliflozin did not increase the incidence of tumors in male and female mice up to 100 mg/kg/day (up to 14 times the clinical dose of 300 mg based on AUC exposure).
The incidence of testicular Leydig cell tumors increased significantly in male rats at all doses tested (≥1.5 times the clinical dose of 300 mg based on AUC exposure). The Leydig cell tumors are associated with an increase in luteinizing hormone (LH), which is a known mechanism of Leydig cell tumor formation in rats. In a 12-week clinical study, unstimulated LH did not increase in males treated with canagliflozin.
The incidence of pheochromocytomas and renal tubular tumors increased significantly in male and female rats given high doses of 100 mg/kg/day (approximately 12 times the clinical dose of 300 mg based on AUC exposure). Canagliflozin-induced renal tubule tumors and pheochromocytomas in rats may be caused by carbohydrate malabsorption; mechanistic clinical studies have not demonstrated carbohydrate malabsorption in humans at canagliflozin doses of up to 2 times the recommended clinical dose of 300 mg.
Genotoxicity: Canagliflozin was not mutagenic with or without metabolic activation in the Ames assay. Canagliflozin was mutagenic in the in vitro mouse lymphoma assay with but not without metabolic activation. Canagliflozin was not mutagenic or clastogenic in an in vivo oral micronucleus assay in rats and an in vivo oral Comet assay in rats.
Reproductive and Developmental Toxicology: In rat fertility studies, canagliflozin had no adverse effects on mating, fertility, or early embryonic development up to the highest dose of 100 mg/kg/day (up to 19 times the clinical dose of 300 mg based on AUC exposure), although there were slight sperm morphological changes at this dose level.
Canagliflozin was not teratogenic at any dose tested when administered orally to pregnant rats and rabbits during the period of organogenesis. In both rats and rabbits, a slight increase in the number of fetuses with reduced ossification, indicative of a slight developmental delay, was observed at the high doses (approximately 19 times the clinical dose of 300 mg based on AUC exposure) in the presence of maternal toxicity.
In a pre- and postnatal development study, canagliflozin administered orally to female rats from gestation Day 6 to lactation Day 20 resulted in decreased body weights in male and female offspring at maternally toxic doses of ≥ 30 mg/kg/day (≥ 5.9 times the clinical dose of 300 mg based on AUC exposure). Maternal toxicity was limited to decreased body weight gain.
Juvenile Toxicity: In a juvenile toxicity study in which canagliflozin was dosed orally to young rats from postnatal day (PND) 21 until PND 90 at doses of 4, 20, 65, or 100 mg/kg, increased kidney weights and a dose-related increase in the incidence and severity of renal pelvic and renal tubular dilatation were reported at all dose levels. Exposure at the lowest dose tested was approximately 0.5 times the maximum recommended clinical dose of 300 mg. The renal pelvic dilatations observed in juvenile animals did not fully reverse within the 1-month recovery period. Persistent renal findings in juvenile rats can most likely be attributed to reduced ability of the developing rat kidney to handle canagliflozin-increased urine volumes, as functional maturation of the rat kidney continues through 6 weeks of age. Additionally, shortened ulna growth and delays in sexual maturation were observed in juvenile rats at doses that were greater than or equal to 3 times and 9 times the clinical dose of 300 mg based on AUC exposure, respectively.
17 SUPPORTING PRODUCT MONOGRAPHS
- 1. PrINVOKANA® (canagliflozin tablets, 100 mg and 300 mg), submission control 280099, Product Monograph, Janssen Inc. Date of Revision: MAR 11, 2024.