


Product Monograph - Invokamet (Janssen, 50 mg / 850 mg, 150 mg / 850 mg)
SUMMARY PRODUCT INFORMATION
| Route of Administration | Dosage Form / Strength | Clinically Relevant Nonmedicinal Ingredients |
| Oral | Tablets Canagliflozin (on anhydrous basis) / metformin HCl 50 mg/500 mg, 50 mg/850 mg, 50 mg/1000 mg, 150 mg/500 mg, 150 mg/850 mg, 150 mg/1000 mg | For a complete listing see DOSAGE FORMS, COMPOSITION AND PACKAGING section. |
INDICATIONS AND CLINICAL USE
INVOKAMET® is indicated to improve glycemic control as an adjunct to diet and exercise in adult patients with type 2 diabetes mellitus inadequately controlled on:
- metformin
- a sulfonylurea in combination with metformin
- pioglitazone in combination with metformin
- insulin in combination with metformin
Or in patients already being treated and achieving glycemic control with:
- metformin and canagliflozin as separate tablets
- a sulfonylurea in combination with metformin and canagliflozin as separate tablets
- pioglitazone in combination with metformin and canagliflozin as separate tablets
- insulin in combination with metformin and canagliflozin as separate tablets
Geriatrics
Patients 65 years and older had a higher incidence of adverse reactions related to reduced intravascular volume with canagliflozin, including hypotension, postural dizziness, orthostatic hypotension, syncope, and dehydration. Reactions were more common in patients over 75 years of age and with the 300 mg daily dose (see WARNINGS AND PRECAUTIONS, ADVERSE REACTIONS and DOSAGE AND ADMINISTRATION). Smaller reductions in HbA1C with canagliflozin relative to placebo were seen in patients 65 years and older, compared to younger patients (see WARNINGS AND PRECAUTIONS, Special Populations). Treatment with INVOKAMET® can reduce renal function. Metformin is eliminated by the kidney, and the risk of serious adverse reactions to the drug is greater in patients with impaired renal function. INVOKAMET® should be used with caution as age increases. The dosage of INVOKAMET® should be adjusted based on renal function. Regular assessment of renal function is necessary (see WARNINGS AND PRECAUTIONS, DOSAGE AND ADMINISTRATION and ACTION AND CLINICAL PHARMACOLOGY, Pharmacokinetics).
Pediatrics
The safety and efficacy of INVOKAMET® in pediatric patients under 18 years of age have not been established. Therefore, INVOKAMET® should not be used in this population.
CONTRAINDICATIONS
- Known hypersensitivity to canagliflozin or metformin or to any ingredient in the formulation or component of the container. For a complete listing, see DOSAGE FORMS, COMPOSITION AND PACKAGING.
- In patients with serum creatinine levels above the upper limit of normal range or when renal function is not known, renal disease or renal dysfunction, e.g., as suggested by serum creatinine levels ≥136 μmol/L (males), ≥124 μmol/L (females), or abnormal creatinine clearance (<60 mL/min), which may result from conditions such as cardiovascular collapse (shock), acute myocardial infarction, and septicemia (see WARNINGS AND PRECAUTIONS).
- Acute or chronic metabolic acidosis, including diabetic ketoacidosis, with or without coma, history of ketoacidosis with or without coma, history of lactic acidosis, irrespective of precipitating factors (see WARNINGS AND PRECAUTIONS).
- Unstable and/or insulin-dependent (Type I) diabetes mellitus.
- Excessive alcohol intake, acute or chronic.
- Severe hepatic dysfunction, since severe hepatic dysfunction has been associated with some cases of lactic acidosis, INVOKAMET® (canagliflozin/metformin hydrochloride) should not be used in patients with clinical or laboratory evidence of hepatic disease (see WARNINGS AND PRECAUTIONS, Hepatic).
- Cardiovascular collapse and in disease states associated with hypoxemia such as cardiorespiratory insufficiency, which are often associated with hyperlactacidemia.
- Stress conditions, such as severe infections, trauma or surgery and the recovery phase thereafter.
- Severe dehydration.
- During pregnancy and breastfeeding (see WARNINGS AND PRECAUTIONS, Special Populations).
- Period around administration of iodinated contrast materials, because the use of such products may result in acute alteration of renal function (see WARNINGS AND PRECAUTIONS, Renal).
WARNINGS AND PRECAUTIONS
Serious Warnings and Precautions Lactic Acidosis
Diabetic Ketoacidosis
Lower Limb Amputation An increased risk of lower limb amputations associated with canagliflozin use versus placebo was observed in CANVAS (5.9 vs 2.8 events per 1000 patient-years) and CANVAS-R (7.5 vs 4.2 events per 1000 patient-years), two large, randomized, |
placebo-controlled trials in patients with type 2 diabetes who had established cardiovascular disease (CVD) or were at risk for CVD.
|
Cardiovascular
Canagliflozin
Lower limb amputation
An increased risk of lower limb amputations associated with canagliflozin use versus placebo was observed in CANVAS (5.9 and 2.8 amputations per 1000 patients -years) and CANVAS-R (7.5 vs 4.2 events per 1000 patient-years), two large, randomized, placebo-controlled trials evaluating patients with type 2 diabetes who had either established cardiovascular disease or were at risk for cardiovascular disease. The risk of lower limb amputations was observed at both the 100 mg and 300 mg once daily dosage regimens. The amputation data for CANVAS and CANVAS-R are shown in Table 6 and Table 7, respectively (see ADVERSE REACTIONS).
Amputations of the toe and midfoot (99 out of 140 patients with amputations receiving canagliflozin in the two trials) were the most frequent; however, amputations involving the leg, below and above the knee, were also observed (41 out of 140 patients with amputations receiving canagliflozin in the two trials). Some patients had multiple amputations, some involving both lower limbs. Lower limb infections, gangrene, and diabetic foot ulcers were the most common precipitating medical events leading to the need for an amputation. The risk of amputation was highest in patients with a baseline history of prior amputation, peripheral vascular disease, and neuropathy.
Before initiating INVOKAMET®, consider factors in the patient history that may predispose to the need for amputations, such as a history of prior amputation, peripheral vascular disease, neuropathy and diabetic foot ulcers. Counsel patients about the importance of routine preventative foot care and adequate hydration. Monitor patients receiving INVOKAMET® for signs and symptoms of infection (including osteomyelitis), new pain or tenderness, sores or ulcers involving the lower limbs, and discontinue INVOKAMET® if these complications occur.
Reduced Intravascular Volume
Due to its mechanism of action, canagliflozin increases urinary glucose excretion (UGE) and induces an osmotic diuresis, which may reduce intravascular volume. Patients most susceptible to adverse reactions related to reduced intravascular volume (e.g., postural dizziness, orthostatic hypotension, hypotension or renal failure) include patients with moderate renal impairment, elderly patients, patients on loop diuretics or medications that interfere with the renin-angiotensin-aldosterone system (e.g., angiotensin-converting-enzyme [ACE] inhibitors, angiotensin receptor blockers [ARBs]), and patients with low systolic blood pressure (see ADVERSE REACTIONS, DRUG INTERACTIONS and DOSAGE AND ADMINISTRATION). Before initiating INVOKAMET® in patients with one or more of these characteristics, volume status should be assessed and any volume depletion corrected. Caution should also be exercised in other patients for whom a drop in blood pressure could pose a risk, such as patients with known cardiovascular disease. Monitor for signs and symptoms after initiating therapy. Patients should be advised to report symptoms of reduced intravascular volume.
In placebo-controlled clinical studies of canagliflozin, increases in adverse reactions related to reduced intravascular volume were seen more commonly with the 300 mg canagliflozin dose and occurred most frequently in the first three months (see ADVERSE REACTIONS).
INVOKAMET® is not recommended for use in patients receiving loop diuretics (see ADVERSE REACTIONS and DOSAGE AND ADMINISTRATION) or who are volume depleted.
In case of intercurrent conditions that may lead to volume depletion (such as a gastrointestinal illness), careful monitoring of volume status (e.g., physical examination, blood pressure measurements, laboratory tests including renal function tests), and serum electrolytes is recommended. In the case of volume depletion, temporary interruption of treatment with INVOKAMET® may be considered until the condition is corrected, and more frequent glucose monitoring may be considered.
Metformin
Hypoxic States
Cardiovascular collapse (shock) from whatever cause (e.g., acute congestive heart failure, acute myocardial infarction and other conditions characterized by hypoxemia) have been associated with lactic acidosis and may also cause prerenal azotemia. When such events occur in patients on INVOKAMET® therapy, the drug should be promptly discontinued.
Endocrine and Metabolism
Canagliflozin
Diabetic ketoacidosis
Clinical trial and post-market cases of DKA, a serious life-threatening condition requiring urgent hospitalization, have been reported in patients with type 2 diabetes mellitus treated with SGLT2 inhibitors, including canagliflozin. Fatal cases of DKA have been reported in patients taking canagliflozin. In a number of reported cases, the presentation of the condition was atypical with blood glucose values below 13.9 mmol/L (250 mg/dL) (see ADVERSE REACTIONS).
INVOKAMET® should not be used in patients with type 1 diabetes. The diagnosis of T2DM should therefore be confirmed before initiating INVOKAMET®.
INVOKAMET® is not indicated and should not be used for the treatment of DKA or in patients with a history of DKA.
Patients with type 2 diabetes treated with INVOKAMET® who present with signs and symptoms consistent with severe metabolic acidosis should be assessed for ketoacidosis regardless of presenting blood glucose levels, as ketoacidosis associated with canagliflozin may be present even if blood glucose levels are less than 13.9 mmol/L (250 mg/dL).
The risk of DKA must be considered in the event of non-specific symptoms such as difficulty breathing, nausea, vomiting, abdominal pain, confusion, anorexia, excessive thirst and unusual fatigue or sleepiness.
If these symptoms occur, regardless of blood glucose level, INVOKAMET® treatment should be immediately discontinued, patients should be assessed for diabetic ketoacidosis immediately, and prompt treatment should be instituted.
SGLT2 inhibitors have been shown to increase blood ketones in clinical trial subjects. Conditions that can precipitate DKA while taking INVOKAMET® include patients on a very low carbohydrate diet (as the combination may further increase ketone body production), patients with conditions that lead to a restricted food intake or severe dehydration, patients with increased insulin requirements due to an acute medical illness, surgery, or alcohol abuse, patients with a low beta-cell function reserve [e.g., type 2 diabetes patients with low C-peptide or latent autoimmune diabetes in adults (LADA)], pancreatic disorders suggesting insulin deficiency (e.g., type 1 diabetes, history of pancreatitis, or pancreatic surgery), insulin dose reduction (including insulin pump failure), and patients with a history of ketoacidosis. These patients should be monitored closely. Caution should also be taken when reducing the insulin dose in patients requiring insulin (see DOSAGE AND ADMINISTRATION).
Temporarily discontinue treatment with INVOKAMET® in T2DM patients who are hospitalized for major surgical procedures, or will undergo scheduled surgery, and patients who are hospitalized for serious infections or acute serious medical illnesses. Monitoring for DKA is recommended in these patients even if INVOKAMET® treatment has been interrupted or discontinued. Ensure risk factors for ketoacidosis are resolved prior to restarting INVOKAMET®.
Educate patients on the signs and symptoms of ketoacidosis and instruct patients to discontinue INVOKAMET® and seek medical attention immediately if signs and symptoms occur.
Hypoglycemia in Add-on Therapy with other Antihyperglycemic Agents
When canagliflozin was used as add-on therapy with insulin or an insulin secretagogue (e.g., sulfonylurea), the incidence of hypoglycemia was increased over that of placebo. Therefore, to lower the risk of hypoglycemia, a dose reduction of insulin or an insulin secretagogue may be considered (see ADVERSE REACTIONS and DOSAGE AND ADMINISTRATION).
Increases in Low-Density Lipoprotein (LDL-C)
Dose-related increases in LDL-C are seen with canagliflozin treatment (see ADVERSE REACTIONS). LDL-C levels should be monitored.
Metformin
Hypoglycemia: Hypoglycemia does not occur in patients receiving metformin alone under usual circumstances of use, but could occur when caloric intake is deficient, when strenuous exercise is not compensated by caloric supplementation, or during concomitant use with other glucose lower agents or ethanol.
Elderly, debilitated, or malnourished patients and those with adrenal or pituitary insufficiency or alcohol intoxication are particularly susceptible to hypoglycemic effects. Hypoglycemia may be difficult to recognize in the elderly, and in people who are taking β-adrenergic blocking drugs.
Lactic Acidosis: Lactic acidosis is a rare, but serious, metabolic complication that occurs due to metformin accumulation during treatment with INVOKAMET®. When it occurs, it is fatal in approximately 50% of cases. Lactic acidosis may also occur in association with a number of pathophysiologic conditions, including diabetes mellitus, and whenever there is significant tissue hypoperfusion and hypoxemia. Lactic acidosis is characterized by elevated blood lactate levels (> 5 mmol/L), decreased blood pH, electrolyte disturbances with an increased anion gap, and an increased lactate/pyruvate ratio. When metformin is implicated as the cause of lactic acidosis, metformin plasma levels >5 μg/mL are generally found.
The reported incidence of lactic acidosis in patients receiving metformin HCl is very low (approximately 0.03 cases / 1000 patient-years, with approximately 0.015 fatal cases / 1000 patient-years) and occurs primarily in diabetic patients with significant renal insufficiency, including both intrinsic renal disease and renal hypoperfusion, often in the setting of multiple concomitant medical/surgical problems and multiple concomitant medications. Patients with congestive heart failure requiring pharmacologic management, in particular those with unstable or acute congestive heart failure who are at risk of hypoperfusion and hypoxemia, are at increased risk of lactic acidosis. In particular, treatment of the elderly should be accompanied by careful monitoring of renal function. INVOKAMET® treatment should not be initiated in patients ≥80 years of age, unless measurement of creatinine clearance demonstrates that renal function is not reduced, as the patients are more susceptible to developing lactic acidosis. The risk of lactic acidosis increases with the degree of renal dysfunction and the patient’s age. The risk of lactic acidosis may, therefore, be significantly decreased by regular monitoring of renal function in patients taking metformin and by use of the minimum effective dose of metformin. In addition, INVOKAMET® should be promptly withheld in the presence of any condition associated with hypoxemia, dehydration or sepsis. Because impaired hepatic function may significantly limit the ability to clear lactate, INVOKAMET® should generally be avoided in patients with clinical or laboratory evidence of hepatic disease. Patients should be cautioned against excessive alcohol intake, either acute or chronic, when taking metformin (metformin HCl), since alcohol intake potentiates the effect of metformin HCl on lactate metabolism. In addition, INVOKAMET® should be temporarily discontinued prior to any intravascular radiocontrast study and for any surgical procedure.
The onset of lactic acidosis is often subtle, and accompanied only by nonspecific symptoms such as malaise, myalgia, respiratory distress, increasing somnolence and non-specific abdominal distress. There may be associated hypothermia, hypotension and resistance bradyarrhythmias with more marked acidosis. The patient and the patient’s physician must be aware of the possible importance of such symptoms and the patient should be instructed to notify the physician immediately if they occur. INVOKAMET® should be withdrawn until the situation is clarified. Serum electrolytes, ketones, blood glucose and, if indicated, blood pH, lactate levels and even blood metformin levels may be useful. Once a patient is stabilized on any dose level of metformin, gastrointestinal symptoms, which are common during initiation of therapy, are unlikely to be drug related. Later occurrence of gastrointestinal symptoms could be due to lactic acidosis or other serious disease. In patients taking metformin, levels of fasting venous plasma lactate above the upper limit of normal but less than 5 mmol/L, do not necessarily indicate impending lactic acidosis and may be explainable by other mechanisms, such as poorly controlled diabetes or obesity, vigorous physical activity or technical problems in sample handling. Lactic acidosis should be suspected in any diabetic patient with metabolic acidosis lacking evidence of ketoacidosis (ketonuria and ketonemia).
Lactic acidosis is a medical emergency that must be treated in a hospital setting. In a patient with lactic acidosis who is taking INVOKAMET®, the drug should be discontinued immediately and general supportive measures should be promptly instituted. Because metformin HCl is dialysable (with clearance of up to 170 mL/min under good hemodynamic conditions), prompt hemodialysis is recommended to correct the acidosis and remove the accumulated metformin.
Physicians should instruct their patients to recognize the symptoms which could be signal onset of lactic acidosis. If acidosis of any kind develops, INVOKAMET® should be discontinued immediately and the patient should be immediately hospitalized.
Change in Clinical Status in Patients with Previously Controlled Type 2 Diabetes: A patient with type 2 diabetes previously well-controlled on INVOKAMET® who develops
laboratory abnormalities or clinical illness (especially vague and poorly defined illness) should be evaluated promptly for evidence of ketoacidosis or lactic acidosis. Evaluation should include serum electrolytes and ketones, blood glucose and, if indicated, blood pH, lactate, pyruvate, and metformin levels. If acidosis of either form occurs, INVOKAMET® must be stopped immediately and other appropriate corrective measures initiated.
Loss of control of blood glucose: When a patient stabilized on any diabetic regimen is exposed to stress such as fever, trauma, infection, or surgery, a temporary loss of glycemic control may occur. At such times, it may be necessary to withhold INVOKAMET® and temporarily administer insulin. INVOKAMET® may be reinstituted after the acute episode is resolved.
Vitamin B12 levels: In controlled clinical trials of metformin of 29-week duration, a decrease to subnormal levels of previously normal serum Vitamin B12 levels, without clinical manifestations, was observed in approximately 7% of patients. Such decrease, possibly due to interference with B12 absorption from the B12-intrinsic factor complex, is, however, very rarely associated with anemia and appears to be rapidly reversible with discontinuation of metformin or Vitamin B12 supplementation. Measurement of hematologic parameters on an annual basis is advised in patients on metformin and any apparent abnormalities should be appropriately investigated and managed (see WARNINGS AND PRECAUTIONS, Monitoring and Laboratory Tests). Certain individuals (those with inadequate Vitamin B12 or calcium intake or absorption) appear to be predisposed to developing subnormal Vitamin B12 levels. Measurements of serum Vitamin B12 are advisable at least every one to two years in patients on long term INVOKAMET® therapy.
Genitourinary
Canagliflozin
Genital Mycotic Infections
Canagliflozin increases the risk of genital mycotic infections, consistent with the mechanism of increased urinary glucose. Patients with a history of genital mycotic infections and uncircumcised males were more likely to develop genital mycotic infections (see ADVERSE REACTIONS).
Urinary tract infections (including urosepsis and pyelonephritis)
Treatment with canagliflozin increases the risk for urinary tract infections (see ADVERSE REACTIONS). There have been post-marketing reports of serious urinary tract infections, including urosepsis and pyelonephritis, requiring hospitalization in patients treated with canagliflozin.
Fournier’s gangrene (necrotizing fasciitis of the perineum)
Post-marketing cases of necrotizing fasciitis of the perineum (Fournier’s gangrene), a rare but serious and potentially life-threatening necrotizing infection requiring urgent surgical intervention, have been reported in female and male patients with diabetes mellitus receiving SGLT2 inhibitors, including INVOKAMET®. Serious outcomes have included hospitalization, multiple surgeries, and death.
Patients treated with INVOKAMET® who present with pain or tenderness, erythema, or swelling in the genital or perineal area, with or without fever, or malaise should be evaluated for necrotizing fasciitis. If suspected, INVOKAMET® should be discontinued and prompt treatment should be instituted (including broad-spectrum antibiotics and surgical debridement if necessary).
Hematologic
Canagliflozin
Elevated Hemoglobin and Hematocrit
Mean hemoglobin and hematocrit increased in patients administered canagliflozin, as did the frequency of patients with abnormally elevated values for hemoglobin/hematocrit (see ADVERSE REACTIONS). INVOKAMET® should be used with caution in patients with an elevated hematocrit.
Hepatic
Metformin
INVOKAMET® is contraindicated in patients with clinical or laboratory evidence of hepatic disease (see CONTRAINDICATIONS). Impaired hepatic function has been associated with some cases of lactic acidosis.
Immune
Hypersensitivity
Serious hypersensitivity reactions, including angioedema and anaphylaxis, have been reported post-market in patients treated with canagliflozin. If a hypersensitivity reaction is suspected, discontinue INVOKAMET®, assess for other potential causes and initiate alternative treatment for diabetes (see ADVERSE REACTIONS, Post-Market Adverse Drug Reactions).
Musculoskeletal
Canagliflozin
An increased risk of bone fracture, occurring as early as 12 weeks after treatment initiation, was observed in patients using canagliflozin in the CANVAS cardiovascular outcomes trial. Consider factors that contribute to fracture risk prior to initiating canagliflozin (see ADVERSE REACTIONS, Bone fractures).
Peri-Operative Considerations
Metformin
INVOKAMET® therapy should be temporarily discontinued for any surgical procedure (except minor procedures not associated with restricted intake of food and fluids). INVOKAMET® should be discontinued 2 days before surgical intervention and should not be restarted until the patient's oral intake has resumed and renal function has been evaluated as normal.
Renal
Impairment of renal function
Canagliflozin
Canagliflozin increases serum creatinine and decreases eGFR in a dose dependent fashion. In clinical trials, renal function abnormalities have occurred after initiating canagliflozin. Post-marketing cases of acute kidney injury, including acute renal failure and a decline in eGFR, some requiring hospitalization and dialysis, shortly after initiation of canagliflozin treatment have been reported. Before initiating INVOKAMET®, consider factors that may predispose patients to acute kidney injury including hypovolemia, chronic renal insufficiency, congestive heart failure and concomitant medications (diuretics, ACE inhibitors, ARBs, NSAIDs) (see WARNINGS AND PRECAUTIONS, Cardiovascular and ADVERSE REACTIONS). Consider temporarily discontinuing INVOKAMET® in any setting of reduced oral intake (such as acute illness or fasting) or fluid losses (such as gastrointestinal illness or excessive heat exposure); monitor patients for signs and symptoms of acute kidney injury. If acute kidney injury occurs, discontinue INVOKAMET® promptly and institute treatment.
Renal function should be assessed prior to initiation of INVOKAMET® and regularly thereafter. More frequent renal function monitoring is recommended in patients whose eGFR decreases to < 60 mL/min/1.73 m2 after initiating treatment.
Metformin
Metformin is excreted by the kidney, and the risk of metformin accumulation and lactic acidosis increases with the degree of impairment of renal function. Thus, patients with serum creatinine levels above the upper limit of the normal range for their age should not receive INVOKAMET®. Before initiation of INVOKAMET® therapy and every 6 months while on INVOKAMET® therapy, renal function should be assessed and verified as being within normal range.
Decreased renal function occurs more commonly in elderly patients and can be asymptomatic. In patients in whom development of renal dysfunction is anticipated, renal function should be assessed more frequently and INVOKAMET® discontinued if evidence of renal impairment is present.
Special caution should be exercised in situations where renal function may become impaired, for example when initiating antihypertensive therapy or diuretic therapy and when starting therapy with an NSAID.
Use of Concomitant Medications that May Affect Renal Function or Metformin Disposition: Concomitant medication(s) that may affect renal function or result in a significant hemodynamic change or interfere with the disposition of metformin such as cationic drugs that are eliminated by renal tubular secretion should be used with caution (see DRUG INTERACTIONS).
Administration of Iodinated Contrast Agent: Intravascular contrast studies with iodinated materials can lead to acute alteration of renal function and have been associated with lactic acidosis in patients receiving metformin (see CONTRAINDICATIONS). Therefore, in patients in whom any such study is planned, INVOKAMET® should be temporarily discontinued at the time of or prior to the procedure, and withheld for 48 hours subsequent to the procedure and reinstituted only after renal function has been re-evaluated and found to be normal.
Use in renal impairment: INVOKAMET® is contraindicated in patients with serum creatinine levels above the upper limit of normal range, as suggested by serum creatinine levels ≥136 μmol/L (males), ≥124 μmol/L (females) or abnormal creatinine clearance (<60 mL/min).
Special Populations
Pregnant Women: INVOKAMET® is contraindicated in pregnancy (see CONTRAINDICATIONS). There are no adequate and well-controlled studies in pregnant women with INVOKAMET® or its individual components, therefore, the safety of INVOKAMET® in pregnant women is not known.
Canagliflozin
Based on results from rat studies, canagliflozin may affect renal development and maturation. In a juvenile rat study, increased kidney weights and renal pelvic and tubular dilatation were evident at greater than or equal to 0.5 times clinical exposure from a 300 mg dose (see TOXICOLOGY).
Metformin hydrochloride
Metformin was not teratogenic in rats and rabbits at doses up to 600 mg/kg/day, or about two times the maximum recommended human daily dose on a body surface area basis. Determination of fetal concentrations demonstrated a partial placental barrier to metformin. Because animal reproduction studies are not always predictive of human response, metformin is contraindicated during pregnancy (see CONTRAINDICATIONS).
Nursing Women: INVOKAMET® is contraindicated during nursing (see CONTRAINDICATIONS). No studies in lactating animals have been conducted with INVOKAMET® or its individual components.
Canagliflozin
It is not known if canagliflozin is excreted in human milk. Available pharmacodynamic/toxicological data in animals have shown excretion of canagliflozin in the milk of lactating rats reaching levels which are approximately 1.4 times higher than plasma systemic exposure. Data in juvenile rats directly exposed to canagliflozin showed risk to the developing kidney (renal pelvic and tubular dilatations) during maturation.
Metformin
Studies in lactating rats show that metformin is excreted into milk and reaches levels comparable to those in plasma. Metformin is excreted into human breast milk.
Pediatrics: Safety and effectiveness of INVOKAMET® in pediatric patients under 18 years of age have not been established. Therefore, INVOKAMET® should not be used in this population.
Geriatrics: Metformin is eliminated by the kidney. INVOKAMET® treatment is associated with reduced renal function and should be used with caution as age increases because elderly patients are more likely to have decreased renal function (see WARNINGS AND PRECAUTIONS, Renal and DOSAGE AND ADMINISTRATION, Geriatrics).
Canagliflozin
Two thousand thirty-four (2,034) patients 65 years and older, and 345 patients 75 years and older were exposed to canagliflozin in nine clinical studies of canagliflozin (see CLINICAL TRIALS).
Patients 65 years and older had a higher incidence of adverse reactions related to reduced intravascular volume with canagliflozin (such as hypotension, postural dizziness, orthostatic hypotension, syncope, and dehydration), particularly with the 300 mg daily dose, compared to younger patients; more prominent increase in the incidence was seen in patients who were 75 years and older (see DOSAGE AND ADMINISTRATION and ADVERSE REACTIONS). Smaller reductions in HbA1C with canagliflozin relative to placebo were seen in older (65 years and older; -0.61% with canagliflozin 100 mg and -0.74% with canagliflozin 300 mg relative to placebo) compared to younger patients (-0.72% with canagliflozin 100 mg and -0.87% with canagliflozin 300 mg relative to placebo).
Metformin hydrochloride
Controlled clinical studies of metformin did not include sufficient numbers of elderly patients to determine whether they respond differently from younger patients, although other reported clinical experience has not identified differences in responses between the elderly and younger patients. Metformin is known to be substantially excreted by the kidney and because the risk of serious adverse reactions to the drug is greater in patients with impaired renal function, metformin should only be used in patients with normal renal function (see CONTRAINDICATIONS). Because aging is associated with reduced renal function, INVOKAMET® should be used with caution as age increases.
Hepatic Impairment: INVOKAMET® is contraindicated in patients with clinical or laboratory evidence of hepatic disease. INVOKAMET® has not been studied in patients with hepatic impairment. Metformin use in patients with impaired hepatic function has been associated with some cases of lactic acidosis. Canagliflozin has not been studied in patients with severe hepatic impairment.
Monitoring and Laboratory Tests
Blood Glucose and HbA1c: Response to INVOKAMET® treatment should be monitored by periodic measurements of blood glucose and HbA1c levels. Due to its mechanism of action, patients taking INVOKAMET® will test positive for glucose in their urine.
Renal function
Renal function should be assessed prior to initiation of INVOKAMET® and regularly thereafter (see DOSAGE AND ADMINISTRATION). INVOKAMET® is contraindicated in patients with a serum creatinine level above the upper limit of normal range [serum creatinine levels ≥ 136 µmol/L (males) or ≥ 124µmol/L females)], abnormal creatinine clearance (<60 mL/min), or when renal function is not known (see CONTRAINDICATIONS).
Reduced intravascular volume
INVOKAMET® is not recommended for use in patients who are volume depleted. Before initiating INVOKAMET®, assess volume status, particularly in patients at risk (e.g., moderate renal impairment, the elderly, in patients with low systolic blood pressure, or if on a loop diuretic, angiotensin-converting enzyme inhibitor, or angiotensin receptor blocker).
In patients with volume depletion, the condition should be corrected prior to initiation of INVOKAMET® (see DOSAGE AND ADMINISTRATION).
For patients with risk factors for volume depletion or in case of intercurrent conditions that may lead to volume depletion (such as a gastrointestinal illness), careful monitoring of volume status (e.g., physical examination, blood pressure measurements, laboratory tests including renal function tests), and serum electrolytes is recommended during treatment with INVOKAMET®. Temporary interruption of treatment with INVOKAMET® should be considered until volume depletion is corrected.
LDL-cholesterol
LDL-C levels should be measured at baseline and at regular intervals during treatment with INVOKAMET® due to dose-dependent increases in LDL-C seen with therapy.
Digoxin levels
In patients taking digoxin and canagliflozin 300 mg once daily for seven days, there was an increase in the total exposure (AUC) and peak drug concentration (Cmax) of digoxin (20% and 36%, respectively), therefore patients taking INVOKAMET® concomitantly with digoxin should be monitored appropriately.
Hematology
Initial and periodic monitoring of hematologic parameters (e.g., hemoglobin/hematocrit and red blood cell indices) should be performed regularly. While megaloblastic anemia has rarely been seen with metformin therapy, if this is suspected, Vitamin B12 deficiency should be excluded.
ADVERSE REACTIONS
Adverse Drug Reaction Overview
There have been no clinical studies conducted with INVOKAMET® (canagliflozin/metformin hydrochloride) tablets. INVOKAMET® tablets demonstrated comparable bioavailability of canagliflozin and metformin with co-administered tablets of canagliflozin and metformin in comparative bioavailability studies (see ACTION AND CLINICAL PHARMACOLOGY, Pharmacokinetics).
Canagliflozin
The safety of canagliflozin was evaluated in fifteen double-blind, controlled Phase 3 and Phase 4 clinical studies involving 22,645 patients with type 2 diabetes, including 13,278 patients treated with canagliflozin 100 mg and 7,170 patients, treated with canagliflozin 300 mg. Of the 22,645 patients with type 2 diabetes, a total of 10,134 patients were treated in two dedicated cardiovascular outcomes studies, for a mean exposure duration of 149 weeks (223 weeks in CANVAS and 94 weeks in CANVAS-R), and 8,114 patients were treated in 12 double-blind, controlled Phase 3 and Phase 4 clinical studies, for a mean exposure duration of 49 weeks. In a dedicated renal outcomes study, a total of 4,397 patients with type 2 diabetes and diabetic nephropathy had a mean duration of drug exposure of 115 weeks.
The primary assessment of safety and tolerability was conducted in a pooled analysis (N=2313) of four 26-week placebo-controlled clinical studies (monotherapy and add-on therapy with metformin, metformin and sulfonylurea, and metformin and pioglitazone). The most commonly reported adverse reactions during treatment (≥ 5%) were vulvovaginal candidiasis, urinary tract infection (UTI), and polyuria or pollakiuria. Adverse reactions leading to discontinuation of ≥ 0.5% of all canagliflozin-treated patients in these studies were vulvovaginal candidiasis (0.7% of females) and balanitis or balanoposthitis (0.5% of males).
A total of 8 serious adverse drug reactions were reported in the primary placebo-controlled safety population, including 5 reports from patients taking canagliflozin 100 mg daily (2 urticaria, 2 UTI, and 1 nausea), 2 reports from patients taking canagliflozin 300 mg daily (1 UTI, 1 constipation) and 1 report from a patient in the placebo group (reduced intravascular volume). Of these serious adverse reactions, 2 led to discontinuation in the canagliflozin group (UTI and urticaria).
Metformin hydrochloride
Lactic acidosis: very rare (<1/10, 000 and isolated reports) (see WARNINGS AND PRECAUTIONS, and OVERDOSAGE).
Gastrointestinal Reactions: very common (>1/10). Gastrointestinal symptoms (diarrhea, nausea, vomiting, abdominal bloating, flatulence, and anorexia) are the most common reactions to metformin and are approximately 30% more frequent in patients on metformin monotherapy than in placebo-treated patients, particularly during initiation of metformin therapy. These symptoms are generally transient and resolve spontaneously during continued treatment.
Because significant diarrhea and/or vomiting can cause dehydration and prerenal azotemia, metformin should be temporarily discontinued, under such circumstances.
For patients who have been stabilized on metformin, nonspecific gastrointestinal symptoms should not be attributed to therapy unless intercurrent illness or lactic acidosis have been excluded.
Special Senses: common (≥1/100): taste disturbance, i.e. metallic taste.
Dermatologic Reactions: very rare (<1/10,000 and isolated reports): Reports of skin reactions such as erythema, pruritus, and urticaria are very rare.
Hematologic: During controlled clinical trials of 29 weeks duration, approximately 9% of patients on metformin monotherapy developed asymptomatic subnormal serum Vitamin B12 levels; serum folic acid levels did not decrease significantly. Five cases of megaloblastic anemia have been reported with metformin administration and no increased incidence of neuropathy has been observed. (See WARNINGS AND PRECAUTIONS, Endocrine and Metabolism).
Decrease of Vitamin B12 absorption with decrease of serum levels during long-term use of metformin is rare (≥1/10,000 and <1/1,000). Consideration of such etiology is recommended if a patient presents with megaloblastic anemia.
Hepatic: very rare (<1/10,000 and isolated reports). Liver function tests abnormalities or hepatitis resolving upon metformin discontinuation has been documented in isolated reports.
Canagliflozin and Metformin
The incidence and type of adverse reactions in 26-week placebo-controlled metformin add-on studies were similar to the adverse reactions in the four 26-week placebo-controlled clinical studies used for the primary assessment of safety and tolerability. There were no additional adverse reactions identified in the pooling of these three placebo-controlled studies that included metformin relative to the four placebo-controlled studies.
Clinical Trial Adverse Drug Reactions
Because clinical trials are conducted under very specific conditions the adverse reaction rates observed in the clinical trials may not reflect the rates observed in practice and should not be compared to the rates in the clinical trials of another drug. Adverse drug reaction information from clinical trials is useful for identifying drug-related adverse events and for approximating rates.
Table 1 to Table 4 include treatment-emergent adverse events (TEAEs) reported in ≥ 2% of canagliflozin-treated patients.
Combination with Metformin (Studies DIA3006 and DIA3009)
The incidence of adverse events, reported regardless of causality in ≥ 2% of patients treated with canagliflozin 100 mg or 300 mg and more frequently than in the placebo groups, in studies of canagliflozin as add-on combination therapy with metformin, is provided in Table 1. The core assessment period was 26 weeks for the placebo- and active-controlled study versus sitagliptin (DIA3006) and 52 weeks for the active-controlled study versus glimepiride (DIA3009).
| Table 1: Adverse events (regardless of causality) reported in ≥ 2% of patients treated with canagliflozin and more frequently than in the placebo groups* in double-blind clinical trials of canagliflozin in add-on combination use with metformin, and compared to sitagliptin or placebo (Study DIA3006) or to glimepiride (Study DIA3009) | |||||||||||||||||||||
|---|---|---|---|---|---|---|---|---|---|---|---|---|---|---|---|---|---|---|---|---|---|
| Study DIA3006 (26 weeks) | Study DIA3009 (52 weeks) | ||||||||||||||||||||
System Organ Class / Preferred Term | Placebo + Metformin n=183 n (%) | Canagliflozin 100 mg + Metformin n=368 n (%) | Canagliflozin 300 mg + Metformin N=367 n (%) | Sitagliptin 100 mg + Metformin n=366 n (%) | Canagliflozin 100 mg + Metformin n=483 n (%) | Canagliflozin 300 mg + Metformin n=485 n (%) | Glimepiride + Metformin n=482 n (%) | ||||||||||||||
| Gastrointestinal Disorders | |||||||||||||||||||||
| Diarrhea | 12 (6.6) | 12 (3.3) | 18 (4.9) | 16 (4.4) | 24 (5.0) | 33 (6.8) | 29 (6.0) | ||||||||||||||
| Gastritis | 3 (1.6) | 3 (0.8) | 8 (2.2) | 3 (0.8) | 2 (0.4) | 5 (1.0) | 7 (1.5) | ||||||||||||||
| Nausea | 3 (1.6) | 11 (3.0) | 8 (2.2) | 5 (1.4) | 16 (3.3) | 25 (5.2) | 13 (2.7) | ||||||||||||||
| Toothache | 2 (1.1) | 3 (0.8) | 8 (2.2) | 4 (1.1) | 8 (1.7) | 7 (1.4) | 6 (1.2) | ||||||||||||||
| Vomiting | 1 (0.5) | 8 (2.2) | 1 (0.3) | 3 (0.8) | 9 (1.9) | 7 (1.4) | 8 (1.7) | ||||||||||||||
| General Disorders and Administration Site Conditions | |||||||||||||||||||||
| Fatigue | 2 (1.1) | 10 (2.7) | 8 (2.2) | 1 (0.3) | 9 (1.9) | 7 (1.4) | 10 (2.1) | ||||||||||||||
| Pyrexia | 3 (1.6) | 4 (1.1) | 5 (1.4) | 3 (0.8) | 11 (2.3) | 9 (1.9) | 7 (1.5) | ||||||||||||||
| Thirst | 0 | 2 (0.5) | 4 (1.1) | 0 | 8 (1.7) | 14 (2.9) | 0 | ||||||||||||||
| Infections and Infestations | |||||||||||||||||||||
| Bronchitis | 2 (1.1) | 2 (0.5) | 5 (1.4) | 9 (2.5) | 11 (2.3) | 9 (1.9) | 10 (2.1) | ||||||||||||||
| Gastroenteritis | 2 (1.1) | 3 (0.8) | 3 (0.8) | 2 (0.5) | 3 (0.6) | 15 (3.1) | 9 (1.9) | ||||||||||||||
| Influenza | 5 (2.7) | 6 (1.6) | 4 (1.1) | 8 (2.2) | 17 (3.5) | 17 (3.5) | 8 (1.7) | ||||||||||||||
| Sinusitis | 3 (1.6) | 8 (2.2) | 2 (0.5) | 6 (1.6) | 7 (1.4) | 13 (2.7) | 6 (1.2) | ||||||||||||||
| Urinary Tract Infection | 4 (2.2) | 19 (5.2) | 13 (3.5) | 12 (3.3) | 27 (5.6) | 24 (4.9) | 18 (3.7) | ||||||||||||||
| Vaginal Infection | 0 | 2 (0.5) | 3 (0.8) | 1 (0.3) | 11 (2.3) | 7 (1.4) | 1 (0.2) | ||||||||||||||
| Vulvovaginal Mycotic Infection | 0 | 10 (2.7) | 7 (1.9) | 1 (0.3) | 6 (1.2) | 14 (2.9) | 4 (0.8) | ||||||||||||||
| Musculoskeletal and Connective Tissue Disorders | |||||||||||||||||||||
| Back Pain | 6 (3.3) | 8 (2.2) | 12 (3.3) | 4 (1.1) | 29 (6.0) | 18 (3.7) | 20 (4.1) | ||||||||||||||
| Musculoskeletal Pain | 1 (0.5) | 3 (0.8) | 6 (1.6) | 5 (1.4) | 9 (1.9) | 10 (2.1) | 9 (1.9) | ||||||||||||||
| Psychiatric Disorders | |||||||||||||||||||||
| Insomnia | 0 | 3 (0.8) | 0 | 1 (0.3) | 7 (1.4) | 10 (2.1) | 6 (1.2) | ||||||||||||||
| Renal and Urinary Disorders | |||||||||||||||||||||
| Pollakiuria | 1 (0.5) | 21 (5.7) | 10 (2.7) | 2 (0.5) | 12 (2.5) | 12 (2.5) | 1 (0.2) | ||||||||||||||
| Reproductive System and Breast Disorders | |||||||||||||||||||||
| Balanoposthitis | 1 (0.5) | 2 (0.5) | 1 (0.3) | 0 | 4 (0.8) | 13 (2.7) | 2 (0.4) | ||||||||||||||
| Vulvovaginal Pruritus | 0 | 4 (1.1) | 5 (1.4) | 1 (0.3) | 6 (1.2) | 20 (4.1) | 1 (0.2) | ||||||||||||||
*In either study
Combination with a Metformin and a Sulfonylurea (Studies DIA3002 and DIA3015)
The incidence of adverse events, reported regardless of causality in ≥ 2% of patients treated with canagliflozin 100 mg or 300 mg and more frequently than in the placebo groups, in studies of canagliflozin as add-on combination therapy with metformin and a sulfonylurea, is provided in Table 2. The core assessment period was 26 weeks for the placebo-controlled study (DIA3002) and 52 weeks for the active-controlled study with sitagliptin (DIA3015).
| Table 2: Adverse events (regardless of causality) reported in ≥ 2% of patients treated with canagliflozin and more frequently than in the placebo groups* in double-blind clinical trials of canagliflozin in add-on combination use with metformin and a sulfonylurea, and compared to placebo (Study DIA3002) or sitagliptin (Study DIA3015) | |||||||||||||||||
|---|---|---|---|---|---|---|---|---|---|---|---|---|---|---|---|---|---|
| Study DIA3002 (26 weeks) | Study DIA3015 (52 weeks) | ||||||||||||||||
System Organ Class / Preferred Term | Placebo+ Metformin + Sulfonylurea n=156 n (%) | Canagliflozin 100 mg + Metformin + Sulfonylurea n=157 n (%) | Canagliflozin 300 mg + Metformin + Sulfonylurea N=156 n (%) | Canagliflozin 300 mg + Metformin + Sulfonylurea n=377 n (%) | Sitagliptin 100 mg+ Metformin + Sulfonylurea n=378 n (%) | ||||||||||||
| Ear and Labyrinth Disorders | |||||||||||||||||
| Vertigo | 1 (0.6) | 1 (0.6) | 1 (0.6) | 14 (3.7) | 11 (2.9) | ||||||||||||
| Gastrointestinal Disorders | |||||||||||||||||
| Abdominal Pain | 1 (0.6) | 2 (1.3) | 1 (0.6) | 8 (2.1) | 6 (1.6) | ||||||||||||
| Abdominal Pain Upper | 2 (1.3) | 1 (0.6) | 1 (0.6) | 10 (2.7) | 2 (0.5) | ||||||||||||
| Constipation | 0 | 4 (2.5) | 5 (3.2) | 9 (2.4) | 3 (0.8) | ||||||||||||
| Diarrhea | 5 (3.2) | 5 (3.2) | 10 (6.4) | 17 (4.5) | 26 (6.9) | ||||||||||||
| Nausea | 1 (0.6) | 2 (1.3) | 4 (2.6) | 9 (2.4) | 11 (2.9) | ||||||||||||
| Infections and Infestations | |||||||||||||||||
| Bronchitis | 3 (1.9) | 4 (2.5) | 3 (1.9) | 1 (0.3) | 11 (2.9) | ||||||||||||
| Influenza | 7 (4.5) | 2 (1.3) | 3 (1.9) | 22 (5.8) | 15 (4.0) | ||||||||||||
| Nasopharyngitis | 4 (2.6) | 6 (3.8) | 8 (5.1) | 33 (8.8) | 38 (10.1) | ||||||||||||
| Sinusitis | 3 (1.9) | 4 (2.5) | 2 (1.3) | 8 (2.1) | 8 (2.1) | ||||||||||||
| Tooth Abscess | 0 | 4 (2.5) | 1 (0.6) | 0 | 2 (0.5) | ||||||||||||
| Upper Respiratory Tract Infection | 10 (6.4) | 17 (10.8) | 6 (3.8) | 33 (8.8) | 21 (5.6) | ||||||||||||
| Urinary Tract Infection | 8 (5.1) | 9 (5.7) | 8 (5.1) | 15 (4.0) | 19 (5.0) | ||||||||||||
| Vulvovaginal Mycotic Infection | 2 (1.3) | 8 (5.1) | 8 (5.1) | 12 (3.2) | 5 (1.3) | ||||||||||||
| Metabolism and Nutrition Disorders | |||||||||||||||||
| Decreased Appetite | 1 (0.6) | 0 | 4 (2.6) | 4 (1.1) | 5 (1.3) | ||||||||||||
| Hypoglycemia | 6 (3.8) | 11 (7.0) | 9 (5.8) | 66 (17.5) | 75 (19.8) | ||||||||||||
| Musculoskeletal and Connective Tissue Disorders | |||||||||||||||||
| Arthralgia | 4 (2.6) | 7 (4.5) | 7 (4.5) | 17 (4.5) | 8 (2.1) | ||||||||||||
| Back Pain | 4 (2.6) | 2 (1.3) | 5 (3.2) | 8 (2.1) | 15 (4.0) | ||||||||||||
| Musculoskeletal Pain | 1 (0.6) | 0 | 3 (1.9) | 8 (2.1) | 6 (1.6) | ||||||||||||
| Nervous System Disorders | |||||||||||||||||
| Headache | 4 (2.6) | 5 (3.2) | 2 (1.3) | 29 (7.7) | 27 (7.1) | ||||||||||||
| Renal and Urinary Disorders | |||||||||||||||||
| Pollakiuria | 1 (0.6) | 4 (2.5) | 3 (1.9) | 6 (1.6) | 5 (1.3) | ||||||||||||
| Reproductive System and Breast Disorders | |||||||||||||||||
| Vulvovaginal Pruritus | 0 | 1 (0.6) | 3 (1.9) | 15 (4.0) | 1 (0.3) | ||||||||||||
*In either study
Combination with Metformin and Pioglitazone (Study DIA3012)
The incidence of adverse events, reported regardless of causality in ≥ 2% of patients treated with canagliflozin 100 mg or 300 mg and more frequently than in the placebo group, in a study of canagliflozin as add-on combination therapy with metformin and pioglitazone, is provided in Table 3. The core assessment period was 26 weeks for this placebo-controlled study.
| Table 3: Adverse events (regardless of causality) reported in ≥ 2% of patients treated with canagliflozin and more frequently than in the placebo group in a double-blind clinical trial of canagliflozin in add-on combination use with metformin and pioglitazone, and compared to placebo (Study DIA3012) | |||
|---|---|---|---|
SYSTEM ORGAN CLASS / Preferred Term | Placebo + Metformin+ Pioglitazone n=115 n (%) | Canagliflozin 100 mg + Metformin + Pioglitazone n=113 n (%) | Canagliflozin 300 mg + Metformin + Pioglitazone n=114 n (%) |
| Gastrointestinal Disorders | |||
| Gastritis | 2 (1.7) | 4 (3.5) | 0 |
| General Disorders And Administration Site Conditions | |||
| Fatigue | 2 (1.7) | 1 (0.9) | 4 (3.5) |
| Edema Peripheral | 2 (1.7) | 2 (1.8) | 4 (3.5) |
| Thirst | 0 | 5 (4.4) | 4 (3.5) |
| Infections And Infestations | |||
| Nasopharyngitis | 6 (5.2) | 6 (5.3) | 11 (9.6) |
| Sinusitis | 2 (1.7) | 1 (0.9) | 3 (2.6) |
| Upper Respiratory Tract Infection | 7 (6.1) | 9 (8.0) | 5 (4.4) |
| Vulvovaginal Candidiasis | 0 | 1 (0.9) | 3 (2.6) |
| Vulvovaginal Mycotic Infection | 0 | 3 (2.7) | 6 (5.3) |
| Investigations | |||
| Weight Decreased | 1 (0.9) | 1 (0.9) | 3 (2.6) |
| Metabolism And Nutrition Disorders | |||
| Hypoglycemia | 2 (1.7) | 1 (0.9) | 6 (5.3) |
| Musculoskeletal And Connective Tissue Disorders | |||
| Arthralgia | 2 (1.7) | 1 (0.9) | 6 (5.3) |
| Back Pain | 3 (2.6) | 8 (7.1) | 5 (4.4) |
| Pain in Extremity | 1 (0.9) | 4 (3.5) | 3 (2.6) |
| Nervous System Disorders | |||
| Dizziness | 1 (0.9) | 4 (3.5) | 3 (2.6) |
| Headache | 4 (3.5) | 3 (2.7) | 5 (4.4) |
| Renal And Urinary Disorders | |||
| Pollakiuria | 1 (0.9) | 5 (4.4) | 7 (6.1) |
| Reproductive System And Breast Disorders | |||
| Balanitis | 0 | 3 (2.7) | 0 |
| Respiratory, Thoracic and Mediastinal Disorders | |||
| Oropharyngeal Pain | 2 (1.7) | 3 (2.7) | 0 |
| Vascular Disorders | |||
| Hypotension | 3 (2.6) | 3 (2.7) | 0 |
Combination with Insulin and Metformin (Study DIA3008 Insulin Substudy)
The incidence of adverse events, reported regardless of causality in ≥ 2% of patients treated with canagliflozin 100 mg or 300 mg and more frequently than in the placebo group, in a study of canagliflozin as add-on combination therapy with insulin and metformin is provided in Table 4. The core assessment period was 18 weeks for this placebo-controlled study.
| Table 4: Adverse events (regardless of causality) reported in ≥ 2% of patients treated with canagliflozin and more frequently than in the placebo group in a double-blind clinical trial of canagliflozin in add-on combination use with insulin and metformin, and compared to placebo (Study DIA3008 - Insulin Substudy) | |||||||
System Organ Class / Preferred Term | Placebo + Insulin + Metformin n=244 n (%) | Canagliflozin 100 mg + Insulin + Metformin n=241 n (%) | Canagliflozin 300 mg + Insulin + Metformin n=246 n (%) | ||||
| Gastrointestinal disorders | |||||||
| Constipation | 2 (0.8) | 1 (0.4) | 8 (3.3) | ||||
| Diarrhea | 7 (2.9) | 4 (1.7) | 14 (5.7) | ||||
| Dyspepsia | 0 | 2 (0.8) | 5 (2.0) | ||||
| Nausea | 5 (2.0) | 5 (2.1) | 8 (3.3) | ||||
| General disorders and administration site conditions | |||||||
| Fatigue | 4 (1.6) | 6 (2.5) | 8 (3.3) | ||||
| Thirst | 0 | 2 (0.8) | 10 (4.1) | ||||
| Infections and infestations | |||||||
| Bronchitis | 5 (2.0) | 7 (2.9) | 3 (1.2) | ||||
| Nasopharyngitis | 22 (9.0) | 22 (9.1) | 13 (5.3) | ||||
| Urinary tract infection | 4 (1.6) | 3 (1.2) | 10 (4.1) | ||||
| Vulvovaginal mycotic infection | 2 (0.8) | 4 (1.7) | 5 (2.0) | ||||
| Metabolism and nutrition disorders | |||||||
| Hypoglycemia | 21 (8.6) | 23 (9.5) | 23 (9.3) | ||||
| Musculoskeletal and connective tissue disorders | |||||||
| Arthralgia | 3 (1.2) | 8 (3.3) | 4 (1.6) | ||||
| Back pain | 5 (2.0) | 3 (1.2) | 13 (5.3) | ||||
| Pain in extremity | 4 (1.6) | 7 (2.9) | 6 (2.4) | ||||
| Nervous system disorders | |||||||
| Dizziness | 0 | 1 (0.4) | 6 (2.4) | ||||
| Headache | 7 (2.9) | 8 (3.3) | 7 (2.8) | ||||
| Renal and urinary disorders | |||||||
| Pollakiuria | 1 (0.4) | 7 (2.9) | 18 (7.3) | ||||
| Reproductive system and breast disorders | |||||||
| Balanitis | 1 (0.4) | 7 (2.9) | 9 (3.7) | ||||
| Vascular disorders | |||||||
| Hypertension | 3 (1.2) | 8 (3.3) | 1 (0.4) | ||||
Less Common Clinical Trial Adverse Drug Reactions (< 2%)1
Metabolism and nutrition disorders: dehydration2
Nervous system disorders: dizziness postural2, syncope2
Skin and subcutaneous tissue disorders: rash3, urticaria
Vascular disorders: hypotension2, orthostatic hypotension2
Description of Selected Adverse Reactions
Reduced intravascular volume
In the pooled analysis of the four 26-week, placebo-controlled studies, the incidence of all adverse reactions related to reduced intravascular volume (e.g., postural dizziness, orthostatic hypotension, hypotension, dehydration, and syncope) was 1.2% for canagliflozin 100 mg, 1.3% for canagliflozin 300 mg, and 1.1% for placebo. The incidence of these adverse reactions with canagliflozin treatment in the two active-controlled studies was similar to comparators.
In one of the dedicated long-term cardiovascular studies (CANVAS), where patients were generally older with a higher prevalence of comorbidities, the incidence rate of adverse reactions related to reduced intravascular volume were 2.34 with canagliflozin 100 mg, 2.87 with canagliflozin 300 mg, and 1.85 with placebo, events per 100 patient-years of exposure.
In the long-term renal outcomes trial, the incidence of hypotension was 2.8% in the canagliflozin 100 mg group and 1.5% in the placebo group.
To assess risk factors for these adverse reactions, a larger pooled analysis (N=12,441) of patients from 13 controlled Phase 3 and Phase 4 studies including both doses of canagliflozin was conducted. In this pooled analysis, patients on loop diuretics, patients with moderate renal impairment (eGFR 30 to < 60 mL/min/1.73 m2), and patients ≥ 75 years of age had higher incidences of these reactions. For patients on loop diuretics, the incidence rates were 4.98 on canagliflozin 100 mg and 5.67 on canagliflozin 300 mg compared to 4.15 events per 100 patient-years of exposure in the control group. For patients with a baseline eGFR 30 to < 60 mL/min/1.73 m2, the incidence rates were 5.24 on canagliflozin 100 mg and 5.35 on canagliflozin 300 mg compared to 3.11 events per 100 patient-years of exposure in the control group. In patients ≥ 75 years of age, the incidence rates were 5.27 on canagliflozin 100 mg and 6.08 on canagliflozin 300 mg compared to 2.41 events per 100 patient-years of exposure in the control group (see WARNINGS AND PRECAUTIONS, DOSING AND ADMINISTRATION and ACTION AND CLINICAL PHARMACOLOGY, Special Populations and Conditions).
.
1 Adverse drug reactions (ADRs) were identified based on a comprehensive assessment of biological plausibility, mechanism of action, dose dependence in incidence rate, time of onset, seriousness and consistency of findings across four, 26-week placebo-controlled Phase 3 clinical studies. Additional supportive safety analyses were conducted on a large pooled dataset from eight active- and placebo-controlled Phase 3 clinical studies.
2 Related to reduced intravascular volume (see Adverse reactions related to reduced intravascular volume).
3 Rash includes the terms: rash erythematous, rash generalized, rash macular, rash maculopapular, rash papular, rash pruritic, rash pustular, and rash vesicular
Diabetic ketoacidosis
Cases of DKA, a serious life-threatening condition requiring urgent hospitalization, have been reported in patients with type 2 diabetes mellitus treated with SGLT2 inhibitors, including canagliflozin. In the on-treatment analysis of the CANVAS/CANVAS-R integrated dataset, the adjusted incidence rates of adjudicated diabetic ketoacidosis were 0.08 (0.2%, 14/5,790) and 0.01 (<0.1%, 1/4,344) per 100 subject-years, for the combined canagliflozin and the placebo groups, respectively. Fatal cases of DKA have been reported in patients treated with canagliflozin. INVOKAMET® should not be used in patients with type 1 diabetes. In a number of reported cases, the presentation of the condition was atypical with blood glucose values below 13.9 mmol/L (250 mg/dL) (see WARNINGS AND PRECAUTIONS, Endocrine and Metabolism).
In a long-term renal outcomes study in patients with type 2 diabetes and diabetic nephropathy , on-treatment incidence rates of adjudicated events of DKA were 0.22 (0.5%, 11/2,200) and 0.02 (<0.1%, 1/2,197) per 100 patient-years with canagliflozin 100 mg and placebo, respectively; of the 12 patients with DKA, 7 (6 on canagliflozin 100 mg and 1 on placebo) had an eGFR before treatment of 30 to ˂ 45 mL/min/1.73m2. Cases of DKA in the canagliflozin group occurred in the setting of an intercurrent illness requiring hospitalization (8 of 11 subjects), or with low beta cell function reserve (3 of 11 subjects).
Hypoglycemia
In individual clinical trials (see CLINICAL TRIALS), episodes of hypoglycemia occurred at a higher rate when canagliflozin was co-administered with insulin or sulfonylurea (Table 5; see WARNINGS AND PRECAUTIONS and DOSAGE AND ADMINISTRATION).
| Table 5: Incidence of Hypoglycemia1 in Controlled Clinical Studies | |||
|---|---|---|---|
Monotherapy (26 weeks) | Placebo (N=192) | Canagliflozin 100 mg (N=195) | Canagliflozin 300 mg (N=197) |
| Overall [N (%)] | 5 (2.6) | 7 (3.6) | 6 (3.0) |
In Combination with Metformin (26 weeks) | Placebo + Metformin (N=183) | Canagliflozin 100 mg + Metformin (N=368) | Canagliflozin 300 mg + Metformin (N=367) |
| Overall [N (%)] | 3 (1.6) | 16 (4.3) | 17 (4.6) |
| Severe [N (%)]2 | 0 (0) | 1 (0.3) | 1 (0.3) |
In Combination with Metformin (52 weeks) | Glimepiride + Metformin (N=482) | Canagliflozin 100 mg + Metformin (N=483) | Canagliflozin 300 mg + Metformin (N=485) |
| Overall [N (%)] | 165 (34.2) | 27 (5.6) | 24 (4.9) |
| Severe [N (%)]2 | 15 (3.1) | 2 (0.4) | 3 (0.6) |
In Combination with Metformin + Sulfonylurea (26 weeks) | Placebo + Metformin + Sulfonylurea (N=156) | Canagliflozin 100 mg + Metformin + Sulfonylurea (N=157) | Canagliflozin 300 mg + Metformin + Sulfonylurea (N=156) |
| Overall [N (%)] | 24 (15.4) | 43 (27.4) | 47 (30.1) |
| Severe [N (%)]2 | 1 (0.6) | 1 (0.6) | 0 |
In Combination with Metformin + Sulfonylurea (52 weeks) | Sitagliptin + Metformin + Sulfonylurea (N=378) | Canagliflozin 300 mg + Metformin + Sulfonylurea (N=377) | |
| Overall [N (%)] | 154 (40.7) | 163 (43.2) | |
| Severe [N (%)]2 | 13 (3.4) | 15 (4.0) | |
In Combination with Metformin + Pioglitazone (26 weeks) | Placebo + Metformin + Pioglitazone (N=115) | Canagliflozin 100 mg + Metformin + Pioglitazone (N=113) | Canagliflozin 300 mg + Metformin + Pioglitazone (N=114) |
| Overall [N (%)] | 3 (2.6) | 3 (2.7) | 6 (5.3) |
In Combination with Insulin (18 weeks) | Placebo + Insulin (N=565) | Canagliflozin 100 mg + Insulin (N=566) | Canagliflozin 300 mg + Insulin (N=587) |
| Overall [N (%)] | 208 (36.8) | 279 (49.3) | 285 (48.6) |
| Severe [N (%)]2 | 14 (2.5) | 10 (1.8) | 16 (2.7) |
In Combination with Insulin and Metformin (18 weeks)3 | Placebo + Metformin + Insulin (N=244) | Canagliflozin 100 mg + Metformin + Insulin (N=241) | Canagliflozin 300 mg + Metformin + Insulin (N=246) |
| Overall [N (%)] | 101(41.1) | 107 (44.4) | 113 (45.9) |
| Severe [N (%)]2 | 9 (3.7) | 4 (1.7) | 4 (1.6) |
1 Number of patients experiencing at least one event of hypoglycemia based on either biochemically documented episodes (any glucose value ≤3.89 mmol/L) or severe hypoglycemic events in the intent-to-treat population. 2 Severe episodes of hypoglycemia were defined as those where the patient: required the assistance of another person to recover; lost consciousness; or experienced a seizure (regardless of whether biochemical documentation of a low glucose value was obtained). 3 Subgroup of patients (N=731) from insulin substudy on canagliflozin in combination with metformin and insulin | |||
Twice Daily Dosing
The incidence of hypoglycemia in a Phase 2 clinical study with twice daily dosing (canagliflozin 50 mg or 150 mg twice daily in combination with metformin) was reported in 4.3% and 3.2% of patients treated with canagliflozin 50 mg and 150 mg twice daily, respectively, compared to 3.2% in placebo-treated patients. There were no cases of severe hypoglycemia reported in the canagliflozin or placebo groups.
Genital mycotic infections
Vulvovaginal candidiasis (including vulvovaginitis and vulvovaginal mycotic infection) was reported in 10.4% and 11.4% of female patients treated with canagliflozin 100 mg and canagliflozin 300 mg, respectively, compared to 3.2% in placebo-treated female patients. Most reports of vulvovaginal candidiasis occurred during the first four months of treatment with canagliflozin. Among female patients taking canagliflozin, 2.3% experienced more than one infection. Overall, 0.7% of all female patients discontinued canagliflozin due to vulvovaginal candidiasis (see WARNINGS AND PRECAUTIONS).
Candidal balanitis or balanoposthitis was reported in 4.2% and 3.7% of male patients treated with canagliflozin 100 mg and canagliflozin 300 mg, respectively, compared to 0.6% in placebo-treated male patients. Among male patients taking canagliflozin, 0.9% had more than one infection. Overall, 0.5% of male patients discontinued canagliflozin due to candidial balanitis or balanoposthitis. In uncircumcised males in a pooled analysis of 10 controlled studies, the incidence rate of phimosis was 0.56 events per 100 patient-years of exposure in patients treated with canagliflozin and 0.05 events per 100 patient-years in patients treated with comparator. In this pooled analysis, the incidence rate of circumcision was 0.38 events per 100 patient-years of exposure in male patients treated with canagliflozin compared to 0.10 events per 100 patients-years in male patients treated with comparator (see WARNINGS AND PRECAUTIONS).
In the CANVAS integrated dataset, the adjusted-incidence rates of any male mycotic genital infection were 3.17 and 0.96 per 100 patient-years in the combined canagliflozin and placebo groups, respectively.
Urinary tract infections
Urinary tract infections were more frequently reported for canagliflozin 100 mg and 300 mg (5.9% versus 4.3%, respectively) compared to 4.0% with placebo. Most infections were mild to moderate with no increase in the occurrence of serious adverse events. Subjects responded to standard treatments while continuing canagliflozin treatment. The incidence of recurrent infections was not increased with canagliflozin.
Fournier’s gangrene (necrotizing fasciitis of the perineum)
Fournier’s gangrene was identified as a SGLT2i class adverse reaction based on spontaneous event reporting. These events had not been previously identified as ADRs because there were very few subjects in the canagliflozin Phase 3 and Phase 4 clinical development program (including the CANVAS and CREDENCE programs) with adverse events of Fournier’s gangrene (incidences were <0.1% in the canagliflozin and comparator groups). All 4 events of
Fournier’s gangrene (2 subjects treated with canagliflozin and 2 subjects treated with comparator) in the canagliflozin Phase 3 and Phase 4 clinical development program were serious.
Falls
In the pool of all Phase 3 studies, the incidence rate of AEs coded as related to a fall was 7.3, 8.0, and 11.8 per 1000 patient years of exposure to comparator, canagliflozin 100 mg, and canagliflozin 300 mg, respectively.
Bone fractures
In cardiovascular study (CANVAS) of 4,327 patients with established or at least two risk factors for cardiovascular disease, the incidence rates of all adjudicated bone fracture were 1.59, 1.79, and 1.09 per 100 patient-years of follow up to canagliflozin 100 mg, canagliflozin 300 mg, and placebo, respectively, with the fracture imbalance initially occurring within the first 26 weeks of therapy.
In two other long-term studies (CANVAS-R and CREDENCE) and in studies conducted in the general diabetes population, no difference in fracture risk was observed with canagliflozin relative to control. In CANVAS-R, of 5,807 patients with established or at least two risk factors for cardiovascular disease, the incidence rates of all adjudicated bone fracture were 1.14 and 1.32 events per 100 patient-years of follow up to canagliflozin and placebo, respectively. In a long-term renal outcomes study (CREDENCE) of 4,397 patients with type 2 diabetes and diabetic nephropathy, the incidence rates of all adjudicated bone fracture were 1.18 and 1.21 events per 100 patient-years of follow-up for canagliflozin 100 mg and placebo, respectively. In other type 2 diabetes studies with canagliflozin, which enrolled a general diabetes population of 7,729 patients and where bone fractures were adjudicated, the incidence rates of all adjudicated bone fracture were 1.18 and 1.08 events per 100 patient-years of follow up to canagliflozin and control, respectively.
Decreases in Bone Mineral Density
Bone mineral density (BMD) was measured by dual-energy X-ray absorptiometry in a clinical trial of 714 older adults (mean age 64 years). At 2 years, patients randomized to canagliflozin 100 mg and canagliflozin 300 mg had placebo-corrected declines in BMD at the total hip of 0.9% and 1.2%, respectively, and at the lumbar spine of 0.3% and 0.7%, respectively. Placebo-adjusted BMD declines were 0.1% at the femoral neck for both canagliflozin doses and 0.4% at the distal forearm for patients randomized to canagliflozin 300 mg. The placebo-adjusted change at the distal forearm for patients randomized to canagliflozin 100 mg was 0%.
Photosensitivity: In the CANVAS outcome trials integrated dataset, the adjusted-incidence rates of photosensitivity adverse events were 1.03 (0.3%, 19/5790) and 0.26 (0.1%, 3/4344) events per 1,000 subject-years in the combined canagliflozin and the placebo groups, respectively. In a dataset from 12 other phase 3 or 4 trials (excluding the CANVAS outcome trials) that enrolled a diabetic population of 8114 patients, an imbalance in phototoxicity adverse events was not seen with canagliflozin relative to control.
Skin ulcers and peripheral ischemia
In the pool of 8 clinical studies with 78 weeks of mean duration of exposure, skin ulcers occurred in 0.7%, 1.1%, and 1.5% of patients and peripheral ischemia occurred in 0.1%, 0.4%, and 0.2% of patients receiving comparator, canagliflozin 100 mg, and canagliflozin 300 mg, respectively. An imbalance in these events generally were seen within the first 24 weeks of treatment and occurred in patients with known or at high risk for atherosclerotic disease, longer duration of diabetes, presence of diabetic complications, and diuretic use. In the on-treatment analysis set of the CREDENCE renal outcomes trial, there was a higher incidence rate of adverse events of diabetic foot reported in the canagliflozin group compared with the placebo group: 8.47 (43 subjects) and 4.89 (24 subjects) per 1,000 subject-years, respectively.
Renal Cell Carcinoma: In the CANVAS outcome trials integrated dataset, the adjusted-incidence rates of any renal cell carcinoma adverse event were 0.62 (0.2%, 14/5790) and 0.21 (0.1%, 3/4344) per 1,000 subject-years in the canagliflozin and the placebo groups, respectively. Whether this numerical imbalance is related to canagliflozin treatment is unknown.
Lower limb amputation: An increased risk of lower limb amputations associated with canagliflozin use was observed in CANVAS (5.9 vs 2.8 events per 1000 patient years) and CANVAS-R (7.5 vs 4.2 events per 1000 patient-years), two large, randomized, placebo-controlled trials evaluating patients with type 2 diabetes who had either established cardiovascular disease or were at risk for cardiovascular disease. The imbalance occurred as early as the first 26 weeks of therapy. Patients in CANVAS and CANVAS-R were followed for an average of 5.7 and 2.1 years, respectively. The amputation data for CANVAS and CANVAS-R are shown in Table 6 and Table 7, respectively. See WARNINGS AND PRECAUTIONS, Cardiovascular.
| Table 6: CANVAS Amputations | ||||||||||||||
Placebo (N=1441) | Canagliflozin 100 mg (N=1445) | Canagliflozin 300 mg (N=1441) | Canagliflozin pooled (N=2886) | |||||||||||
| Patients with an amputation, n (%) | 22 (1.5) | 50 (3.5) | 45 (3.1) | 95 (3.3) | ||||||||||
| Total amputations | 33 | 83 | 79 | 162 | ||||||||||
| Amputation incidence rate (per 1000 patient-years) | 2.8 | 6.2 | 5.5 | 5.9 | ||||||||||
| Hazard ratio (95% CI) | 2.24 (1.36, 3.69) | 2.01 (1.20, 3.34) | 2.12 (1.34, 3.38) | |||||||||||
Note: Incidence is based on the number of patients with at least one amputation, and not the total number of amputation events. A patient’s follow-up is calculated from Day 1 to the first amputation event date. Some patients had more than one amputation
| Table 7: CANVAS-R Amputations | ||||||
Placebo (N=2903) | Canagliflozin 100 mg (with up-titration to 300 mg) N=2904 | |||||
| Patients with an amputation, n (%) | 25 (0.9) | 45 (1.5) | ||||
| Total amputations | 36 | 59 | ||||
| Amputation incidence rate (per 1000 patient-years) | 4.2 | 7.5 | ||||
| Hazard Ratio (95% CI) | -- | 1.80 (1.10, 2.93) | ||||
Note: Incidence is based on the number of patients with at least one amputation, and not the total number of amputation events. A patient’s follow-up is calculated from Day 1 to the first amputation event date. Some patients had more than one amputation.
In a data pool of patients from 12 other phase 3 or 4 trials (excluding CANVAS program) that enrolled a diabetic population of 8114 patients, the majority of which were without cardiovascular disease, no difference in lower limb amputation risk was observed on canagliflozin relative to control.
The risk of lower limb amputations associated with the use of canagliflozin 100 mg relative to placebo was 12.3 vs 11.2 events per 1000 patient-years, respectively in CREDENCE, a long-term renal outcomes study of 4,397 patients with type 2 diabetes and diabetic nephropathy, with a mean follow-up duration of 136 weeks (see Table 8 and WARNINGS AND PRECAUTIONS).
| Table 8: Lower limb amputations CREDENCE (On-study analysis) | ||
Placebo (N=2197) | Canagliflozin 100 mg (N=2200) | |
| Patients with an amputation, n (%) | 63 (2.9) | 70 (3.2) |
| Total amputations | 96 | 87 |
Amputation incidence rate (per 1000 patient-years) | 11.2 | 12.3 |
| Hazard Ratio (95% CI) | -- | 1.11 (0.79, 1.56) |
Note: Incidence is based on the number of patients with at least one amputation, and not the total number of amputation events. A patient’s follow-up is calculated from Day 1 to the first amputation event date. Some patients had more than one amputation.
Adverse Reactions in Specific Populations
Elderly Patients
Compared to younger patients, patients 65 years and older had a higher incidence of adverse reactions related to reduced intravascular volume with canagliflozin, including hypotension, postural dizziness, orthostatic hypotension, syncope, and dehydration. In particular, in patients ≥ 75 years of age, adverse reactions related to reduced intravascular volume occurred with incidence rates of 5.27, 6.08, and 2.41 events per 100 patient-years of exposure for canagliflozin 100 mg, canagliflozin 300 mg, and the control group, respectively. Decreases in eGFR (-3.41 and -4.67 mL/min/1.73 m2) were reported with canagliflozin 100 mg and 300 mg, respectively, compared to the control group (-4.15 mL/min/1.73 m2) (see WARNINGS AND PRECAUTIONS and DOSAGE AND ADMINISTRATION).
Patients with Moderate Renal Impairment
Patients with Type 2 Diabetes Mellitus and an eGFR 45 to < 60 mL/min/1.73 m2
In a pooled analysis of patients (N=1087) with a baseline eGFR 45 to < 60 mL/min/1.73 m2, the incidence rates of adverse reactions related to reduced intravascular volume were 4.61 for canagliflozin 100 mg and 4.37 for canagliflozin 300 mg relative to 3.00 events per 100 patient-years of exposure for placebo (see WARNINGS AND PRECAUTIONS and DOSAGE AND ADMINISTRATION). Serum creatinine levels increased from baseline to end of treatment by 5.92 and 6.98 µmol/L for canagliflozin 100 mg and 300 mg, respectively, relative to 7.03 µmol/L with placebo. Blood urea nitrogen (BUN) levels increased by from baseline to end of treatment by 0.92 and 0.77 µmol/L for canagliflozin 100 mg and 300 mg, respectively, relative to 0.57 µmol/L with placebo. The incidence rates of decreases in eGFR (<80 mL/min/1.73 m2 and > 30% decrease from baseline) at any time during treatment were 5.17, 6.62, and 5.82 events per 100 patient-years of exposure for canagliflozin 100 mg, canagliflozin 300 mg, and placebo, respectively. At the last post-baseline value, incidence rates for such decreases were 2.52 for patients treated with canagliflozin 100 mg, 1.91 for patients treated with canagliflozin 300 mg, and 3.20 events per 100 patient-years of exposure for placebo (see WARNINGS AND PRECAUTIONS).
The incidences of elevated serum potassium (> 5.4 mEq/L and 15% above baseline) at any post-baseline value were 4.11 for canagliflozin 100 mg, 4.33 for canagliflozin 300 mg, and 3.8 events per 100 patient-years of exposure for placebo. Rare, more severe elevations were seen in patients with moderate renal impairment who had prior elevated potassium concentrations and/or who were on multiple medications that reduce potassium excretion, such as potassium-sparing diuretics and angiotensin-converting-enzyme (ACE) inhibitors.
Serum phosphate changes from baseline to end of treatment were 0.00 and 0.02 mmol/L for canagliflozin 100 mg and 300 mg, respectively, compared to 0.00 mmol/L for placebo. The incidence rates of elevated serum phosphate (> 1.65 mmol/L and 25% above baseline) at any post-baseline value were 0.93 for canagliflozin 100 mg, 1.15 for canagliflozin 300 mg and 0. 71 events per 100 patient-years of exposure for placebo.
Patients with Type 2 Diabetes Mellitus and an eGFR 30 to <60 mL/min/1.73 m2 Treated for Diabetic Nephropathy:
In a long-term renal outcomes study in patients with type 2 diabetes and diabetic nephropathy, the incidence rate for renal-related adverse events was lower in the canagliflozin 100 mg group compared with the placebo group (7.23 and 10.55 per 100 patient-years in canagliflozin 100 mg and placebo, respectively).
For the subset of patients with an eGFR before treatment of 45 to <60 mL/min/1.73m2, the incidence rates of adverse reactions related to volume depletion were similar: 2.3 events per 100 patient-years for canagliflozin 100 mg and 2.6 events per 100 patient-years of exposure for placebo. In the same study, for patients with an eGFR 30 to <45mL/min/1.73m2 the incidence rate was higher for canagliflozin 100 mg (4.9 events per 100 patient-years) than for placebo (2.6 events per 100 patient-years).
Clinical Chemistry and Hematology Findings
Laboratory values, described below, are derived from the pooled analysis of 26-week, placebo-controlled clinical studies unless otherwise noted.
Increases in serum potassium
Mean percent changes from baseline in blood potassium were 0.5% and 1.0% for canagliflozin 100 mg and 300 mg, respectively, compared to 0.6% for placebo. Episodes of elevated serum potassium (> 5.4 mEq/L and 15% above baseline) were seen in 4.4% of patients treated with canagliflozin 100 mg, 7.0% of patients treated with canagliflozin 300 mg, and 4.8% of patients treated with placebo.
In a trial in patients with moderate renal impairment (eGFR 30 to < 50 mL/min/1.73 m2), increases in serum potassium to > 5.4 mEq/L and 15% above baseline were seen in 16.1%, 12.4%, and 27.0% of patients treated with placebo, canagliflozin 100 mg, and canagliflozin 300 mg, respectively. Elevations to ≥ 6.5 mEq/L occurred in 1.1%, 2.2%, and 2.2% of patients treated with placebo, canagliflozin 100 mg, and canagliflozin 300 mg, respectively.
In a long-term renal outcomes study in patients with type 2 diabetes and diabetic nephropathy, no increase in adverse events of hyperkalemia, and no absolute (> 6.5mEq/L) or relative (> upper limit of normal and > 15% increase from baseline) increases in serum potassium were observed with canagliflozin 100 mg relative to placebo.
Increases in serum creatinine and blood urea nitrogen (BUN)
Mean percent changes from baseline in creatinine, with commensurate decreases in eGFR, were 2.8% and 4.0% for canagliflozin 100 mg and 300 mg, respectively, compared to 1.5% for placebo. Mean percent increases from baseline in BUN were 17.1% and 18.0% for canagliflozin 100 mg and 300 mg, respectively, compared to 2.7% for placebo. These changes were generally observed within six weeks of treatment initiation. Subsequently, serum creatinine concentrations gradually trended toward baseline and BUN levels remained stable.
The proportion of patients with larger decreases in eGFR (> 30%) from baseline, occurring at any time during treatment, was 2.0% with canagliflozin 100 mg and 4.1% with canagliflozin 300 mg relative to 2.1% with placebo. At study end, decreases of > 30% from baseline were seen for 0.7% of subjects with canagliflozin 100 mg, 1.4% with canagliflozin 300 mg, and 0.5% with placebo (see WARNINGS AND PRECAUTIONS). After discontinuation of canagliflozin therapy, these changes in laboratory values improved or returned to baseline.
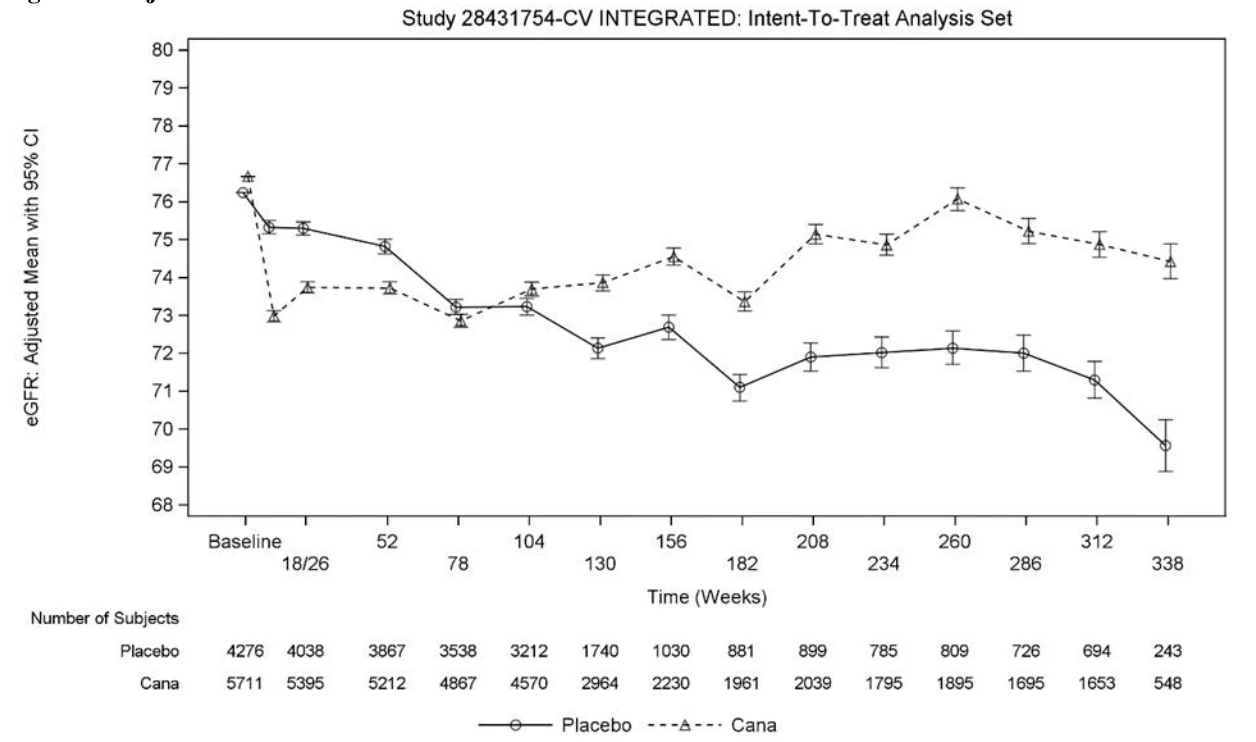
In an integrated analysis of data from two long-term cardiovascular outcome studies, patients treated with canagliflozin experienced an initial fall in mean eGFR that thereafter stabilized (see
Figure 1) whereas patients treated with placebo experienced a progressive decline in eGFR.
Figure 1: Adjusted mean eGFR over time
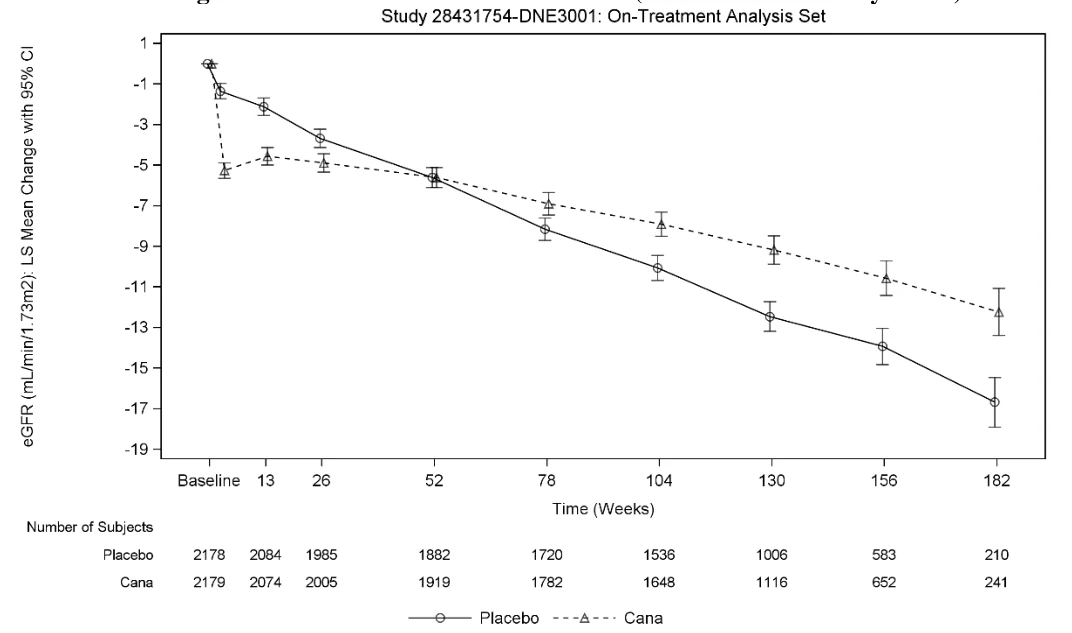
In a long-term renal outcomes trial, patients treated with canagliflozin experienced an acute decrease in eGFR at Week 3, followed by an attenuated decline over time from week 3 to end of treatment. Placebo-treated patients demonstrated a progressive linear decline over time. After Week 52, the LS mean decrease in eGFR was smaller in the canagliflozin 100 mg group than in the placebo group (
Figure 2).
Figure 2: LS Mean Change From Baseline in eGFR Over Time (On-Treatment Analysis Set)
Lipid changes
Compared to placebo, mean increases from baseline in low density lipoprotein cholesterol (LDL-C) were 0.11 mmol/L (4.5%) and 0.21 mmol/L (8.0%) with canagliflozin 100 mg and canagliflozin 300 mg, respectively. Increases in total cholesterol of 0.12 mmol/L (2.5%) and 0.21 mmol/L (4.3%) were seen, relative to placebo, for canagliflozin 100 mg and canagliflozin 300 mg, respectively. Increases in non-HDL-C relative to placebo were 0.05 mmol/L (1.5%) and 0.13 mmol/L (3.6%) with canagliflozin 100 mg and 300 mg, respectively. Increases in high-density lipoprotein cholesterol (HDL-C) were 0.06 mmol/L (5.4%), and 0.07 mmol/L (6.3%) relative to placebo for canagliflozin 100 mg and canagliflozin 300 mg, respectively. The LDL-C/HDL-C ratios did not change with either canagliflozin dose compared to placebo.
Increases in hemoglobin
Mean hemoglobin concentration increased from baseline 4.7 g/L (3.5%) with canagliflozin 100 mg and 5.1 g/L (3.8%) with canagliflozin 300 mg, compared to a decrease of -1.8 g/L (-1.1%) with placebo. After 26 weeks of treatment, 0.8%, 4.0%, and 2.7% of patients treated with placebo, canagliflozin 100 mg, and canagliflozin 300 mg, respectively, had a hemoglobin level above the upper limit of normal.
Increases in serum phosphate
Dose-related increases in serum phosphate levels were observed with canagliflozin. In the pool of four placebo-controlled trials, the mean percent change in serum phosphate levels were 3.6% and 5.1% with canagliflozin 100 mg and canagliflozin 300 mg, respectively, compared to 1.5% with placebo. Episodes of elevated serum phosphate (> 1.65 mmol/L and 25% above baseline) were seen in 0.6% and 1.6% of patients treated with canagliflozin 100 mg and 300 mg, respectively, compared to 1.3% of patients treated with placebo.
Decreases in serum urate
Moderate decreases in the mean percent change from baseline in serum urate were observed in the canagliflozin 100 mg and 300 mg groups (-10.1% and -10.6%, respectively) compared with placebo, where a slight increase from baseline (1.9%) was observed. Decreases in serum urate in the canagliflozin groups were maximal or near maximal by Week 6 and maintained with dosing. A transient increase in urinary uric acid excretion was seen, which was not persistent.
Electrolytes: The following changes from baseline to end of treatment in serum electrolytes were observed during canagliflozin treatment in the CANVAS integrated database.
| Table 9: Placebo-adjusted Mean Changes from Baseline in Electrolytes at Week 18 or 26a in the CANVAS program | |||
|---|---|---|---|
| Analyte [normal range, unit] | Baseline, mean (SE) | Placebo-corrected change from baseline at Week 18 or 26a, mean (95%) | p-value |
| Sodium [135 – 145 mmol/L] | |||
| canagliflozin | 139.3 (0.036) | 0.40 (0.304;0.496) | <0.001 |
| Potassium [3.5 – 5.0 mmol/L] | |||
| canagliflozin | 4.44 (0.006) | 0.01 (-0.005;0.028) | 0.171 |
| Magnesium [0.75 – 0.95 mmol/L] | |||
| canagliflozin | 0.77 (0.001) | 0.08 (0.074; 0.080) | <0.001 |
| Bicarbonate [24 – 30 mmol/L] | |||
| canagliflozin | 23.33 (0.036) | -0.41 ((-0.504;-0.307) | <0.001 |
| Phosphate [0.80-1.50 mmol/L] | |||
| canagliflozin | 1.16 (0.002) | 0.03 (0.028;0.040) | <0.001 |
| Calcium [2.07-2.64 mmol/L] | |||
| canagliflozin | 2.41 (0.002) | 0.02 (0.012, 0.020) | <0.001 |
a CANVAS study blood chemistries obtained at week 18, CANVAS-R study blood chemistries obtained at week 26
SE = standard error
ANCOVA for Week 18 or 26 includes the baseline electrolyte as a linear covariate, and treatment and study as fixed effects.
The following shifts from normal range at baseline to below or above the normal range at worst value on treatment were reported in the treated set in the CANVAS integrated database:
- Increases in serum sodium above the upper limit of normal occurred more frequently in patients receiving canagliflozin than in those receiving placebo (2.63 per 100 subject years for canagliflozin and 1.80 per 100 subject years for placebo).
- Decreases in serum magnesium below the lower limit of normal occurred more frequently in patients receiving placebo (0.65 per 100 subject years for canagliflozin and 3.80 per 100 subject years for placebo), whilst increases in serum magnesium above the upper limit of normal occurred more frequently in patients receiving canagliflozin than in those receiving placebo (1.25 per 100 subject years for canagliflozin and 0.88 per 100 subject years for placebo).
- Decreases of serum bicarbonate below the lower limit of normal occurred more frequently in patients receiving canagliflozin than in those receiving placebo (2.91 per 100 subject years for canagliflozin, 2.39 per 100 subject years for placebo).
- Increases of serum phosphate above the upper limit of normal occurred more frequently in patients receiving canagliflozin than in those receiving placebo (1.36 per 100 subject years for canagliflozin and 1.00 per 100 subject years for placebo).
Post-Market Adverse Drug Reactions
Because these reactions were reported voluntarily from a population of uncertain size, it is not always possible to reliably estimate their frequency or establish a causal relationship to drug exposure.
Canagliflozin
Gastrointestinal Disorders: pancreatitis acute
Metabolism and nutrition disorders: diabetic ketoacidosis
Immune system disorders: anaphylactic reaction
Skin and subcutaneous tissue disorders: angioedema
Renal and urinary disorders: acute kidney injury, including acute renal failure (with or without volume depletion).
Genitourinary: severe urinary tract infections; urosepsis and pyelonephritis
Musculoskeletal: bone fractures
Infections and Infestations: Fournier’s gangrene (necrotizing fasciitis of the perineum)
Metformin hydrochloride
Gastrointestinal Disorders: Abdominal discomfort, abdominal distension, abdominal pain, abdominal pain upper, constipation, diarrhea, dry mouth, dyspepsia, flatulence, gastric disorder, gastric ulcer, gastrointestinal disorder, nausea, vomiting
Hepatobiliary Disorders: Liver function tests abnormalities or hepatitis resolving upon metformin discontinuation, autoimmune hepatitis, drug-induced liver injury, hepatitis
Investigations: Blood lactic acid increased
Metabolism and Nutrition Disorders: Lactic acidosis, decrease of Vitamin B12 absorption with decrease of serum levels during long-term use of metformin, weight decreased, decreased appetite
Skin and Subcutaneous Tissue Disorders: Erythema, pruritus, rash, skin lesion, urticaria
DRUG INTERACTIONS
Overview
Specific pharmacokinetic drug interactions studies with INVOKAMET® have not been performed, although such studies have been conducted with the individual canagliflozin and metformin components.
Co-administration of canagliflozin (300 mg once daily) and metformin (2000 mg once daily) had no clinically relevant effect on the pharmacokinetics of either canagliflozin or metformin.
Canagliflozin
In vitro assessment of interactions
The metabolism of canagliflozin is primarily via glucuronide conjugation mediated by UDP glucuronosyl transferase 1A9 (UGT1A9) and 2B4 (UGT2B4).
Canagliflozin did not induce CYP450 enzyme expression (3A4, 2C9, 2C19, 2B6, and 1A2) in cultured human hepatocytes. Canagliflozin did not inhibit the CYP450 isoenzymes (1A2, 2A6, 2C19, 2D6, or 2E1) and weakly inhibited CYP2B6, CYP2C8, CYP2C9, and CYP3A4 based on in vitro studies with human hepatic microsomes. Canagliflozin is a weak inhibitor of P-gp.
Canagliflozin is also a substrate of drug transporters P-glycoprotein (P-gp), Breast Cancer Resistance Protein (BCRP) and Multi-Drug Resistance-Associated Protein 2 (MRP2).
In vivo assessment of interactions
Specific clinical drug interaction studies were conducted to investigate the effects of co-administered drugs, inhibitors or inducers of the drug-metabolizing enzymes UGTs (1A9, 2B4), CYPs (3A4, 2C9) and transporters P-gp and MRP2 on canagliflozin pharmacokinetics. Clinical studies were also conducted to assess the inhibitory or induction effects of canagliflozin on the pharmacokinetics of the CYP (3A4, 2C9), P-gp, substrates and co-administered drugs (see ACTION AND CLINICAL PHARMACOLOGY).
Drug-Drug Interactions
Effects of other drugs on canagliflozin
In clinical studies, the effects of other drugs on canagliflozin were assessed. Cyclosporin (P-gp inhibitor), hydrochlorothiazide, oral contraceptives (ethinyl estradiol and levonorgestrel), metformin, and probenecid (UGT, MRP2, OATP, OAT1 and OAT3 inhibitor) had no clinically relevant effect on the pharmacokinetics of canagliflozin.
| Table 10: Effect of Co-administered Drugs on Systemic Exposure of Canagliflozin | |||||||||||
|---|---|---|---|---|---|---|---|---|---|---|---|
| Co-administered Drug | Dose of Co-administered Drug1 | Dose of Canagliflozin1 | Geometric Mean Ratio (Ratio With/Without Co-administered Drug) No Effect = 1.0 | Clinical Comment | |||||||
AUC2 (90% CI) | Cmax (90% CI) | ||||||||||
| Cyclosporin | 400 mg | 300 mg once daily for 8 days | 1.23 (1.19; 1.27) | 1.01 (0.91; 1.11) | No dosage adjustment for INVOKAMET® required | ||||||
| Ethinyl estradiol and levonorgestrel | 0.03 mg ethinyl estradiol and 0.15 mg levonorgestrel | 200 mg once daily for 6 days | 0.91 (0.88; 0.94) | 0.92 (0.84; 0.99) | No dosage adjustment for INVOKAMET® required | ||||||
| Hydrochlorothiazide | 25 mg once daily for 35 days | 300 mg once daily for 7 days | 1.12 (1.08; 1.17) | 1.15 (1.06; 1.25) | No dosage adjustment for INVOKAMET® required | ||||||
| Probenecid | 500 mg twice daily for 3 days | 300 mg once daily for 17 days | 1.21 (1.16; 1.25) | 1.13 (1.00; 1.28) | No dosage adjustment for INVOKAMET® required | ||||||
| Inducers of UGT enzymes / drug transporters | |||||||||||
| Rifampin | 600 mg once daily for 8 days | 300 mg | 0.49 (0.44; 0.54) | 0.72 (0.61; 0.84) | Consider increasing the INVOKAMET® dose to 300 mg once daily if patients are currently tolerating INVOKAMET® 100 mg once daily (refer to DOSAGE AND ADMINISTRATION). | ||||||
| Phenytoin, phenobarbital, barbiturates, carbamazepine, ritonavir, efavirenz, or St. John’s Wort | N/A3 | Consider increasing the INVOKAMET® dose to 300 mg once daily if patients are currently tolerating INVOKAMET® 100 mg once daily (refer to DOSAGE AND ADMINISTRATION). | |||||||||
1 Single dose unless otherwise noted 2 AUCinf for drugs given as a single dose and AUC24h for drugs given as multiple doses. 3 N/A = Not applicable | |||||||||||
Effects of canagliflozin on other drugs
Canagliflozin at steady-state had no clinically relevant effect on the pharmacokinetics of metformin, oral contraceptives (ethinyl estradiol and levonorgestrel-CYP3A4 substrates), glyburide (CYP2C9 substrate), simvastatin (CYP3A4 substrate), acetaminophen, hydrochlorothiazide, or warfarin (CYP2C9 substrate), in healthy subjects.
Inhibition of BCRP by canagliflozin cannot be excluded at an intestinal level and increased exposure may therefore occur for drugs transported by BCRP, e.g., certain statins like rosuvastatin and some anti-cancer agents.
| Table 11: Effect of Canagliflozin on Systemic Exposure of Co-Administered Drugs | ||||||||
|---|---|---|---|---|---|---|---|---|
| Co-Administered Drug | Dose of Co-Administered Drug1 | Dose of Canagliflozin1 | Geometric Mean Ratio (Ratio With/Without Co-Administered Drugs) No Effect = 1.0 | Clinical Comment | ||||
AUC2 (90% CI) | Cmax (90% CI) | |||||||
| Digoxin | 0.5 mg once daily first day followed by 0.25 mg once daily for 6 days | 300 mg once daily for 7 days | Digoxin | 1.20 (1.12; 1.28) | 1.36 (1.21; 1.53) | Patients taking INVOKAMET® with concomitant digoxin should be monitored appropriately | ||
| Ethinyl estradiol and levonorgestrel | 0.03 mg ethinyl estradiol and 0.15 mg levonorgestrel | 200 mg once daily for 6 days | ethinyl estradiol | 1.07 (0.99; 1.15) | 1.22 (1.10; 1.35) | No dosage adjustment required for ethinyl estradiol and levonorgestrel | ||
| Levonorgestrel | 1.06 (1.00; 1.13) | 1.22 (1.11; 1.35) | ||||||
| Glyburide | 1.25 mg | 200 mg once daily for 6 days | Glyburide | 1.02 (0.98; 1.07) | 0.93 (0.85; 1.01) | No dosage adjustment required for glyburide | ||
| 3-cis-hydroxy-glyburide | 1.01 (0.96; 1.07) | 0.99 (0.91; 1.08) | ||||||
| 4-trans-hydroxy-glyburide | 1.03 (0.97; 1.09) | 0.96 (0.88; 1.04) | ||||||
| Hydrochloro-thiazide | 25 mg once daily for 35 days | 300 mg once daily for 7 days | hydrochlorothiazide | 0.99 (0.95; 1.04) | 0.94 (0.87; 1.01) | No dosage adjustment required for hydrochlorothiazide | ||
| Acetaminophen | 1000 mg | 300 mg twice daily for 25 days | Acetaminophen | 1.063 (0.98; 1.14) | 1.00 (0.92; 1.09) | No dosage adjustment required for acetaminophen | ||
| Simvastatin | 40 mg | 300 mg once daily for 7 days | Simvastatin | 1.12 (0.94; 1.33) | 1.09 (0.91; 1.31) | No dosage adjustment required for simvastatin | ||
| simvastatin acid | 1.18 (1.03; 1.35) | 1.26 (1.10; 1.45) | ||||||
| Warfarin | 30 mg | 300 mg once daily for 12 days | (R)-warfarin | 1.01 (0.96; 1.06) | 1.03 (0.94; 1.13) | No dosage adjustment required for warfarin | ||
| (S)-warfarin | 1.06 (1.00; 1.12) | 1.01 (0.90; 1.13) | ||||||
1 Single dose unless otherwise noted 2 AUCinf for drugs given as a single dose and AUC24h for drugs given as multiple doses. 3 AUC0-12h | ||||||||
Metformin hydrochloride
Glyburide: In a single-dose interaction study in type 2 diabetes patients, coadministration of metformin and glyburide did not result in any changes in either metformin pharmacokinetics or pharmacodynamics. Decreases in glyburide AUC and Cmax were observed, but were highly variable. The single-dose nature of this study and the lack of correlation between glyburide blood levels and pharmacodynamic effects make the clinical significance of this interaction uncertain.
Furosemide: A single-dose, metformin-furosemide drug interaction study in healthy subjects demonstrated that pharmacokinetic parameters of both compounds were affected by coadministration. Furosemide increased the metformin plasma and blood Cmax by 22% and blood AUC by 15%, without any significant change in metformin renal clearance. When administered with metformin, the Cmax and AUC of furosemide were 31% and 12% smaller, respectively, than when administered alone, and the terminal half-life was decreased by 32%, without any significant change in furosemide renal clearance. No information is available about the interaction of metformin and furosemide when coadministered chronically.
Nifedipine: A single-dose, metformin-nifedipine drug interaction study in normal healthy volunteers demonstrated that coadministration of nifedipine increased plasma metformin Cmax and AUC by 20% and 9%, respectively, and increased the amount excreted in the urine. Tmax and half-life were unaffected. Nifedipine appears to enhance the absorption of metformin. Metformin had minimal effects on nifedipine.
Cationic drugs: Cationic drugs (e.g., amiloride, digoxin, morphine, procainamide, quinidine, quinine, ranitidine, triamterene, trimethoprim, or vancomycin) that are eliminated by renal tubular secretion, theoretically have the potential for interaction with metformin by competing for common renal tubular transport systems. Such an interaction has been observed between metformin and oral cimetidine in normal healthy volunteers in both single- and multiple-dose, metformin-cimetidine drug interaction studies, with a 60% increase in peak metformin plasma and whole blood concentrations and a 40% increase in plasma and whole blood metformin AUC.
There was no change in elimination half-life in the single-dose study. Metformin had no effect on cimetidine pharmacokinetics. Therefore, careful patient monitoring and dose adjustment of metformin or the interfering drug is recommended in patients who are taking cationic medications that are excreted via renal tubular secretion.
Anticoagulant: Elimination rate of the anticoagulant phenprocoumon has been reported to be increased by 20% when used concurrently with metformin. Therefore, patients receiving phenprocoumon or other antivitamin K anticoagulants should be monitored carefully when both types of drugs are used simultaneously. In such cases, an important increase of prothrombin time may occur upon cessation of INVOKAMET® therapy, with an increased risk of hemorrhage.
Other: Other drugs tend to produce hyperglycemia and may lead to loss of blood sugar control. These include the thiazides and other diuretics, corticosteroids, phenothiazines, thyroid products, estrogens, estrogen plus progestogen, oral contraceptives, phenytoin, nicotinic acid, sympathomimetics, calcium channel blocking drugs, isoniazid and beta-2-agonists. ACE inhibitors may decrease the blood glucose levels. When such drugs are administered to a patient receiving metformin the patient should be closely observed to maintain adequate glycemic control.
Diuretics, especially loop diuretics, may increase the risk of lactic acidosis due to their potential to decrease renal function.
Pharmacodynamic Interactions
Diuretics: INVOKAMET® is not recommended for use in patients receiving loop diuretics. Canagliflozin may add to the effect of diuretics and may increase the risk of hypovolemia and hypotension (see WARNINGS AND PRECAUTIONS and DOSAGE AND ADMINISTRATION).
Drug-Food Interactions
Interactions with food have not been established.
Drug-Herb Interactions
St John’s Wort (Hypericum perforatum) is a CYP3A4 inducer and co-administration with INVOKAMET® may result in loss of efficacy or reduced clinical response. Dosage adjustment may be required (see DOSAGE AND ADMINISTRATION).
Drug-Laboratory Interactions
Due to its mechanism of action, patients taking INVOKAMET® will test positive for glucose in their urine.
Increases in urinary glucose excretion with INVOKAMET® can falsely lower 1,5-anhydroglucitol (1,5 AG) levels and make measurements of 1,5 AG unreliable in assessing glycemic control. Therefore, 1,5-AG assays should not be used for assessment of glycemic control in patients on INVOKAMET®. For further detail, it may be advisable to contact the specific manufacturer of the 1,5-AG assay.
Metformin hydrochloride
Intravascular contrast studies with iodinated materials can lead to acute alteration of renal function and have been associated with lactic acidosis in patients receiving metformin (see CONTRAINDICATIONS and WARNINGS AND PRECAUTIONS).
Drug-Lifestyle Interactions
Effects on Ability to Drive and Use Machines
The effect of canagliflozin on the ability to drive and use machines has not been examined. However, patients should be alerted to the elevated risk of adverse reactions related to reduced intravascular volume, such as postural dizziness, and to the risk of hypoglycemia when
INVOKAMET® is used as add-on therapy with insulin or an insulin secretagogue (see WARNINGS AND PRECAUTIONS, ADVERSE REACTIONS and DOSAGE AND ADMINISTRATION).
Alcohol
Patients should be cautioned against excessive alcohol intake, either acute or chronic, when taking INVOKAMET®, since alcohol intake potentiates the effect of metformin on lactate metabolism (see CONTRAINDICATIONS). The risk of lactic acidosis is increased in acute alcohol intoxication, particularly in case of fasting or malnutrition or hepatic insufficiency. INVOKAMET® is contraindicated in patients with clinical or laboratory evidence of hepatic disease (see CONTRAINDICATIONS). It is recommended that consumption of alcohol and alcohol-containing medicinal product be avoided.
DOSAGE AND ADMINISTRATION
Prior to Initiation of INVOKAMET®
Assess renal function before initiating INVOKAMET® and periodically thereafter (see WARNINGS AND PRECAUTIONS). In patients with volume depletion not previously treated with canagliflozin, normalize volume status before initiating INVOKAMET® (see WARNINGS AND PRECAUTIONS).
Dosing Considerations
Concomitant Use with Insulin or an Insulin Secretagogue (e.g., Sulfonylurea)
When INVOKAMET® is used as add-on therapy with insulin or an insulin secretagogue (e.g., sulfonylurea), a lower dose of insulin or the insulin secretagogue may be considered to reduce the risk of hypoglycemia (see WARNINGS AND PRECAUTIONS and ADVERSE REACTIONS).
Concomitant Use with UDP-Glucuronosyl Transferase (UGT) Enzyme Inducers
If an inducer of UGTs and drug transport systems (e.g., rifampin, phenytoin, barbituates, phenobarbitol, ritonavir, carbamazepine, efavirenz, St John’s wort [Hypericum perforatum]) is co-administered with INVOKAMET®, monitor A1C and consider increasing the dose to canagliflozin 150 mg twice daily in patients currently tolerating 50 mg canagliflozin twice daily who have an eGFR ≥ 60 mL/min/1.73 m2 or CrCl ≥ 60 mL/min and require additional glycemic control. Consider another antihyperglycemic agent in patients with CrCl less than 60 mL/min.
Diuretics
INVOKAMET® is not recommended for use in patients on loop diuretics.
Recommended Dose and Dosage Adjustment
Recommended Adult Dose (18 years of age and older)
The dosage of INVOKAMET® (canagliflozin and metformin hydrochloride) should be individualized on the basis of both effectiveness and tolerability, while not exceeding the maximum recommended dose of 150 mg canagliflozin/1000 mg metformin hydrochloride twice daily.
INVOKAMET® dose escalation should be gradual to reduce the gastrointestinal side effects associated with metformin use.
INVOKAMET® should be taken orally twice a day with meals to reduce the risk of gastrointestinal side effects associated with metformin use. Tablets are to be swallowed whole.
The following dosage strengths are available:
- 50 mg canagliflozin/500 mg metformin hydrochloride
- 50 mg canagliflozin/850 mg metformin hydrochloride
- 50 mg canagliflozin/1000 mg metformin hydrochloride
- 150 mg canagliflozin/500 mg metformin hydrochloride
- 150 mg canagliflozin/850 mg metformin hydrochloride
- 150 mg canagliflozin/1000 mg metformin hydrochloride
- In patients on metformin (alone or in combination with a sulfonylurea, pioglitazone, or insulin), switch to INVOKAMET® containing canagliflozin 50 mg with a similar total daily dose of metformin;
- In patients already treated with canagliflozin and metformin (alone or in combination with a sulfonylurea, pioglitazone, or insulin), switch to INVOKAMET® containing the same total daily doses of each component.
For patients who are tolerating INVOKAMET® containing 50 mg canagliflozin taken twice daily who have an eGFR ≥ 60 mL/min/1.73 m2, who need tighter glycemic control and who have a low risk of adverse reactions associated with reduced intravascular volume, the dose can be increased to INVOKAMET® containing 150 mg canagliflozin taken twice daily (see WARNINGS AND PRECAUTIONS).
Pediatrics (< 18 years of age)
The safety and efficacy of INVOKAMET® have not been established in pediatric patients. Therefore, INVOKAMET® should not be used in this population.
Elderly
Due to the potential for decreased renal function in elderly subjects, the dosage of
INVOKAMET® should be adjusted based on renal function. Regular assessment of renal function is necessary (see WARNINGS AND PRECAUTIONS).
Renal function and risk of volume depletion should be taken into account (see WARNINGS AND PRECAUTIONS and ADVERSE REACTIONS). For those patients who are tolerating canagliflozin 50 mg twice daily and who need tighter glycemic control, the dose can be increased to canagliflozin 150 mg twice daily. See section below for dosing recommendations in renally impaired patients.
Renal Impairment
No dose adjustment is needed in patients with mild renal impairment (eGFR of 60 mL/min/1.73 m2 to < 90 mL/min/1.73 m2 or greater).
Hepatic Impairment
INVOKAMET® is contraindicated in patients with clinical or laboratory evidence of hepatic disease (see CONTRAINDICATIONS). Metformin use in patients with impaired hepatic function has been associated with some cases of lactic acidosis (see WARNINGS AND PRECAUTIONS).
Missed Dose
If a dose of INVOKAMET® is missed, it should be taken as soon as the patient remembers unless it is almost time for the next dose in which case patients should skip the missed dose and take the medicine at the next regularly scheduled time.
OVERDOSAGE
Canagliflozin
Single doses up to 1600 mg of canagliflozin in healthy subjects and canagliflozin 300 mg twice daily for 12 weeks in patients with type 2 diabetes were generally well-tolerated.
In the event of an overdose, contact the Poison Control Centre. It is also reasonable to employ the usual supportive measures, e.g., remove unabsorbed material from the gastrointestinal tract, employ clinical monitoring, and institute supportive treatment as dictated by the patient’s clinical status. Canagliflozin was negligibly removed during a 4-hour hemodialysis session. Canagliflozin is not expected to be dialyzable by peritoneal dialysis.
Metformin
Available information concerning treatment of a massive overdosage of metformin hydrochloride is very limited. It would be expected that adverse reactions of a more intense character including epigastric discomfort, nausea and vomiting followed by diarrhea, drowsiness, weakness, dizziness, malaise and headache might be seen. Should those symptoms persist, lactic acidosis should be excluded. The drug should be discontinued and proper supportive therapy instituted.
Overdose of metformin hydrochloride has occurred, including ingestion of amounts greater than 50 grams. Hypoglycemia was reported in approximately 10% of cases, but no causal association with metformin hydrochloride has been established. Lactic acidosis has been reported in approximately 32% of metformin overdose cases (see WARNINGS AND PRECAUTIONS, Endocrine and Metabolism, Lactic Acidosis). Metformin is dialyzable with a clearance of up to 170 mL/min under good hemodynamic conditions. Therefore, hemodialysis may be useful for removal of accumulated drug from patients in whom metformin overdosage is suspected.
| For management of a suspected drug overdose, contact your regional Poison Control Centre. |
ACTION AND CLINICAL PHARMACOLOGY
Mechanism of Action
INVOKAMET®
INVOKAMET® (canagliflozin and metformin hydrochloride) combines two oral
antihyperglycemic agents with complementary mechanisms of action to improve glycemic control in patients with type 2 diabetes: canagliflozin, a sodium-glucose co-transporter 2
(SGLT2) inhibitor, and metformin hydrochloride, a member of the biguanide class.
Canagliflozin
Sodium-glucose co-transporter 2 (SGLT2), expressed in the proximal renal tubules, is responsible for the majority of the reabsorption of filtered glucose from the tubular lumen. Patients with diabetes have been shown to have elevated renal glucose reabsorption which may contribute to persistent elevated glucose concentrations. Canagliflozin is an orally-active inhibitor of SGLT2. By inhibiting SGLT2, canagliflozin reduces reabsorption of filtered glucose and lowers the renal threshold for glucose (RTG), and thereby increases urinary glucose excretion, which decreases elevated plasma glucose concentrations by an insulin-independent mechanism in patients with type 2 diabetes. The increased urinary glucose excretion with SGLT2 inhibition also translates to an osmotic diuresis, with the diuretic effect leading to a reduction in systolic blood pressure; the increase in urinary glucose excretion results in a loss of calories and therefore a reduction in body weight, as demonstrated in studies of patients with type 2 diabetes.
Canagliflozin’s action to increase UGE directly lowering plasma glucose is independent of insulin. Improvement in homeostasis model assessment for beta-cell function (HOMA beta-cell) and improved beta-cell insulin secretion response to a mixed-meal challenge has been observed in clinical studies with canagliflozin.
In Phase 3 studies, pre-meal administration of canagliflozin 300 mg provided a greater reduction in post-meal glucose excursion than observed with the 100 mg dose. This effect at the 300 mg dose of canagliflozin may, in part, be due to local inhibition of intestinal SGLT1 (an important intestinal glucose co-transporter) related to transient high concentrations of canagliflozin in the intestinal lumen prior to drug absorption (canagliflozin is a low potency inhibitor of SGLT1). Studies have shown no glucose malabsorption with canagliflozin.
Canagliflozin increases the delivery of sodium to the distal tubule by blocking SGLT2-dependent glucose and sodium reabsorption.
Metformin
Metformin is a biguanide derivative producing an antihyperglycemic effect which can only be observed in man or in the diabetic animal and only when there is insulin secretion. Metformin, at therapeutic doses, does not cause hypoglycemia when used alone in man or in the non-diabetic animal, except when using a near lethal dose. Metformin has no effects on the pancreatic beta cells. The mode of action of metformin is not fully understood. It has been postulated that metformin might potentiate the effect of insulin or that it might enhance the effect of insulin on the peripheral receptor site. This increased sensitivity seems to follow an increase in the number of insulin receptors on cell surface membranes.
Pharmacodynamics
Following single and multiple oral doses of canagliflozin to patients with type 2 diabetes, dose-dependent decreases in RTG and increases in urinary glucose excretion were observed. From a starting value of RTG of approximately 13 mmol/L, maximal suppression of 24-hour mean RTG was seen with the 300 mg daily dose to approximately 4 to 5 mmol/L in patients with type 2 diabetes in Phase 1 studies (see model in Figure 3), suggesting a low risk for treatment-induced hypoglycemia. The reductions in RTG led to increased UGE in subjects with type 2 diabetes treated with either 100 mg or 300 mg of canagliflozin ranging from 77 to 119 g/day across the Phase 1 studies; the UGE observed translates to a loss of 308 to 476 kcal/day. The reductions in RTG and increases in UGE were sustained over a 26-week dosing period in patients with type 2 diabetes. Moderate increases (generally < 400-500 mL) in daily urine volume were seen that attenuated over several days of dosing. Urinary uric acid excretion was transiently increased by canagliflozin (increased by 19% compared to baseline on day 1 and then attenuating to 6% on day 2 and 1% on day 13). This was accompanied by a sustained reduction in serum uric acid concentration of approximately 20%.
Figure 3: Predicted (PK/PD Modelled) 24-Hour Profile for RTG in Subjects with Type 2 Diabetes Treated with Canagliflozin 100 mg and 300 mg
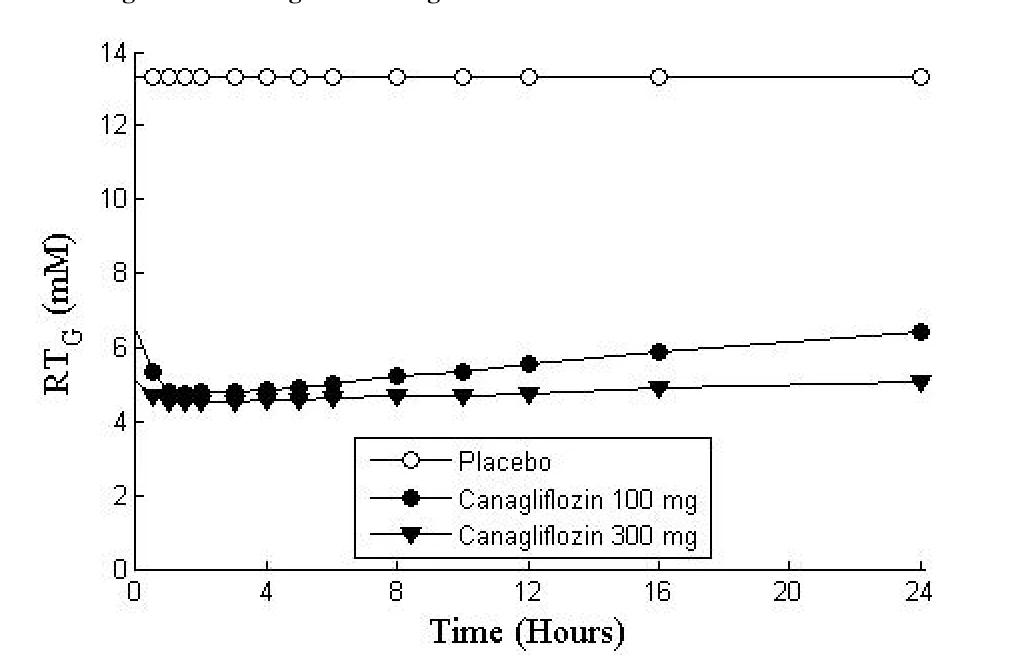
In a single-dose study in patients with type 2 diabetes, treatment with 300 mg before a mixed meal delayed intestinal glucose absorption and reduced postprandial glucose through both renal and non-renal mechanisms.
Cardiac electrophysiology
In a randomized, double-blind, placebo-controlled, active-comparator, 4-way crossover study, 60 healthy subjects were administered a single oral dose of canagliflozin 300 mg, canagliflozin 1200 mg (4 times the maximum recommended dose), moxifloxacin, and placebo. No meaningful changes in QTc interval were observed with either the recommended dose of 300 mg or the 1200 mg dose. At the 1200 mg dose, peak canagliflozin plasma concentrations were approximately 1.4 times the steady-state peak concentrations following a 300 mg once-daily dose.
Pharmacokinetics
Pharmacokinetics of canagliflozin were comparable between healthy volunteers and type 2 diabetic patients based on clinical trials and population pharmacokinetic data. After single-dose oral administration of 100 mg and 300 mg in healthy subjects, canagliflozin was rapidly absorbed, with peak plasma concentrations (median Tmax) occurring 1 to 2 hours post-dose. Plasma Cmax and AUC of canagliflozin increased in a dose-proportional manner from 50 mg to 300 mg. The apparent terminal half-life (t1/2) (expressed as mean ± standard deviation) was 10.6 ± 2.13 hours to 13.1 ± 3.28 hours for the 100 mg and 300 mg doses, respectively. Steady-state was reached after 4 to 5 days of once-daily dosing with canagliflozin 100 mg to 300 mg. Canagliflozin does not exhibit time-dependent pharmacokinetics, and accumulated in plasma up to 36% following multiple doses of 100 mg and 300 mg.
| Table 12: Summary of Canagliflozin’s Pharmacokinetic Parameters in Healthy Subjects and T2DM Patients at Steady State | ||||||||||||||
| N | Cmax (SD) (ng/mL) | t1/2 (h) | AUC24h (SD) (ng.h/mL) | Cl/F | Vd/F | |||||||||
| Healthy Volunteersa | ||||||||||||||
| 100 mg multiple oral doses qd | 9 | 1,118 (143) | 13.3 (4.8) | 6,056 (959) | 16.4 (2.16) | 304 (79.7) | ||||||||
| 300 mg multiple oral doses qd | 9 | 3,379 (728) | 13.5 (3.2) | 19,252 (5,348) | 16.4 (3.60) | 319 (104) | ||||||||
| T2DM Patientsb | ||||||||||||||
| 100 mg multiple oral doses qd | 8 | 1,227 (481) | 13.7 (2.1) | 8,225 (1,947) | 13.0 (4.43) | 250 (50.7) | ||||||||
| 300 mg multiple oral doses qd | 10 | 4,678 (1,685) | 14.9 (4.8) | 30,995 (11,146) | 11.3 (5.21) | 226 (89.4) | ||||||||
a From Study DIA1030
b From Study DIA1023
The results of bioequivalence studies in healthy subjects demonstrated that INVOKAMET® 50 mg/500 mg, 50 mg/850 mg, 50 mg/1000 mg, 150 mg/500 mg, 150 mg/850 mg, and 150 mg/1000 mg combination tablets are bioequivalent to co-administration of corresponding doses of canagliflozin and metformin hydrochloride as individual tablets.
Administration of INVOKAMET® 150 mg/1000 mg fixed-dose combination with food resulted in no change in overall exposure of canagliflozin. There was no change in metformin AUC; however, mean peak plasma concentration of metformin was decreased by 16% when administered with food. A delayed time to peak plasma concentration was observed for both components (2 hours for canagliflozin and 1 hour for metformin) under fed conditions. These changes are not likely to be clinically significant. As metformin is recommended to be administered with a meal to reduce the incidence of gastrointestinal side effects, it is recommended that INVOKAMET® be taken with a meal to reduce gastrointestinal intolerability associated with metformin.
The 24-h mean RTG at steady state was similar following once daily and twice daily dosing regimens at the same total daily dose of 100 mg or 300 mg. The mean systemic exposure (AUC) at steady state was similar following once daily and twice daily dosing regimens at the same total daily dose of 100 mg or 300 mg.
Absorption
Canagliflozin
The mean absolute oral bioavailability of canagliflozin is approximately 65%. Co-administration of a high-fat meal with canagliflozin had no effect on the pharmacokinetics of canagliflozin; therefore, canagliflozin may be taken with or without food (see DOSAGE AND ADMINISTRATION).
Metformin hydrochloride
Metformin absorption is relatively slow and may extend over 6 hours
Distribution
Canagliflozin
The mean steady-state volume of distribution of canagliflozin following a single intravenous infusion in healthy subjects was 119 L, suggesting extensive tissue distribution. Canagliflozin is extensively bound to proteins in plasma (99%), mainly to albumin. Protein binding is independent of canagliflozin plasma concentrations. Plasma protein binding is not meaningfully altered in patients with renal or hepatic impairment.
Metformin
Plasma protein binding is negligible. Metformin partitions into erythrocytes. The blood peak is lower than the plasma peak and appears at approximately the same time. The red blood cells most likely represent a secondary compartment of distribution. The mean Vd ranged between 63 – 276 liters.
Metabolism
Canagliflozin
O-glucuronidation is the major metabolic elimination pathway for canagliflozin, which is mainly glucuronidated by UGT1A9 and UGT2B4 to two inactive O-glucuronide metabolites. CYP3A4-mediated (oxidative) metabolism of canagliflozin is minimal (approximately 7%) in humans.
Metformin
Metformin is not metabolized. Its main sites of concentration are the intestinal mucosa and the salivary glands. The plasma concentration at steady-state ranges about 1 to 2 mcg/mL. Certain drugs may potentiate the effects of metformin (see WARNINGS AND PRECAUTIONS and DRUG INTERACTIONS).
Excretion
Canagliflozin
Following administration of a single oral [14C] canagliflozin dose to healthy subjects, 41.5%, 7.0%, and 3.2% of the administered radioactive dose was recovered in faeces as canagliflozin, a hydroxylated metabolite, and an O-glucuronide metabolite, respectively. Enterohepatic circulation of canagliflozin was negligible.
Approximately 33% of the administered radioactive dose was excreted in urine, mainly as O-glucuronide metabolites (30.5%). Less than 1% of the dose was excreted as unchanged canagliflozin in urine. Renal clearance for the 100 mg and 300 mg doses ranged from 1.30 to 1.55 mL/min.
Canagliflozin is a low-clearance drug, with a mean systemic clearance of approximately 192 mL/min in healthy subjects following intravenous administration.
Metformin
Metformin is excreted in urine at high renal clearance rate of about 450 mL/min. The initial elimination of metformin is rapid with a half-life varying between 1.7 and 3 hours. The terminal elimination phase accounting for about 4 to 5 % of the absorbed dose is slow with a half-life between 9 and 17 hours.
Special Populations and Conditions
Pediatrics (< 18 years of age):
Based on the data submitted and reviewed by Health Canada, the safety and efficacy of canagliflozin in pediatric patients <18 years of age have not been established; therefore, Health Canada has not authorized an indication for pediatric use (see WARNING AND PRECAUTIONS, Pediatrics).
An open-label, sequential, multiple-dose, multicentre pediatric Phase 1 study examined the pharmacokinetics and pharmacodynamics of canagliflozin in children and adolescents
≥11 to <18 years of age (mean age 14.6 years) with type 2 diabetes mellitus who were on a stable dose of metformin. The mean body weight was 107.15 kg (range: 48.5 to 168.6 kg).
The patients were treated with canagliflozin once-daily 100 mg or 300 mg for 14 days.
Mean (SD) Plasma Canagliflozin Pharmacokinetic Parameters on Day 14
| Parameters | Canagliflozin 100 mg QD (N=8) Mean (Std. Dev.) | Canagliflozin 300 mg QD (N=9) Mean (Std. Dev.) |
| Cmax (ng/mL) | 951 (429) | 3,260 (1,330) |
| AUC (h*ng/mL) | 6,190 (1,770) | 28,392 (12,412) |
| t1/2 (h) | 11.3 (2.5) | 15.2 (6.9) |
| CLss/F (L/h) | 17.5 (5.78) | 12.3 (6.90) |
Geriatrics (≥ 65 years of age):
INVOKAMET®
Studies characterizing the pharmacokinetics of canagliflozin and metformin after administration of INVOKAMET® in geriatric patients have not been performed.
Canagliflozin
Age had no clinically meaningful effect on the pharmacokinetics of canagliflozin based on a population pharmacokinetic analysis. However, patients 65 years and older had a higher incidence of adverse reactions related to reduced intravascular volume with INVOKAMET® (see WARNINGS AND PRECAUTIONS, ADVERSE REACTIONS and DOSAGE AND ADMINISTRATION).
Metformin
Controlled clinical studies of metformin did not include sufficient numbers of elderly patients to determine whether they respond differently from younger patients.
Body Mass Index (BMI)/Weight, Gender and Race:
Canagliflozin
Body weight: For subjects with body weight <78.2 kg, the dose normalized exposures of canagliflozin increased by 33%, based on population pharmacokinetic analysis. These increases in exposures are not clinically meaningful and hence no dosage adjustment of canagliflozin is necessary based on body weight.
Gender: Dose normalized exposures of canagliflozin in females were 22% higher than males, based on population pharmacokinetic analysis. These increases in exposures are not clinically meaningful and hence no dosage adjustment of canagliflozin is necessary based on gender.
Race: Dose normalized exposures of canagliflozin were comparable in white and non-white subjects, Blacks, Asians, and other races. A population PK analysis of canagliflozin in 942 white subjects and 674 non-white subjects showed no significant impact of race on canagliflozin PK and hence no dosage adjustment of canagliflozin is necessary based on race.
Metformin
Controlled clinical studies of metformin did not include sufficient numbers of elderly patients to determine whether they respond differently from younger patients.
No studies of metformin pharmacokinetic parameters according to race have been performed.
Hepatic Insufficiency:
Canagliflozin
INVOKAMET® is contraindicated in patients with clinical or laboratory evidence of hepatic disease (see CONTRAINDICATIONS). Relative to subjects with normal hepatic function, the geometric mean ratios for Cmax and AUC∞ of canagliflozin were 107% and 110%, respectively, in subjects with Child-Pugh class A (mild hepatic impairment) and 96% and 111%, respectively, in subjects with Child-Pugh class B (moderate hepatic impairment) following administration of a single 300 mg dose of canagliflozin.
These differences are not considered to be clinically meaningful. There is no clinical experience in patients with Child-Pugh class C (severe) hepatic impairment and therefore, canagliflozin is not recommended for use in this patient population.
Metformin
No pharmacokinetic studies of metformin have been conducted in patients with hepatic
Insufficiency.
Renal Insufficiency:
Canagliflozin
A single-dose, open-label study evaluated the pharmacokinetics of canagliflozin 200 mg in subjects with varying degrees of renal impairment, classified using the Modification of Diet in Renal Disease (MDRD)-eGFR formula, compared to healthy subjects. The study included 3 subjects with normal renal function (eGFR ≥ 90 mL/min/1.73 m2), 10 subjects with mild renal impairment (eGFR 60 to < 90 mL/min/1.73 m2), 9 subjects with moderate renal impairment (eGFR 30 to < 60 mL/min/1.73 m2), and 10 subjects with severe renal impairment (eGFR 15 to < 30 mL/min/1.73 m2) as well as 8 subjects with end stage renal disease (ESRD) on hemodialysis.
The Cmax of canagliflozin was moderately increased by 13%, 29%, and 29% in subjects with mild, moderate, and severe renal failure, respectively, but not in subjects on hemodialysis. Compared to healthy subjects, plasma AUC of canagliflozin was increased by approximately 17%, 63%, and 50% in subjects with mild, moderate, and severe renal impairment, respectively, but was similar for ESRD subjects and healthy subjects. Increases in canagliflozin AUC of this magnitude are not considered clinically relevant, however, the pharmacodynamic response to canagliflozin declines with increasing severity of renal impairment (see CONTRAINDICATIONS and WARNINGS AND PRECAUTIONS). Canagliflozin was negligibly removed by hemodialysis.
Genetic polymorphism: Both UGT1A9 and UGT2B4 are subject to genetic polymorphism. In a pooled analysis of clinical data, increases in canagliflozin AUC of 26% were observed in UGT1A9*1/*3 carriers and 18% in UGT2B4*2/*2 carriers. These increases in canagliflozin exposure are not expected to be clinically relevant and no dosage adjustment is necessary based on UGT1A9 and UGT2B4 genetic polymorphisms. The effect of being homozygote (UGT1A9*3/*3, frequency < 0.1%) is probably more marked, but has not been investigated.
STORAGE AND STABILITY
INVOKAMET® tablets should be stored at 15-30°C.
SPECIAL HANDLING INSTRUCTIONS
Keep INVOKAMET® out of the sight and reach of children.
DOSAGE FORMS, COMPOSITION AND PACKAGING
INVOKAMET® is supplied as film-coated, immediate-release tablets for oral administration. Each tablet strength contains canagliflozin drug substance as the hemihydrate equivalent to 50 mg or 150 mg of anhydrous canagliflozin, and metformin hydrochloride in quantities of 500 mg, 850 mg or 1000 mg tablet strengths are supplied in bottles of 60, inside cartons.
The available tablet strengths are listed below:
| Strength | Description |
| 50 mg + 500 mg | Capsule-shaped, white, film-coated tablets with “CM” on one side and “155” on the other side |
| 50 mg + 850 mg | Capsule shaped, pink, film-coated tablets with “CM” on one side and “358” on the other side |
| 50 mg + 1000 mg | Capsule shaped, beige, film-coated tablets with “CM” on one side and “551” on the other side |
| 150 mg + 500 mg | Capsule shaped, yellow, film-coated tablets with “CM” on one side and “215” on the other side |
| 150 mg + 850 mg | Capsule shaped, light yellow, film-coated tablets with “CM” on one side and “418” on the other side |
| 150 mg + 1000 mg | Capsule shaped, purple, film-coated tablets with “CM” on one side and “611” on the other side |
Composition
Each tablet contains the following non-medicinal ingredients:
Core Tablet: croscarmellose sodium, hypromellose (2910), magnesium stearate, and microcrystalline cellulose.
Film Coat: iron oxide black (50 mg/850 mg and 150 mg/1000 mg tablets, iron oxide red (50 mg/850 mg, 50 mg/1000 mg, 150 mg/500 mg and 150/1000 mg tablets ), iron oxide yellow (50 mg/1000 mg, 150 mg/500 mg, and 150 mg/850 mg tablets), macrogol (polyethylene glycol), polyvinyl alcohol (partially hydrolyzed), talc, and titanium dioxide.
PART II: SCIENTIFIC INFORMATION
PHARMACEUTICAL INFORMATION
Drug Substance: Canagliflozin plus metformin hydrochloride
| Proper name: | Canagliflozin | Metformin hydrochloride |
| Chemical name: | (1S)-1,5-anhydro-1-[3-[[5-(4-fluorophenyl)-2-thienyl]methyl]-4-methylphenyl]-D-glucitol hemihydrate | 1,1-Dimethylbiguanide hydrochloride |
| Molecular formula: | C24H25FO5S•1/2 H2O | C4H11N5•HCl |
| Molecular mass: |
| 165.62 |
| Structural formula: | ||
| Physicochemical properties: | Canagliflozin is practically insoluble in aqueous media from pH 1.1 to 12.9. There is no detectable pKa value for this substance. | Metformin hydrochloride is freely soluble in various aqueous media, irrespective of pH,and has low permeability. |
CLINICAL TRIALS
There have been no clinical efficacy studies conducted with INVOKAMET®, however, bioequivalence of INVOKAMET® to canagliflozin and metformin co-administered as individual tablets was demonstrated in healthy subjects (see ACTION AND CLINICAL PHARMACOLOGY, Pharmacokinetics). The co-administration of canagliflozin and metformin has been studied in patients with type 2 diabetes inadequately controlled on diet and exercise and as add-on therapy with other antihyperglycemic agents.
Canagliflozin
Five placebo- or active-controlled studies investigated canagliflozin as add-on therapy with other antihyperglycemic agents: two studies with metformin (26 and 52 weeks); two studies with metformin and sulfonylurea (26 and 52 weeks), and one study with metformin and pioglitazone (26 weeks). A cardiovascular study was conducted in patients with type 2 diabetes; safety
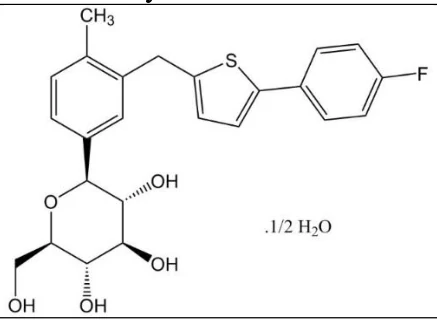 | 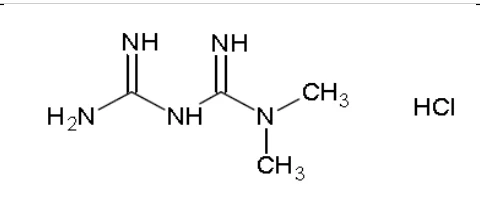 |
analyses were conducted that investigated canagliflozin as add-on therapy with a sulfonylurea and with insulin. A long-term renal outcomes study has been conducted in patients with type 2 diabetes and diabetic nephropathy on a background of standard of care including maximally tolerated labelled ACEi and ARB treatments.
Study Demographics and Trial Design
| Table 13: Summary of Patient Demographics for Clinical Trials in Specific Indication | |||||||||
|---|---|---|---|---|---|---|---|---|---|
| Study # | Trial design | Dosage, route of administration and duration | Study subjects (n=number) | Mean age (Range) | Gender (% F/M) | ||||
| Add-on Therapy with Metformin (≥ 1500 mg/day) | |||||||||
| DIA3006 | Randomized, double-blind, active-controlled, parallel-group, multicentre | Canagliflozin 100 or 300 mg/day or Sitagliptin 100 mg/day or Placebo 26-week | Total: 1284 Canagliflozin 100 mg: 368 Canagliflozin 300 mg: 367 Sitagliptin 100 mg: 366 Placebo: 183 | 55.4 (21-79) | 52.9/47.1 | ||||
| DIA3009 | Randomized, double-blind, active-controlled, parallel-group, multicentre | Canagliflozin 100 or 300 mg/day or Glimepiride 1- 8 mg (titration protocol) 52-week | Total: 1450 Canagliflozin 100 mg: 483 Canagliflozin 300 mg: 485 Glimepiride: 482 | 56.2 (22-80) | 47.9/52.1 | ||||
| Add-on Therapy with Metformin (≥ 1500 mg/day) and a Sulfonylurea (stable dose) | |||||||||
| DIA3002 | Randomized, double-blind, placebo-controlled, parallel-group, multicentre | Canagliflozin 100 or 300 mg/day or Placebo 26-week | Total: 469 Canagliflozin 100 mg: 157 Canagliflozin 300 mg: 156 Placebo: 156 | 56.8 (27-79) | 49.0/51.0 | ||||
| DIA3015 | Randomized, double-blind, active-controlled, parallel-group, multicentre | Canagliflozin 300 mg/day or Sitagliptin 100 mg/day or Placebo 52-week | Total: 755 Canagliflozin 300 mg: 377 Sitagliptin 100 mg: 378 | 56.7 (21-91) | 44.1/55.9 | ||||
| Add-on Therapy with Metformin (≥ 1500 mg/day) and Pioglitazone (30 or 45 mg/day) | |||||||||
| DIA3012 | Randomized, double-blind, placebo-controlled, parallel-group, multicentre | Canagliflozin 100 or 300 mg/day or Placebo 26-week | Total: 342 Canagliflozin 100 mg: 113 Canagliflozin 300 mg: 114 Placebo: 115 | 57.4 (27-78) | 36.8/63.2 | ||||
| Table 13: Summary of Patient Demographics for Clinical Trials in Specific Indication |
|---|
| Study # | Trial design | Dosage, route of administration and duration | Study subjects (n=number) | Mean age (Range) | Gender (% F/M) |
|---|---|---|---|---|---|
| Cardiovascular | |||||
| DIA3008 | Randomized, double-blind, placebo-controlled, parallel-group, Multicentre | Canagliflozin 100 or 300 mg/day or Placebo mean 223 weeks exposure to study drug | Total: 4330 Canagliflozin 100 mg: 1445 Canagliflozin 300 mg: 1443 Placebo: 1442 | 63 (32-87) | 33.9/66.1 |
| DIA4003 | Randomized, double-blind, placebo-controlled, parallel-group, Multicentre | Canagliflozin 100 up-titrated to 300 mg/day at week 13 or later at investigators’ discretion mean 94 weeks exposure to study drug | Total: 5813 Canagliflozin 100 mg uptitrated: 2907 Placebo: 2906 | 64 (30-89) | 37.2/62.8 |
| Renal |
| DNE3001 | Randomized, double-blind, placebo-controlled, parallel-group, Multicentre | Canagliflozin 100 mg or Placebo mean 115 weeks exposure to study drug | Total: 4401 Canagliflozin 100 mg: 2202 Placebo: 2199 | 63 (30-89) | 33.9/66.1 |
| Add-on to Insulin and Metformin | |||||
| DIA 3008 Insulin Substudy (subset) | Randomized, double-blind, placebo-controlled, parallel-group, Multicentre | Canagliflozin 100 or 300 mg/day or Placebo 18 weeks | Total: 731 Canagliflozin 100 mg: 241 Canagliflozin 300 mg: 246 Placebo: 244 | 57.0 (21-91) | 46.1/53.9 |
| 1 AHA = antihyperglycemic agent | |||||
In the metformin add-on studies, a total of 5,031 patients with type 2 diabetes were randomized in six double-blind, controlled clinical efficacy and safety studies conducted to evaluate the effects of canagliflozin on glycemic control. The racial distribution was 71% White, 15% Asian, 5% Black, and 9% other groups. Approximately 20% of patients were Hispanic. Approximately 54% of patients were male. Patients had an overall mean age of 59.6 years (range 21 to 91 years), with 1036 patients 65 years of age and older and 121 patients 75 years of age and older,
In addition, an 18-week double-blind, placebo-controlled Phase 2 study with twice daily dosing (canagliflozin 50 mg or 150 mg in combination with metformin) was conducted in 279 patients in which 186 patients were treated with canagliflozin in combination with metformin.
Study Results
In patients with type 2 diabetes, treatment with canagliflozin produced statistically significant improvements in A1C, fasting plasma glucose (FPG), 2-hour postprandial glucose (PPG), and body weight, compared to placebo. Canagliflozin was effective in reducing A1C in a broad range of patients regardless of disease duration and concomitant use of antihyperglycemic agents. The durability of these reductions in A1C was demonstrated in two Phase 3 studies, with minimal attenuation of the glycemic response to canagliflozin over 52 weeks, in contrast to the deterioration of the glycemic response observed with comparators.
Statistically significant improvements in glycemic control relative to placebo were observed with canagliflozin when given as add on therapy with metformin, add-on therapy with metformin and a sulfonylurea, add-on therapy with metformin and pioglitazone, or as add-on therapy with insulin and metformin).
In addition, significant improvements in A1C were observed with canagliflozin in older patients. Reductions in A1C were observed across subgroups including age, gender, race, baseline body mass index (BMI), and baseline beta-cell function. Greater reductions in A1C relative to placebo were observed in patients with higher baseline A1C or eGFR values.
Add-on Therapy
Add-on Therapy with Metformin (Study DIA3006)
A total of 1284 patients with inadequate glycemic control (A1C of ≥ 7% to ≤10.5%) on metformin monotherapy (2,000 mg/day or at least 1,500 mg/day if higher dose not tolerated) participated in a randomized, double-blind, placebo- and active-controlled, parallel-group, 4-arm, multicentre clinical study to evaluate the efficacy of canagliflozin as add-on therapy with metformin over 26 weeks. The mean age was 55 years, 47% of patients were men, and the mean baseline eGFR was 89 mL/min/1.73 m2. Patients already on metformin (N=1009) at screening with inadequate glycemic control completed a 2-week, single-blind, placebo run-in period. Other patients on metformin and another oral agent or a lower than required dose of metformin (N=275) were switched to a regimen of metformin monotherapy. After at least 8 weeks on a stable dose of metformin monotherapy, patients entered a 2-week, single-blind, placebo run-in period. Patients were randomized to the addition of canagliflozin 100 mg, canagliflozin 300 mg, sitagliptin 100 mg, or placebo, administered once daily.
As shown in Table 14, statistically significant (p<0.001) reductions in A1C, FPG, PPG, and body weight relative to placebo were observed. In addition, a greater percentage of patients achieved an A1C < 7.0% compared to placebo. Statistically significant (p<0.001) reductions in systolic blood pressure were observed with canagliflozin 100 mg and 300 mg relative to placebo of -5.4 mmHg and -6.6 mmHg, respectively.
| Table 14: Results from Placebo-Controlled Clinical Study of Canagliflozin as Add-on Therapy with Metformin1 | ||||||||||||
|---|---|---|---|---|---|---|---|---|---|---|---|---|
| Efficacy Parameter | Canagliflozin + Metformin 26 weeks | Placebo + Metformin (N=183) | ||||||||||
100 mg (N=368) | 300 mg (N=367) | |||||||||||
| A1C (%) | ||||||||||||
| Baseline (mean) | 7.94 | 7.95 | 7.96 | |||||||||
| Change from baseline (adjusted mean) | -0.79 | -0.94 | -0.17 | |||||||||
| Difference from placebo (adjusted mean) (95% CI) | -0.622 (-0.76; -0.48) | -0.772 (-0.91; -0.64) | N/A3 | |||||||||
| Percent of patients achieving A1C < 7% | 45.52 | 57.82 | 29.8 | |||||||||
| Fasting Plasma Glucose (mmol/L) | ||||||||||||
| Baseline (mean) | 9.36 | 9.59 | 9.12 | |||||||||
| Change from baseline (adjusted mean) | -1.52 | -2.10 | 0.14 | |||||||||
| Difference from placebo (adjusted mean) (95% CI) | -1.652 (-1.99; -1.32) | -2.232 (-2.57; -1.90) | N/A3 | |||||||||
| 2-hour Postprandial Glucose (mmol/L) | ||||||||||||
| Baseline (mean) | 14.30 | 14.54 | 13.81 | |||||||||
| Change from baseline (adjusted mean) | -2.66 | -3.17 | -0.55 | |||||||||
| Difference from placebo (adjusted mean) (95% CI) | -2.122 (-2.73; -1.51) | -2.622 (-3.24; -2.01) | N/A3 | |||||||||
| Body Weight | ||||||||||||
| Baseline (mean) in kg | 88.7 | 85.4 | 86.7 | |||||||||
| % change from baseline (adjusted mean) | -3.7 | -4.2 | -1.2 | |||||||||
| Difference from placebo (adjusted mean) (95% CI) | -2.52 (-3.1; -1.9) | -2.92 (-3.5; -2.3) | N/A3 | |||||||||
1 Intent-to-treat population using last observation in study prior to glycemic rescue therapy 2 p<0.001 compared to placebo 3 N/A = Not applicable | ||||||||||||
Active-Controlled Study versus Glimepiride as add-on therapy with Metformin (Study DIA3009)
A total of 1450 patients with inadequate glycemic control (A1C level of ≥ 7% to ≤ 9.5%) on metformin monotherapy (≥ 2,000 mg/day or at least 1,500 mg/day if higher dose not tolerated) participated in a randomized, double-blind, active-controlled, parallel-group, 3-arm, multicentre clinical study to evaluate the efficacy of canagliflozin as add-on therapy with metformin over 52 weeks. The mean age was 56 years, 52% of patients were men, and the mean baseline eGFR was 90 mL/min/1.73 m2. Patients on metformin (N=928) at a stable protocol-specified dose entered a 2-week, single-blind, placebo run-in period. Other patients (N=522) entered a metformin dose titration and dose stabilization/antihyperglycemic agent washout period, immediately followed by the 2-week run-in period. Following the run-in period, patients with inadequate glycemic control were randomized to the addition of canagliflozin 100 mg, canagliflozin 300 mg, or glimepiride (titration allowed throughout the 52-week study to 6 to 8 mg), administered once daily.
As shown in Table 15 and Figure 4, after 52 weeks, treatment with canagliflozin 100 mg provided similar reductions in A1C from baseline compared to glimepiride (with the upper bound of the 95% confidence interval around the between-group difference less than the pre-specified non-inferiority margin of 0.3%); canagliflozin 300 mg provided a superior (p<0.05) reduction from baseline in A1C compared to glimepiride (with the upper bound of the 95% confidence interval below 0). Statistically significant (p<0.001) reductions in body weight were observed with canagliflozin compared to glimepiride. Reductions in systolic blood pressure were observed with canagliflozin 100 mg and 300 mg relative to glimepiride of -3.5 mmHg and -4.8 mmHg, respectively. The incidence of hypoglycemia with canagliflozin was significantly lower (p<0.001) compared to glimepiride.
| Table 15: Results from 52-Week Clinical Study Comparing Canagliflozin to Glimepiride as Add-on Therapy with Metformin1 | ||||||||||||
| Efficacy Parameter | Canagliflozin + Metformin 52 Weeks | Glimepiride (titrated) + Metformin (N=482) | ||||||||||
100 mg (N=483) | 300 mg (N=485) | |||||||||||
| A1C (%) | ||||||||||||
| Baseline (mean) | 7.78 | 7.79 | 7.83 | |||||||||
| Change from baseline (adjusted mean) | -0.82 | -0.93 | -0.81 | |||||||||
| Difference from glimepiride (adjusted mean) (95% CI) | -0.012 (-0.11; 0.09) | -0.122 (-0.22; -0.02) | N/A3 | |||||||||
| Percent of patients achieving A1C < 7% | 53.6 | 60.1 | 55.8 | |||||||||
| Fasting Plasma Glucose (mmol/L) | ||||||||||||
| Baseline (mean) | 9.18 | 9.09 | 9.20 | |||||||||
| Change from baseline (adjusted mean) | -1.35 | -1.52 | -1.02 | |||||||||
| Difference from glimepiride (adjusted mean) (95% CI) | -0.33 (-0.56; -0.11) | -0.51 (-0.73; -0.28) | N/A3 | |||||||||
| Body Weight | ||||||||||||
| Baseline (mean) in kg | 86.8 | 86.6 | 86.6 | |||||||||
| % change from baseline (adjusted mean) | -4.2 | -4.7 | 1.0 | |||||||||
| Difference from glimepiride (adjusted mean) (95% CI) | -5.24 (-5.7; -4.7) | -5.74 (-6.2; -5.1) | N/A3 | |||||||||
1 Intent-to-treat population using last observation in study prior to glycemic rescue therapy 2 Met pre-specified criteria for non-inferiority to glimepiride (with the upper bound of the 95% CI around the between-group difference less than the pre-specified non-inferiority margin of < 0.3%). In a pre-specified assessment, the upper bound of the 95% CI for canagliflozin 300 mg, but not for canagliflozin 100 mg was < 0, indicating a superior (p<0.05) reduction in A1C relative to glimepiride with canagliflozin 300 mg. 3 N/A = Not applicable 4 p<0.001 5 Includes only patients who had both baseline and post-baseline values | ||||||||||||
Figure 4: Mean Changes from Baseline for A1C (%) and Body Weight Over 52 Weeks in a Study Comparing Canagliflozin to Glimepiride as Add-on Therapy with Metformin
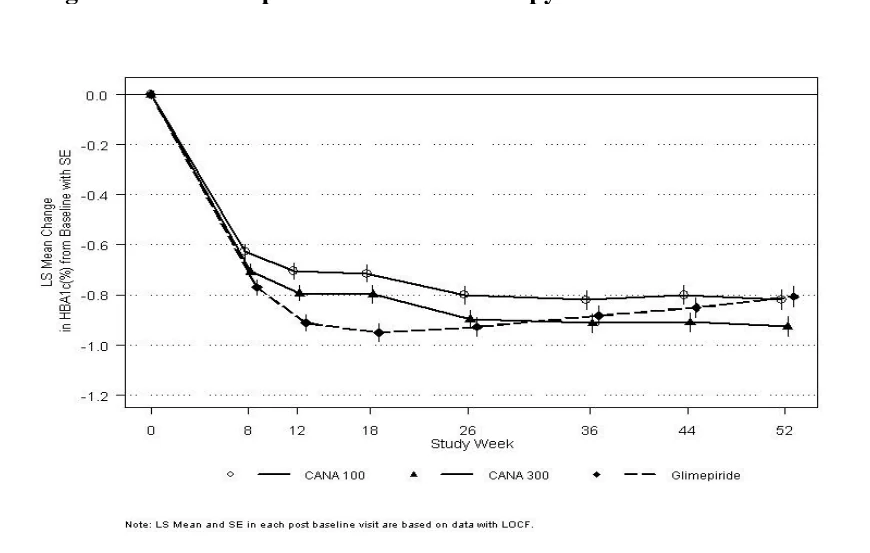
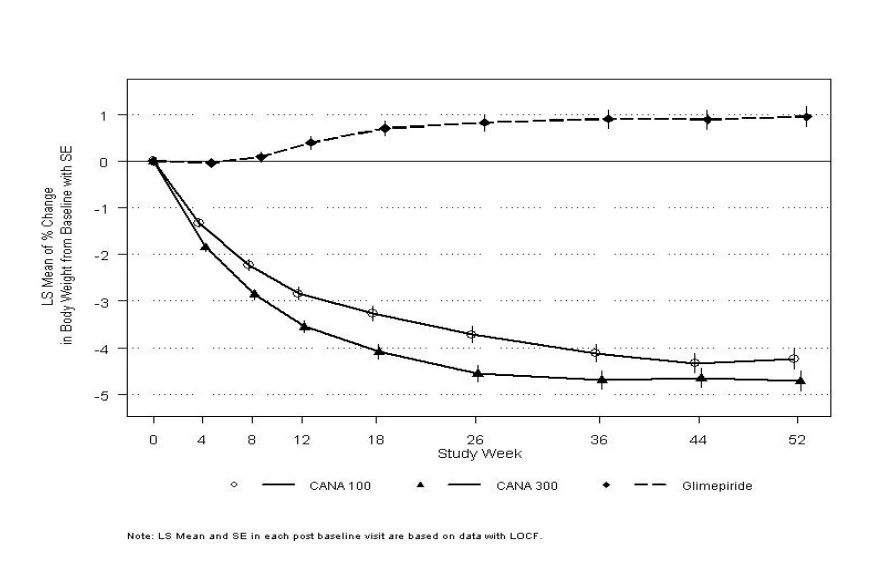
Add-on Therapy with Metformin and Sulfonylurea (Study DIA3002)
A total of 469 patients with inadequate glycemic control (A1C level of ≥ 7% to ≤ 10.5%) on the combination of metformin (2,000 mg/day or at least 1,500 mg/day if higher dose not tolerated) and sulfonylurea (maximal or near-maximal effective dose) participated in a randomized, double-blind, placebo-controlled, parallel-group, 3-arm, multicentre clinical study to evaluate the efficacy of canagliflozin as add-on therapy with metformin and sulfonylurea over 26 weeks. The mean age was 57 years, 51% of patients were men, and the mean baseline eGFR was 89 mL/min/1.73 m2. Patients on near-maximal or maximal effective doses of metformin and sulfonylurea (N=372) entered a 2-week, single-blind, placebo run-in period. Other patients (N=97) entered a metformin and sulfonylurea dose titration and dose stabilization/antihyperglycemic agent washout period of up to 12 weeks, immediately followed by the 2-week run-in period. Following the run-in period, patients with inadequate glycemic control were randomized to the addition of canagliflozin 100 mg, canagliflozin 300 mg, or placebo administered once daily.
As shown in Table 16, statistically significant (p<0.001) reductions in A1C, FPG, and body weight relative to placebo were observed. In addition, a greater percentage of patients achieved an A1C < 7.0% compared to placebo. Reductions in systolic blood pressure were observed with canagliflozin 100 mg and 300 mg relative to placebo of -2.2 mmHg and -1.6 mmHg, respectively. An increased incidence of hypoglycemia was observed in this study (see WARNINGS AND PRECAUTIONS and ADVERSE REACTIONS).
| Table 16: Results from 26-Week Placebo-Controlled Clinical Study of Canagliflozin as Add-on Therapy with Metformin and Sulfonylurea1 | |||||||||||
|---|---|---|---|---|---|---|---|---|---|---|---|
| Efficacy Parameter | Canagliflozin + Metformin and Sulfonylurea 26 Weeks | Placebo + Metformin and Sulfonylurea (N=156) | |||||||||
100 mg (N=157) | 300 mg (N=156) | ||||||||||
| A1C (%) | |||||||||||
| Baseline (mean) | 8.13 | 8.13 | 8.12 | ||||||||
| Change from baseline (adjusted mean) | -0.85 | -1.06 | -0.13 | ||||||||
| Difference from placebo (adjusted mean) (95% CI) | -0.712 (-0.90; -0.52) | -0.922 (-1.11; -0.73) | N/A3 | ||||||||
| Percent of patients achieving A1C < 7% | 43.22 | 56.62 | 18.0 | ||||||||
| Fasting Plasma Glucose (mmol/L) | |||||||||||
| Baseline (mean) | 9.60 | 9.34 | 9.42 | ||||||||
| Change from baseline (adjusted mean) | -1.01 | -1.69 | 0.23 | ||||||||
| Difference from placebo (adjusted mean) (95% CI) | -1.242 (-1.75; -0.73) | -1.922 (-2.43; -1.41) | N/A3 | ||||||||
| Body Weight | |||||||||||
| Baseline (mean) in kg | 93.5 | 93.5 | 90.8 | ||||||||
| % change from baseline (adjusted mean) | -2.1 | -2.6 | -0.7 | ||||||||
| Difference from placebo (adjusted mean) (95% CI) | -1.42 (-2.1; -0.7) | -2.02 (-2.7; -1.3) | N/A3 | ||||||||
1 Intent-to-treat population using last observation in study prior to glycemic rescue therapy 2 p<0.001 compared to placebo 3 N/A = Not applicable or not measured in this study | |||||||||||
Active-Controlled Study versus Sitagliptin as Add-on Therapy with Metformin and Sulfonylurea (Study DIA3015)
A total of 755 patients with inadequate glycemic control (A1C level of ≥ 7.0% to ≤ 10.5%) on the combination of metformin (2,000 mg/day or at least 1,500 mg/day if higher dose not tolerated) and sulfonylurea (near-maximal or maximal effective dose) participated in a double-blind, active-controlled, parallel-group, 2-arm, multicentre clinical study to evaluate the efficacy of canagliflozin 300 mg as add-on therapy with metformin and sulfonylurea versus sitagliptin 100 mg as add-on therapy with metformin and sulfonylurea over 52 weeks. The mean age was 57 years, 56% of patients were men, and the mean baseline eGFR was 88 mL/min/1.73 m2. Patients on near-maximal or maximal effective doses of metformin and sulfonylurea (N=716) entered a 2-week single-blind, placebo run-in period. Other patients (N=39) entered a metformin and sulfonylurea dose titration and dose stabilization period of up to 12 weeks, immediately followed by the 2-week run-in period. Following the run-in period, patients with inadequate glycemic control were randomized to the addition of canagliflozin 300 mg or sitagliptin 100 mg.
As shown in Table 17 and Figure 5 after 52 weeks, canagliflozin 300 mg provided a superior (p<0.05) reduction in A1C compared to sitagliptin 100 mg (with the upper bound of the 95% confidence interval around the between-group difference below 0). In addition, a greater percent of patients achieved an A1C of < 7.0% with canagliflozin 300 mg relative to sitagliptin: 47.6% of patients receiving canagliflozin 300 mg and 35.3% of patients receiving sitagliptin. Patients treated with canagliflozin 300 mg exhibited a significant mean decrease in percent change from baseline body weight compared to patients administered sitagliptin 100 mg. A statistically significant (p<0.001) reduction in systolic blood pressure was observed with canagliflozin 300 mg of -5.9 mmHg relative to sitagliptin. A similar increased incidence of hypoglycemia was observed with both canagliflozin 300 mg and sitagliptin in this study, consistent with the expected increase of hypoglycemia when agents not associated with hypoglycemia are added to sulfonylurea (see WARNINGS AND PRECAUTIONS and ADVERSE REACTIONS). The proportion of patients who met glycemic withdrawal criteria (based on FPG until Week 26 and A1C thereafter) was lower with canagliflozin 300 mg (10.6%) compared with sitagliptin 100 mg (22.5%).
| Table 17: Results from 52-Week Clinical Study Comparing Canagliflozin to Sitagliptin as Add-on Therapy with Metformin and Sulfonylurea1 | ||||||||
| Efficacy Parameter | Canagliflozin 300 mg + Metformin and Sulfonylurea (N=377) | Sitagliptin 100 mg + Metformin and Sulfonylurea (N=378) | ||||||
| A1C (%) | ||||||||
| Baseline (mean) | 8.12 | 8.13 | ||||||
| Change from baseline (adjusted mean) | -1.03 | -0.66 | ||||||
| Difference from sitagliptin (adjusted mean) (95% CI) | -0.372 (-0.50; -0.25) | N/A4 | ||||||
| Percent of patients achieving A1C < 7% | 47.6 | 35.3 | ||||||
| Fasting Plasma Glucose (mmol/L) | ||||||||
| Baseline (mean) | 9.42 | 9.09 | ||||||
| Change from baseline (adjusted mean) | -1.66 | -0.32 | ||||||
| Difference from sitagliptin (adjusted mean) (95% CI) | -1.34 (-1.66; -1.01) | N/A4 | ||||||
| Body Weight | ||||||||
| Baseline (mean) in kg | 87.6 | 89.6 | ||||||
| % change from baseline (adjusted mean) | -2.5 | 0.3 | ||||||
| Difference from sitagliptin (adjusted mean) (95% CI) | -2.83 (-3.3; -2.2) | N/A4 | ||||||
1 Intent-to-treat population using last observation in study prior to glycemic rescue therapy 2 Met pre-specified criteria for non-inferiority to sitagliptin (with the upper bound of the 95% CI around the between-group difference less than the pre-specified non-inferiority margin of < 0.3%); in a pre-specified assessment, the upper bound of the 95% CI for canagliflozin 300 mg was < 0, indicating a superior (p<0.05) reduction in A1C relative to sitagliptin with canagliflozin 300 mg. 3 p<0.001 4 N/A = Not applicable | ||||||||
Figure 5: Mean Change from Baseline for A1C (%) Over 52 Weeks in a Study Comparing Canagliflozin to Sitagliptin as Add-on Therapy with Metformin and Sulfonylurea
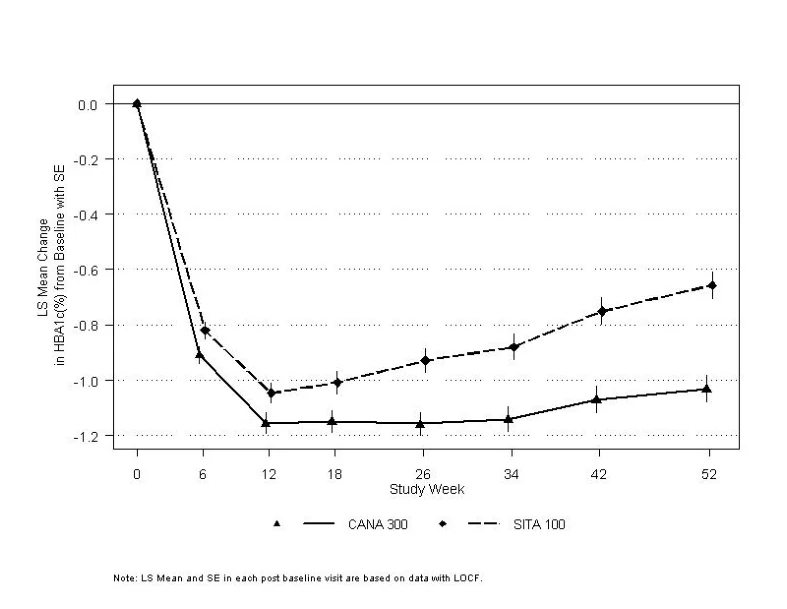
Add-on Therapy with Metformin and Pioglitazone (Study DIA3012)
A total of 342 patients with inadequate glycemic control (A1C level of ≥ 7.0% to ≤ 10.5%) on the combination of metformin (2,000 mg/day or at least 1,500 mg/day if higher dose not tolerated) and pioglitazone (30 or 45 mg/day) participated in a randomized, double-blind, placebo-controlled, parallel-group, 3-arm, multicentre clinical study to evaluate the efficacy of canagliflozin as add-on therapy with metformin and pioglitazone over 26 weeks. The mean age was 57 years, 63% of patients were men, and the mean baseline eGFR was 86 mL/min/1.73 m2. Patients already on protocol-specified doses of metformin and pioglitazone (N=163) entered a 2-week, single-blind, placebo run-in period. Other patients (N=181) entered a metformin and pioglitazone dose titration and dose stabilization period for up to 12 weeks with at least 8 weeks on stable doses of metformin and pioglitazone, immediately followed by the 2-week run-in period. Following the run-in period, patients with inadequate glycemic control were randomized (N=344) to the addition of canagliflozin 100 mg, canagliflozin 300 mg, or placebo, administered once daily.
As shown in Table 18, statistically significant (p<0.001) reductions in A1C, baseline FPG, and body weight relative to placebo were observed for canagliflozin at Week 26. In addition, a greater percent of patients achieved an A1C of < 7.0% compared to placebo. Statistically significant reductions in systolic blood pressure were observed with canagliflozin 100 mg and 300 mg relative to placebo of -4.1 mmHg (p=0.005) and -3.5 mmHg (p=0.016), respectively.
| Table 18: Results from 26-Week Placebo-Controlled Clinical Study of Canagliflozin as Add-on Therapy with Metformin and Pioglitazone1 | ||||||||||||
|---|---|---|---|---|---|---|---|---|---|---|---|---|
| Efficacy Parameter | Canagliflozin + Metformin and Pioglitazone 26 Weeks | Placebo + Metformin and Pioglitazone (N=115) | ||||||||||
100 mg (N=113) | 300 mg (N=114) | |||||||||||
| A1C (%) | ||||||||||||
| Baseline (mean) | 7.99 | 7.84 | 8.00 | |||||||||
| Change from baseline (adjusted mean) | -0.89 | -1.03 | -0.26 | |||||||||
| Difference from placebo (adjusted mean) (95% CI) | -0.622 (-0.81; -0.44) | -0.762 (-0.95; -0.58) | N/A3 | |||||||||
| Percent of patients achieving A1C < 7% | 46.92 | 64.32 | 32.5 | |||||||||
| Fasting Plasma Glucose (mmol/L) | ||||||||||||
| Baseline (mean) | 9.38 | 9.11 | 9.13 | |||||||||
| Change from baseline (adjusted mean) | -1.49 | -1.84 | 0.14 | |||||||||
| Difference from placebo (adjusted mean) (95% CI) | -1.632 (-2.05; -1.21) | -1.982 (-2.41; -1.56) | N/A3 | |||||||||
| Body Weight | ||||||||||||
| Baseline (mean) in kg | 94.2 | 94.4 | 94 | |||||||||
| % change from baseline (adjusted mean) | -2.8 | -3.8 | -0.1 | |||||||||
| Difference from placebo (adjusted mean) (95% CI) | -2.72 (-3.6; -1.8) | -3.72 (-4.6; -2.8) | N/A3 | |||||||||
1 Intent-to-treat population using last observation in study prior to glycemic rescue therapy 2 p<0.001 compared to placebo 3 N/A = Not applicable or not measured in this study | ||||||||||||
Add-on Therapy with Insulin and Metformin (Derived from DIA3008 substudy)
A total of 1718 patients with inadequate glycemic control (A1C level of ≥ 7.0 to ≤ 10.5%) on insulin ≥ 30 units/day or insulin add-on therapy with other antihyperglycemic agents participated in a randomized, double-blind, placebo-controlled, parallel-group, 3-arm, multicentre substudy of a cardiovascular outcomes study; this substudy evaluated the efficacy of canagliflozin as add-on therapy with insulin over 18 weeks. The mean age was 63 years, 66% of patients were men, and the mean baseline eGFR was 75 mL/min/1.73 m2. Patients on basal, bolus, or basal/bolus insulin, with the majority on a background basal/bolus insulin regimen, for at least 10 weeks entered a 2-week, single-blind, placebo run-in period. After the run-in period, patients with inadequate glycemic control were randomized to the addition of canagliflozin 100 mg, canagliflozin 300 mg, or placebo, administered once daily. The mean daily insulin dose at baseline was 83 units, which was similar across treatment groups.
A subgroup of 731 patients with inadequate glycemic control received canagliflozin in combination with metformin and ≥ 30 units/day of insulin over 18 weeks. As shown in Table 19, statistically significant (p<0.001) reductions in A1C, FPG, and body weight relative to placebo were observed for canagliflozin at Week 18 in patients on an insulin+metformin background. In addition, a greater percentage of patients achieved an A1C < 7.0% compared to placebo. Reductions in systolic blood pressure were observed with canagliflozin 100 mg and 300 mg relative to placebo of -2.9 mmHg (p=0.011) and -4.8 mmHg (p<0.001), respectively. An increased incidence of hypoglycemia was observed in this study (see WARNINGS AND PRECAUTIONS, ADVERSE REACTIONS, and DOSAGE AND ADMINISTRATION).
| Table 19: Results from 18-Week Placebo-Controlled Clinical Study of Canagliflozin as Add-on Therapy with Insulin ≥ 30 Units/Day (With Insulin and Metformin)1 | |||||||||||||
|---|---|---|---|---|---|---|---|---|---|---|---|---|---|
| Efficacy Parameter | Canagliflozin + Insulin + Metformin 18 Weeks | Placebo + Insulin + Metformin (N=244) | |||||||||||
100 mg (N=241) | 300 mg (N=246) | ||||||||||||
| A1C (%) | |||||||||||||
| Baseline (mean) | 8.28 | 8.21 | 8.21 | ||||||||||
| Change from baseline (adjusted mean) | -0.66 | -0.77 | 0.01 | ||||||||||
| Difference from placebo (adjusted mean) (95% CI) | -0.672 (-0.79; -0.55) | -0.782 (-0.90; -0.66) | N/A3 | ||||||||||
| Percent of patients achieving A1C < 7% | 19.62 | 26.72 | 7.1 | ||||||||||
| Fasting Plasma Glucose (mmol/L) | |||||||||||||
| Baseline | 9.38 | 9.35 | 9.34 | ||||||||||
| Change from baseline (adjusted mean) | -1.06 | -1.48 | 0.09 | ||||||||||
| Difference from placebo (adjusted mean) (95% CI) | -1.152 (-1.56; -0.73) | -1.572 (-1.98;-1.16) | N/A3 | ||||||||||
| Body Weight | |||||||||||||
| Baseline (mean) in kg | 97.4 | 98.4 | 99.9 | ||||||||||
| % change from baseline (adjusted mean) | -1.9 | -2.7 | 0.0 | ||||||||||
| Difference from placebo (adjusted mean) (95% CI) | -1.92 (-2.4; -1.5) | -2.72 (-3.2; -2.3) | N/A3 | ||||||||||
1 Intent-to-treat population using last observation in study prior to glycemic rescue therapy 2 p < 0.001 compared to placebo 3 N/A = Not applicable | |||||||||||||
Cardiovascular Outcomes (CANVAS (DIA3008) and CANVAS-R (DIA4003))
The effect of canagliflozin on cardiovascular risk in adults with type 2 diabetes who had established cardiovascular (CV) disease or were at risk for CVD (two or more CV risk factors), was evaluated in the CANVAS Program (CANVAS and CANVAS-R studies). These studies were multicenter, multi-national, randomized, double-blind, placebo-controlled parallel group, time- and event-driven, with similar inclusion and exclusion criteria and patient populations. The studies compared the risk of experiencing a Major Adverse Cardiovascular Event (MACE) defined as the composite of cardiovascular death, nonfatal myocardial infarction and nonfatal stroke, between canagliflozin and placebo on a background of standard of care treatments for diabetes and atherosclerotic cardiovascular disease. Additional pre-specified, adjudicated endpoints included CV death, fatal/non-fatal myocardial infarction, fatal/non-fatal stroke, hospitalization for heart failure, and all-cause mortality.
In CANVAS, subjects were randomly assigned 1:1:1 to canagliflozin 100 mg, canagliflozin 300 mg, or matching placebo. In CANVAS-R, subjects were randomly assigned 1:1 to canagliflozin 100 mg or matching placebo, and titration to 300 mg was permitted at the investigator’s discretion (based on tolerability and glycemic needs) at Week 13 or later visits. Concomitant antidiabetic and atherosclerotic therapies could be adjusted, at the discretion of investigators, to ensure participants were treated according to the standard care for these diseases.
A total of 10,134 patients were treated (4,327 in CANVAS and 5,807 in CANVAS-R; total of 4,344 randomly assigned to placebo and 5,790 to canagliflozin). For the integrated CANVAS trials, the mean duration of treatment was 149.2 weeks (mean of 222.8 weeks for CANVAS and 94.4 weeks for CANVAS-R) and the mean duration of study follow-up was 188.2 weeks (mean of 295.9 for CANVAS and 108.0 weeks for CANVAS-R). Vital status was obtained for 99.6% of the subjects. The proportion of subjects who completed the study was 96.0%. Approximately 78% of the study population was Caucasian, 13% was Asian, and 3% was Black. The mean age was 63 years and approximately 64% were male. All patients in the study had inadequately controlled type 2 diabetes mellitus at baseline (HbA1c ≥7.0% to ≤10.5%). The mean HbA1c at baseline was 8.2% and mean duration of diabetes was 13.5 years. Baseline renal function was normal or mildly impaired in 80% of patients and moderately impaired in 20% of patients (mean eGFR 77 mL/min/1.73 m2). There were 526 patients with eGFR 30-<45 mL/min/1.73 m2, 1485 patients with eGFR 45-<60 mL/min/1.73 m2, and 5625 with eGFR 60-<90 mL/min/1.73 m2. At baseline, 99% of patients were treated with one or more antidiabetic medications including metformin (77%), insulin (50%), and sulfonylurea (43%).
Sixty-six percent of subjects had a history of established cardiovascular disease, with 56% having a history of coronary disease, 19% with cerebrovascular disease, and 21% with peripheral vascular disease; 14% had a history of heart failure. At baseline, the mean systolic blood pressure was 137 mmHg, the mean diastolic blood pressure was 78 mmHg, the mean LDL was 2.29 mmol/L, the mean HDL was 1.2 mmol/L, and the mean urinary albumin to creatinine ratio (UACR) was 115 mg/g. At baseline, approximately 80% of patients were treated with renin angiotensin system inhibitors, 54% with beta-blockers, 13% with loop diuretics, 36% with non-loop diuretics, 75% with statins, and 74% with antiplatelet agents (including aspirin).
The primary endpoint in the CANVAS Program was the time to first occurrence of a composite MACE endpoint of cardiovascular death, nonfatal myocardial infarction, or nonfatal stroke, considering all events up to individual trial completion. The MACE hazard ratio (HR) in patients treated with canagliflozin compared with placebo and its 95% CI was estimated using a stratified Cox proportional hazards regression model with stratification by study and by established cardiovascular disease (HR: 0.86; 95% CI 0.75, 0.97, p<0.0001 for non-inferiority; p=0.0158 for superiority). According to the primary hypothesis, the integrated canagliflozin treatment (CANVAS and CANVAS-R) was found to be non-inferior to placebo, since the upper bound of the 95% CI was below 1.3 and superior to placebo, since the upper bound of the 95% CI was also below 1.0. Each of the components of the MACE composite endpoint showed a similar reduction when assessed as independent endpoints (see Figure 5). Results for the 100 mg and 300 mg canagliflozin doses were consistent with results for the combined dose groups. The reduction in MACE was accounted for by the subgroup of patients with established cardiovascular disease (HR 0.82; 95% CI 0.72, 0.95) (see Figure 5), whilst the subgroup of patients with only risk factors for cardiovascular disease at baseline had a hazard ratio whose 95% confidence interval included one (HR 0.98; 95% CI 0.74, 1.30).
Figure 6: Treatment Effect for the Primary Composite Endpoint and its Components
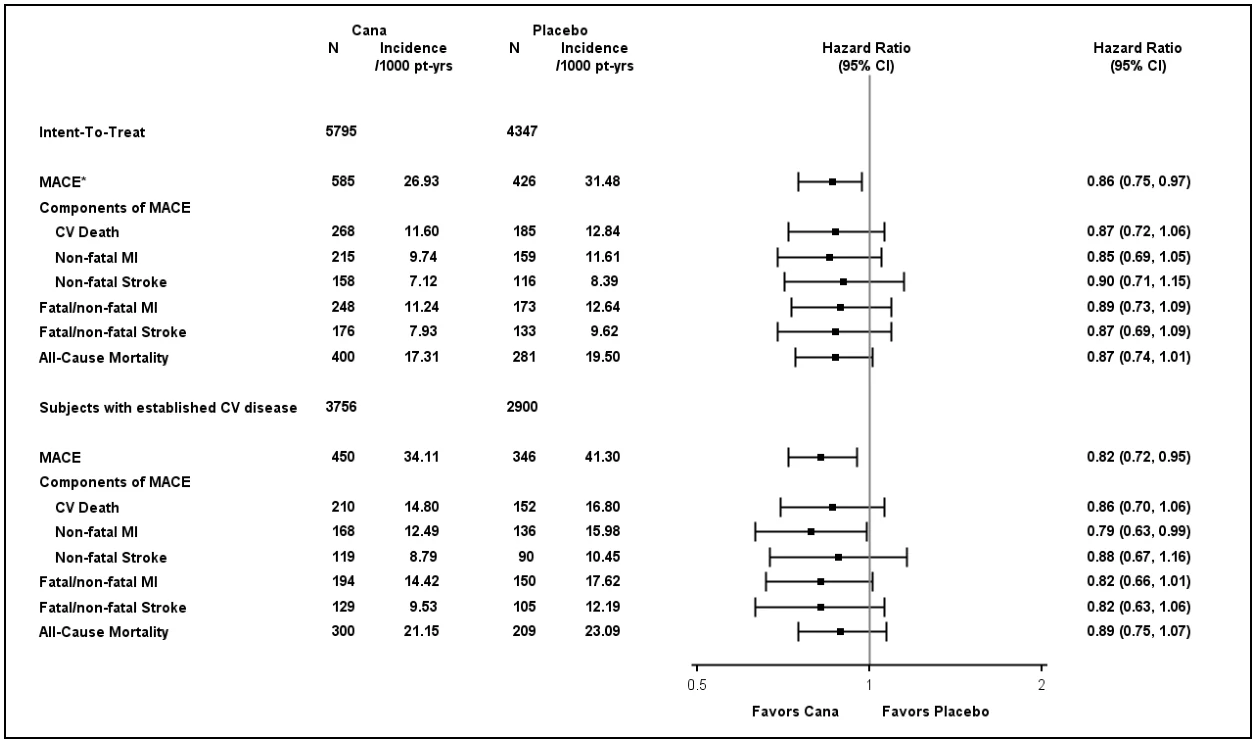
- 1 P value for superiority (2-sided) = 0.0158.
Based on the Kaplan-Meier plot for the first occurrence of MACE, shown below, the reduction in MACE in the canagliflozin group was observed as early as Week 26 and was maintained throughout the remainder of the study (Figure 6 and 7).
Figure 7: Time to First Occurrence of MACE (CANVAS Integrated)
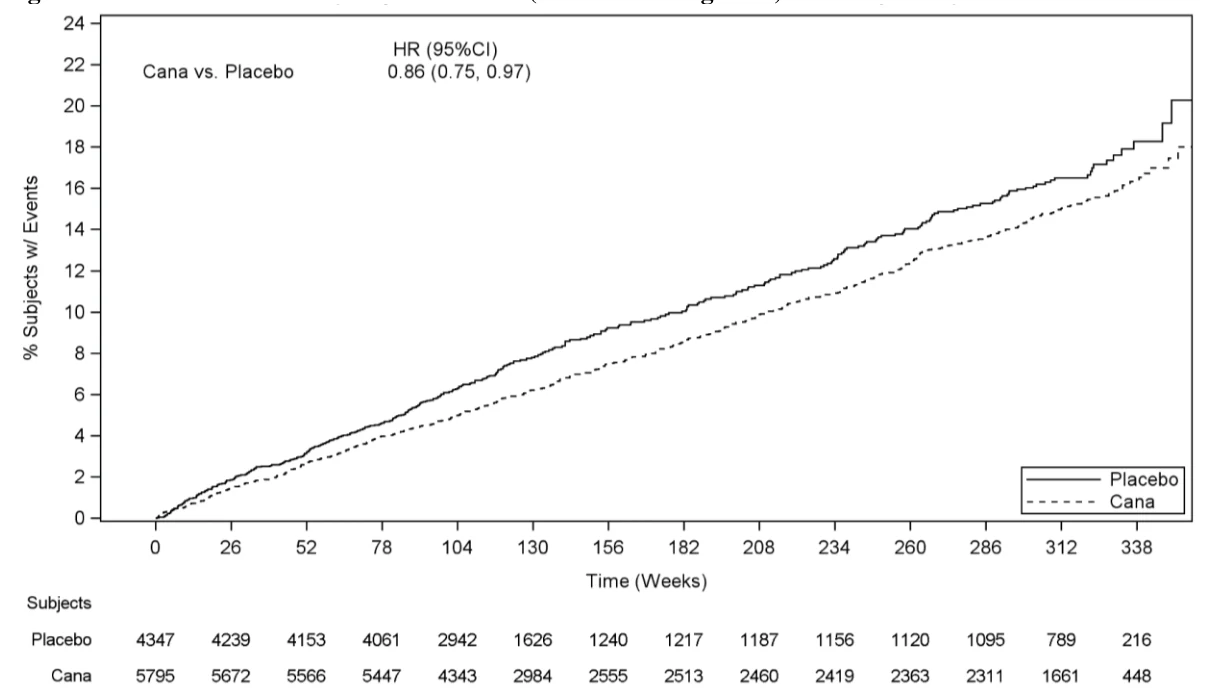
Figure 8: Time to First Occurrence of MACE (Subjects with Established CV Disease)
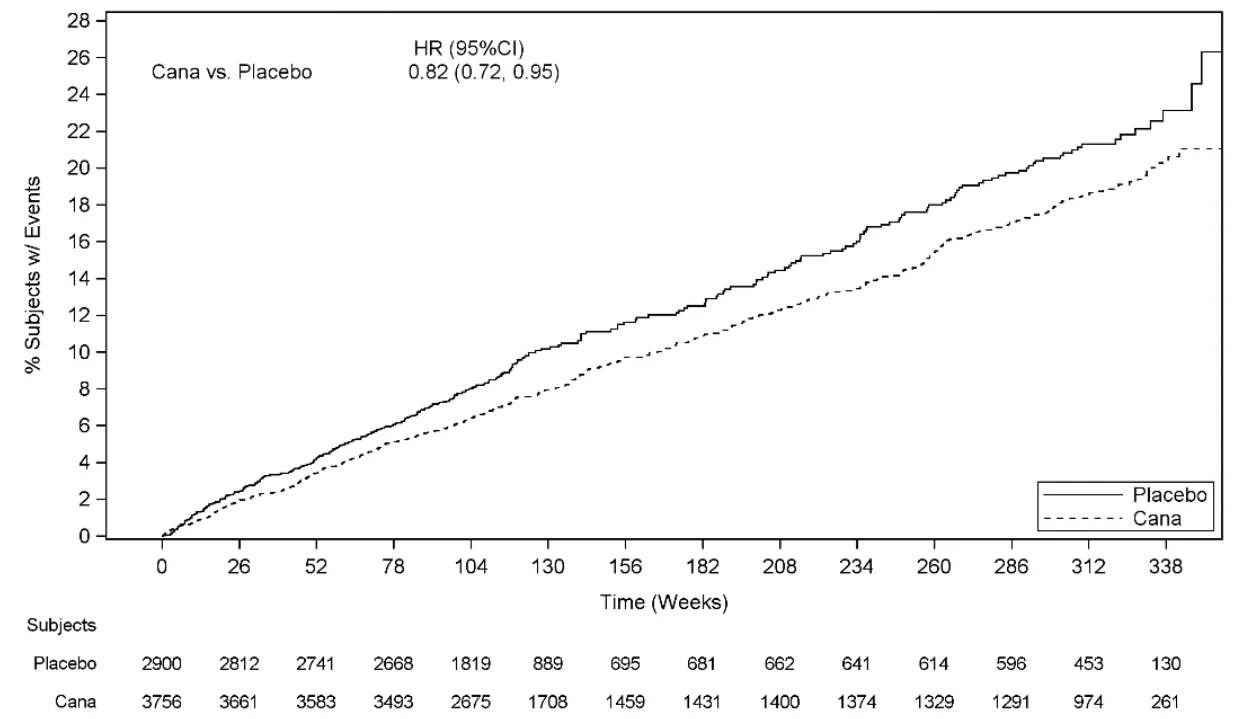
In the CANVAS program, subjects treated with canagliflozin had a lower risk of hospitalization for heart failure compared to those treated with placebo.
| Table 20: Treatment Effect for Hospitalized Heart Failure and the Composite of Cardiovascular Death or Hospitalized Heart Failure | |||
Placebo N=4347 Event rate per 100 patient-years | Canagliflozin N=5795 Event rate per 100 patient-years | Hazard ratio vs. Placebo (95% CI) | |
| Hospitalized heart failure (time to first occurrence; intent-to-treat analysis set) | 0.87 | 0.55 | 0.67 (0.52, 0.87)1 |
| Death or Hospitalization due to heart failure (time to first occurrence; intent-to-treat analysis set) | 0.97 | 0.64 | 0.70 (0.55, 0.89) |
| 1 p=0.0021; nominal value | |||
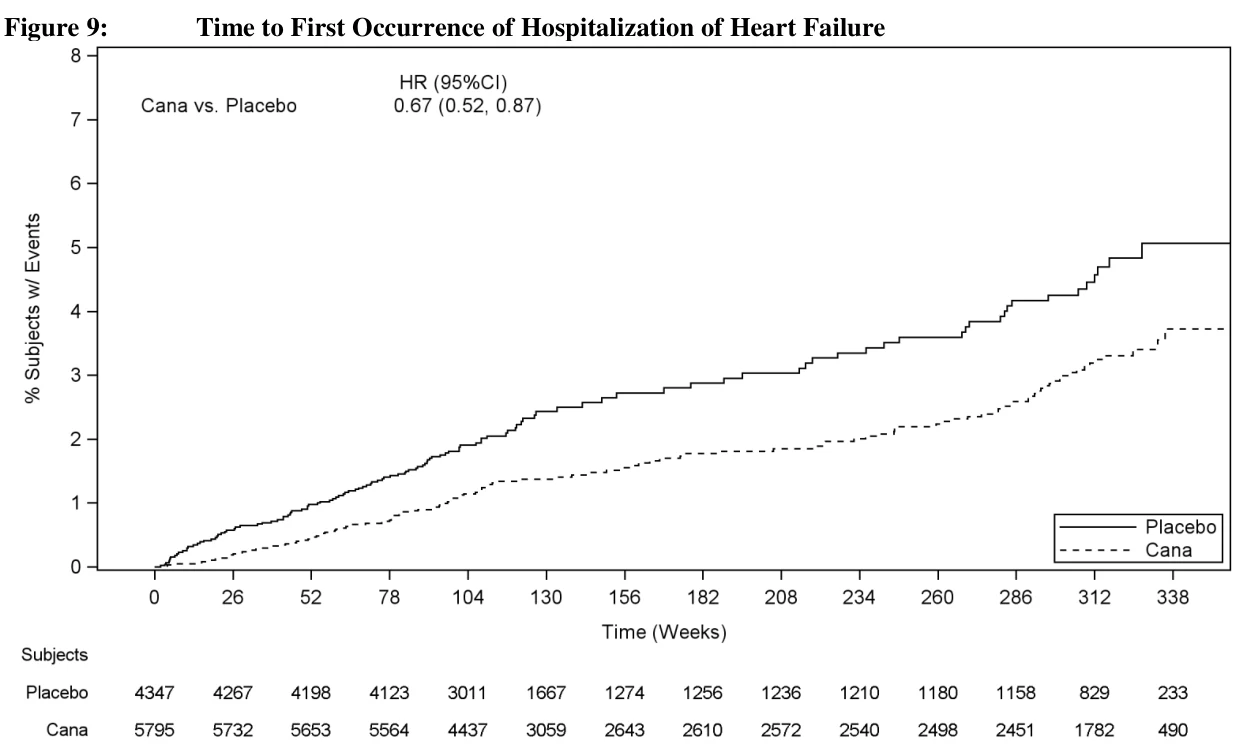
Figure 9: Time to First Occurrence of Hospitalization of Heart Failure
Renal and Cardiovascular Outcomes in Patients with Type 2 Diabetes Mellitus and Diabetic Nephropathy (CREDENCE DNE3001)
The Canagliflozin and Renal Events in Diabetes with Established Nephropathy Clinical Evaluation Trial (CREDENCE) studied the effect of canagliflozin 100 mg relative to placebo on progression to end-stage kidney disease (ESKD), doubling of serum creatinine, and renal or cardiovascular (CV) death in adults with type 2 diabetes and diabetic nephropathy with (eGFR) ≥ 30 to < 90 mL/min/1.73m2 and albuminuria (˃ 33.9 to ≤ 565.6 mg/mmol of creatinine), who were receiving standard of care including maximally tolerated labelled dose of an angiotensin-converting enzyme inhibitor (ACEi) or angiotensin receptor blocker (ARB). This study was a multicenter, randomized, double-blind, event-driven, placebo-controlled, parallel-group, 2-arm study.
In CREDENCE, subjects were randomly assigned 1:1 to canagliflozin 100mg or placebo, stratified by screening estimated glomerular filtration rate (eGFR) ≥30 to <45, ≥45 to <60, ≥60 to <90mL/min/1.73 m2. Treatment with canagliflozin 100 mg was continued in patients until the initiation of dialysis or renal transplantation.
A total of 4,401subjects were randomized (2,199 randomly assigned to placebo and 2,202 to canagliflozin 100mg), followed for a mean duration of 136 weeks, and included in the intent-to-treat analysis set. Four of the randomized subjects were not dosed, leading to 4,397 subjects (exposed for a mean duration of 115 weeks) in the on-treatment analysis set. Vital status was obtained for 99.9% of subjects across the study. The majority (67%) of the study population identified as White, 20% as Asian, and 5% as Black; 32% of all subjects were of Hispanic or Latino ethnicity. The mean age was 63 years and approximately 66% were male.
The mean baseline HbA1c was 8.3%, with 53.2% of subjects having baseline HbA1c ≥8%, and the baseline median urine albumin/creatinine was 104.75 mg/mmol. The most frequent antihyperglycemic agents (AHA) medications used at baseline were insulin (65.5%), biguanides (57.8%), and sulfonylureas (28.8%). Nearly all subjects (99.9%) were on ACEi or ARB at randomization. About 92% of the subjects were on cardiovascular therapies (not including ACEi/ARBs) at baseline, with approximately 60% taking an anti-thrombotic agent (including aspirin) and 69% on statins.
The mean baseline eGFR was 56.2 mL/min/1.73 m2 and approximately 60% of the population had a baseline eGFR of <60 mL/min/1.73 m2. Subjects had a mean duration of diabetes of approximately 16 years. The proportion of subjects with prior CV disease was 50.4%; 14.8% had a history of heart failure. While the entire study population had nephropathy at baseline, about 64% of the population had at least 2 microvascular complications (i.e. diabetic nephropathy and another microvascular complication). At baseline, 5.4% of subjects in the canagliflozin 100mg arm had a history of amputation and 5.2% of subjects in the placebo arm.
The primary composite endpoint in the CREDENCE study was the time to first occurrence of ESKD (defined as an eGFR <15mL/min/1.73 m2, initiation of chronic dialysis or renal transplant), doubling of serum creatinine, and renal or CV death. Canagliflozin 100 mg significantly reduced the risk of first occurrence of the primary composite endpoint of ESKD, doubling of serum creatinine, and renal or CV death [p<0.0001; HR:0.70; 95% CI:0.59, 0.82] (see Figure 10 and Figure 11). The treatment effect reflected a reduction in progression to ESKD, doubling of serum creatinine and cardiovascular death. There were few renal deaths during the trial. The efficacy of canagliflozin 100 mg on the primary endpoint composite was generally consistent across major demographic and disease subgroups, including a subgroup defined by the 3 screening eGFR strata.
Canagliflozin 100 mg significantly reduced the risk of the following secondary endpoints, as shown in Figure 10 below: Composite endpoint of CV Death and Hospitalized Heart Failure [HR:0.69; 95% CI: 0.57 to 0.83; p=0.0001], MACE (Major Adverse Cardiovascular Events) (comprised of non-fatal MI, non-fatal stroke and CV death) [HR:0.80; 95% CI:0.67 to 0.95;
p=0.0121], Hospitalized Heart Failure [HR:0.61; 95% CI:0.47to 0.80; p=0.0003], and Renal composite endpoint (comprised of ESKD, doubling of serum creatinine, and renal death) [HR:0.66; 95% CI:0.53 to 0.81; p<0.0001].
For both primary and secondary endpoints, the HR in subjects treated with canagliflozin 100 mg compared with placebo and its 95% CI were estimated using a stratified Cox proportional hazards regression model with treatment as the explanatory variable and stratified by screening eGFR (≥30 to <45, ≥45 to <60, ≥60 to <90mL/min/1.73 m2).
Figure 10: Treatment Effect for the Primary and Secondary Composite Endpoints and their Components
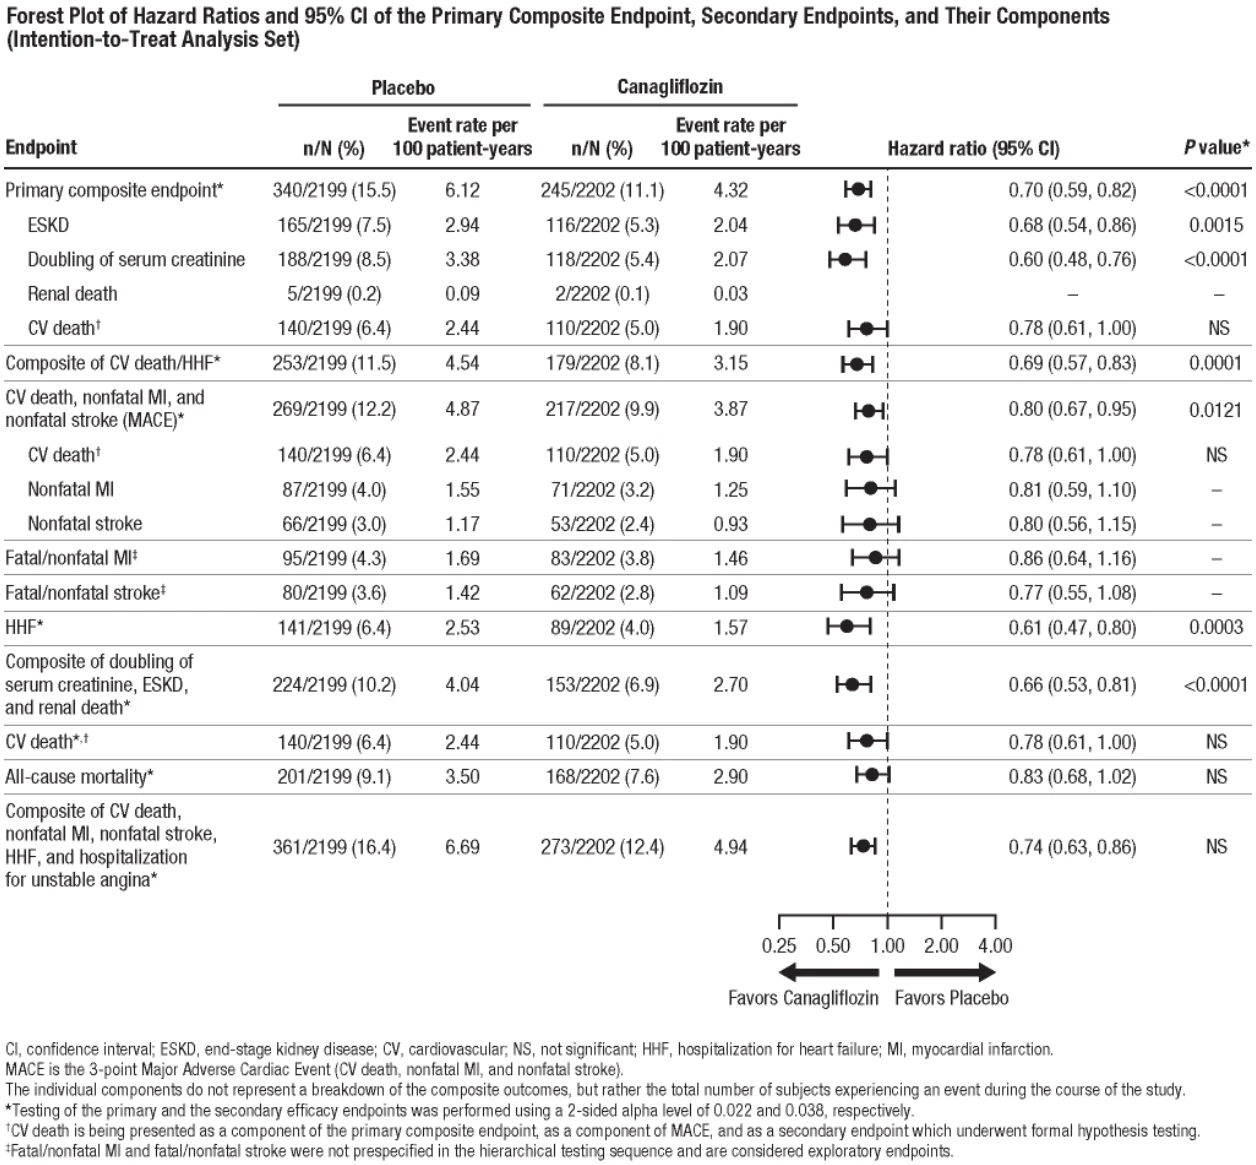
Based on the Kaplan-Meier plot for the time to first occurrence of the primary composite endpoint of ESKD, doubling of serum creatinine, renal death, and CV death shown below, the curves began to separate by Week 52 and continued to diverge thereafter (see Figure 11).
Figure 11: Time to First Occurrence of the Primary Composite Endpoint (ESKD, Doubling of Serum Creatinine, Renal Death, CV Death)
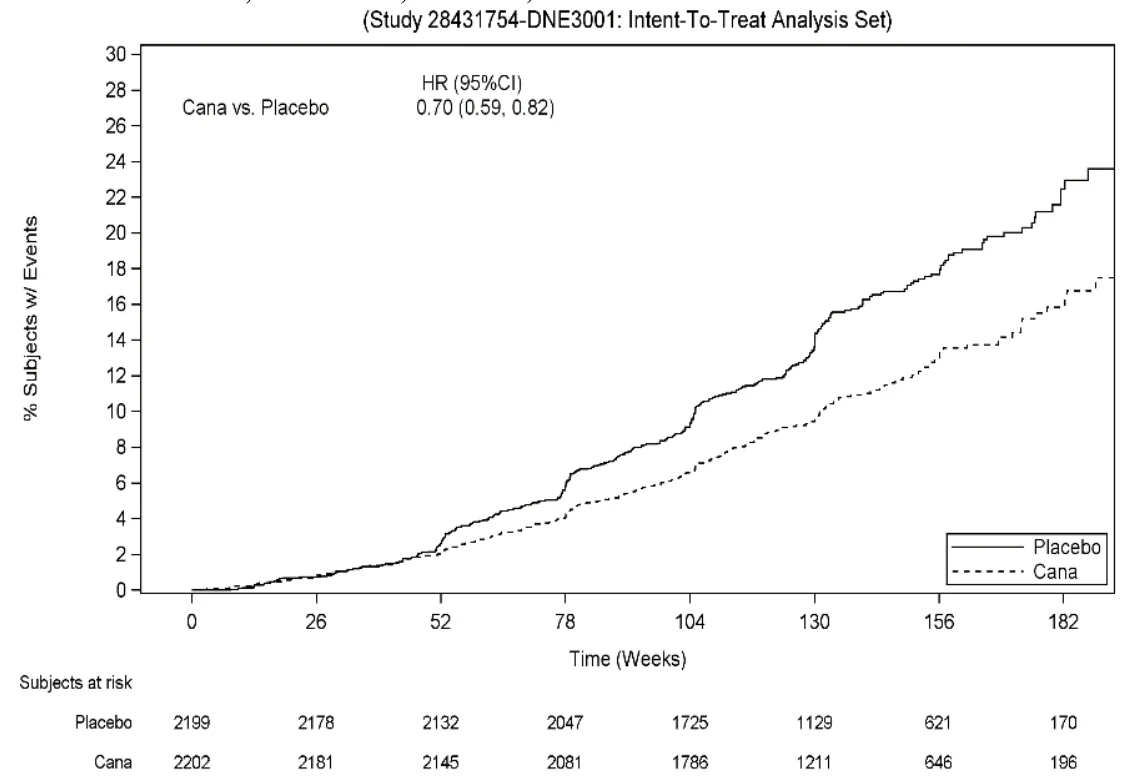
The Kaplan-Meier plot for the first occurrence of hospitalized heart failure over time is shown in Figure 12. Canagliflozin significantly reduced the risk of hospitalized heart failure as compared with placebo (HR: 0.61; 95% CI: 0.47, 0.80; p=0.0003). The Kaplan-Meier curves separated within the first 26 weeks of treatment and continued to diverge thereafter.
Figure 12: Time to First Occurrence of Hospitalized Heart Failure
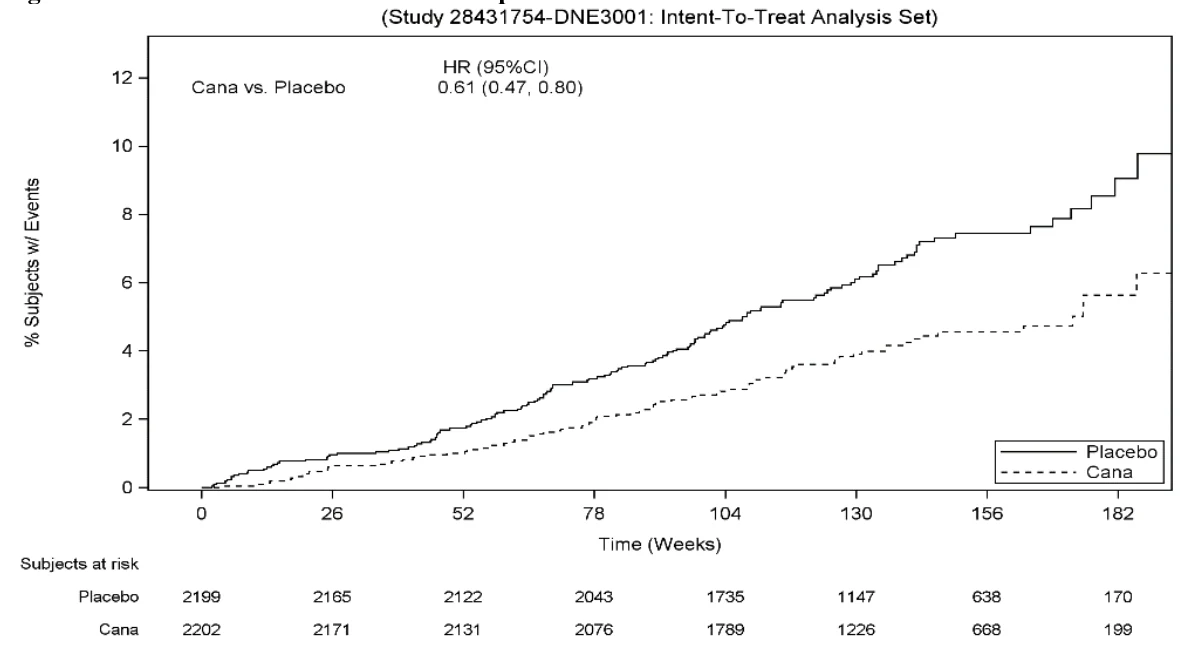
The Kaplan-Meier plot for the first occurrence of the secondary renal composite endpoint of doubling of serum creatinine, ESKD, and renal death over time is shown in Figure 13. Canagliflozin significantly reduced the risk of the secondary renal composite endpoint as compared with placebo (HR: 0.66; 95% CI: 0.53, 0.81; p<0.0001). The Kaplan-Meier curves separated within the first 52 weeks of treatment and continued to diverge thereafter.
Figure 13: Time to First Occurrence of Renal Composite Endpoint (Doubling of Serum Creatinine/ESKD/Renal Death)
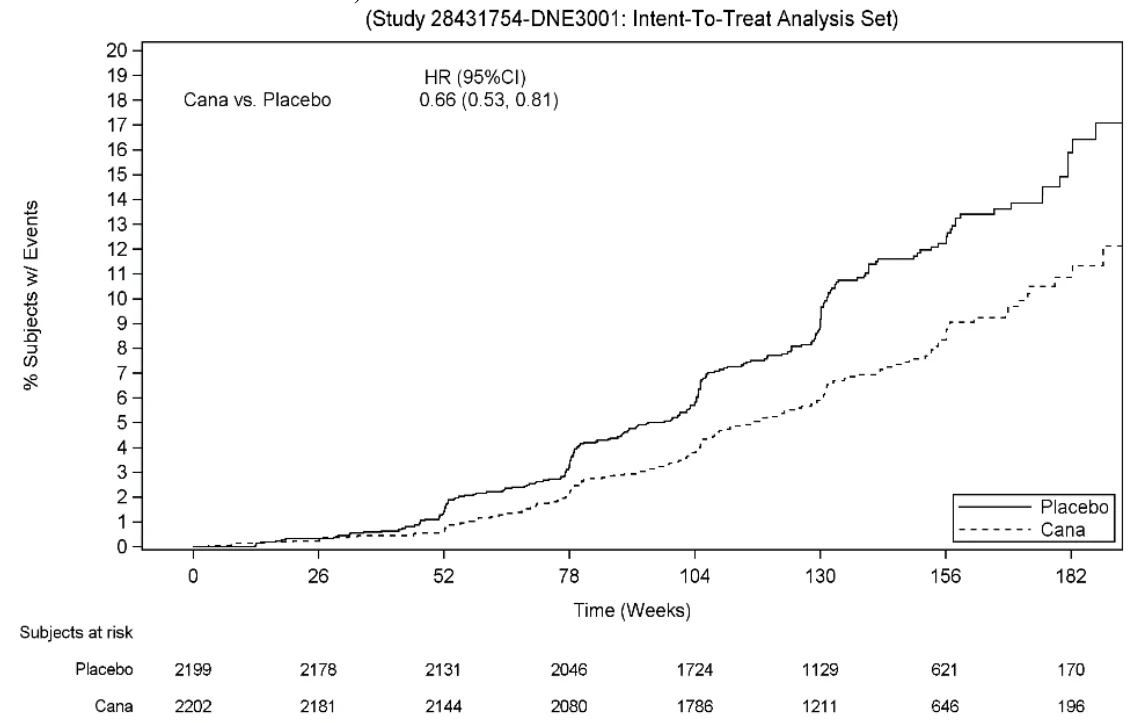
DETAILED PHARMACOLOGY
In Vitro Pharmacology Studies
Canagliflozin
In Chinese hamster ovary K1 (CHOK1) cells overexpressing either human SGLT1 (hSGLT1) or hSGLT2, canagliflozin was found to be a potent and selective inhibitor of SGLT2 with IC50 values of 4.2 nM and 663 nM against hSGLT2 and hSGLT1, respectively. Similar IC50 values of 3.7 nM and 555 nM were obtained for rat SGLT2 and SGLT1 expressed in CHOK1 cells, respectively.
In Vivo Pharmacology Studies
Canagliflozin
In diabetic mice, rats, and obese dogs, canagliflozin increased urinary glucose excretion (UGE) in a dose-related manner and also decreased plasma glucose. In the oral glucose tolerance test (OGTT), canagliflozin improved glucose tolerance in normal mice, Zucker diabetic Fatty (ZDF) rats, and obese dogs. Canagliflozin treatment (1 mg/kg single oral dose) markedly lowered the mean renal threshold of glucose (RTG) in ZDF rats from 415 to 140 mg/dL (~23 to 8 mmol/L). Repeated daily treatment for 4 weeks with canagliflozin dose-dependently lowered fed and fasted blood glucose levels, lowered A1C, and improved beta-cell function as reflected by a dose-dependent increase in plasma insulin levels in ZDF rats. In addition, repeated dosing of canagliflozin for up to 4 weeks in obese (ob/ob) and diet-induced obese mice reduced body weight and improved glucose handling during an OGTT.
Metformin hydrochloride
Metformin absorption is relatively slow and may extend over about 6 hours. Animal studies with metformin, labelled with 14C have shown that the drug is neither concentrated by liver cells nor is it excreted in the bile; it is concentrated in the intestinal mucosa and salivary glands.
It has been shown that, following a 2 g dose of metformin, the blood level remains under 10 mcg/mL even at the peak, occurring 2 hours after absorption. During the experiments, metformin was shown to be devoid of any notable action in the body, apart from its specific metabolic activity.
In the healthy animal, metformin lowers blood sugar only at a nearly lethal dose. Different animal species are of unequal sensitivity. On the other hand, the animal with experimental diabetes, is sensitive to a much lower dosage, providing some insulin is still secreted.
The antihyperglycemic action of metformin is probably mediated through insulin. Metformin improves the coefficient of glucose assimulation (K), and the coefficient of insulin efficiency.
In the obese diabetic with hyperinsulinemia, metformin is reported to normalize insulin output. This normalizing effect is concurrent to that of glycemia.
Metformin has little effect on liver glycogen of the healthy animal. In low and average doses, no change occurs. In high doses nearing lethal levels, liver glycogen decreases. This lowering precedes the fall in blood sugar. This reaction represents a defense mechanism tending to mobilize body reserves in order to combat hypoglycemia.
In the diabetic animal with a low liver glycogen reserve, the opposite occurs and metformin builds up glycogen stores of the liver. In vitro, on muscular tissue isolated in Warburg’s apparatus, metformin increases glucose uptake by the muscle. This action follows an aerobic pathway. Even in high concentration, contrary to phenethyl-biguanide, metformin apparently does not block respiration or change carbohydrate metabolism via the anaerobic pathway.
Metformin is eliminated in feces and urine. It is rapidly excreted by the kidneys in an unchanged form.
Renal clearance is 450 mL/minute; this appears to explain the absence of accumulation.
Metabolites of metformin have not been identified, neither by radio-active nor by chemical methods.
A single Rf spot is always present following radiochromatographic study of urine and always corresponds to that of pure metformin. Administration during 10 consecutive days has not shown any sign of accumulation.
Inhibition of glyconeogenesis has been observed in animals following its stimulation by fasting, cortisol, alcohol or other substrates such as alanine lactate or pyruvate. However, such an effect varies according to the type and dosage of the biguanide used, nutritional state of the animal species and design of experimental model.
This inhibition of glyconeogenesis is observed only in the presence of insulin and it does not appear to play an important role in man.
Inhibition of intestinal absorption of sugars, which is not related to a malabsorption phenomenon has been observed with biguanides under certain experimental conditions in animal and in man. In one study, a 20% retardation of galactose absorption was observed in man receiving metformin. However, such an effect of metformin could not be confirmed in another study in man.
Recent findings appear to indicate that most of the metabolic effects of the biguanides are exerted through a single mechanism, namely inhibition of fatty acid oxidation and of acetyl-CoA generation.
However, inhibition of insulin-stimulated lipogenesis which has also been observed appears to be due to the inhibition of acetyl-CoA carboxylase by the biguanides. Such an effect may explain, at least partly, the weight-reducing effect exerted by these drugs in obese diabetic patients.
TOXICOLOGY
Canagliflozin
Non-clinical data reveal no particular hazard for humans based on conventional studies of safety pharmacology, repeated dose toxicity, and genotoxicity. In a study in juvenile rats, dilatation of the renal pelvis and tubules was noticed beginning at the lowest dose tested, 4 mg/kg, an exposure greater than or equal to 0.5 times the maximum clinical dose of 300 mg, and the pelvic dilatation did not fully reverse within the approximately 1-month recovery period. Persistent renal findings in juvenile rats can most likely be attributed to reduced ability of the developing rat kidney to handle canagliflozin-increased urine volumes, as functional maturation of the rat kidney continues through 6 weeks of age.
Canagliflozin and Metformin Combination
No animal studies have been conducted with the combined products in INVOKAMET® to evaluate carcinogenesis, mutagenesis, or impairment of fertility.
Single and Repeat-Dose Toxicity
Canagliflozin
Canagliflozin has relatively low acute oral toxicity, with maximum non-lethal single doses of 2000 mg/kg in mice (both sexes) and male rats, and 1000 mg/kg in female rats.
Repeat-dose oral toxicity studies were conducted in mice, rats and dogs for up to 3, 6 and 12 months, respectively. Canagliflozin was generally well tolerated up to oral doses of 4 mg/kg/day in rats and 100 mg/kg/day in mice and dogs (up to approximately 0.5, 11, and 20 times the clinical dose of 300 mg based on AUC exposure for rats, mice and dogs, respectively). The major adverse effects, observed mainly in rats, were related to the pharmacologic mode of action of canagliflozin, and these included increased urinary glucose, increased urine volume, increased urinary excretion of electrolytes, decreased plasma glucose at high dose levels, and reduced body weight. The primary targets of toxicity were the kidney and bone. In the 3-month rat study, minimal mineralization of renal interstitium and/or pelvis were observed in some animals given doses of ≥ 4 mg/kg/day. In the 6-month rat study, renal tubular dilatation was seen at all doses (4, 20 and 100 mg/kg/day), and an increased incidence and severity of transitional epithelial hyperplasia in the renal pelvis was observed at 100 mg/kg/day. In dogs, treatment-related tubular regeneration/degeneration and tubular dilatation occurred only at the high dose of 200/100 mg/kg/day. Trabecular hyperostosis was observed in the repeat-dose studies in rats, but not in mice and dogs. In the 2-week rat study, canagliflozin at 150 mg/kg/day caused minimal to mild hyperostosis but in 3- and 6-month rat studies, hyperostosis was detected at 4 mg/kg/day, the lowest dose tested. A 1-month mechanistic rat study showed that hyperostosis occurred in young, actively growing animals (6 to 8 weeks old, as in the toxicity studies) but not in older (6 month old) animals where bone growth has substantially slowed.
Carcinogenicity
Canagliflozin
The carcinogenicity of canagliflozin was evaluated in 2-year studies in mice and rats at oral doses of 10, 30, or 100 mg/kg/day. Canagliflozin did not increase the incidence of tumors in male and female mice up to 100 mg/kg/day (up to 14 times the clinical dose of 300 mg based on AUC exposure).
The incidence of testicular Leydig cell tumors increased significantly in male rats at all doses tested (≥1.5 times the clinical dose of 300 mg based on AUC exposure). The Leydig cell tumors are associated with an increase in luteinizing hormone (LH), which is a known mechanism of Leydig cell tumor formation in rats. In a 12-week clinical study, unstimulated LH did not increase in males treated with canagliflozin.
The incidence of pheochromocytomas and renal tubular tumors increased significantly in male and female rats given high doses of 100 mg/kg/day (approximately 12 times the clinical dose of 300 mg based on AUC exposure). Canagliflozin-induced renal tubule tumors and pheochromocytomas in rats may be caused by carbohydrate malabsorption; mechanistic clinical studies have not demonstrated carbohydrate malabsorption in humans at canagliflozin doses of up to 2 times the recommended clinical dose of 300 mg.
Metformin
Long-term carcinogenicity studies have been performed in rats (dosing duration of 104 weeks) and mice (dosing duration of 91 weeks) at doses up to and including 900 mg/kg/day and 1500 mg/kg/day, respectively. These doses are both approximately 4 times the maximum recommended human daily dose of 2000 mg based on body surface area comparisons. No evidence of carcinogenicity with metformin was found in either male or female mice. Similarly, there was no tumorigenic potential observed with metformin in male rats. There was, however, an increased incidence of benign stromal uterine polyps in female rats treated with 900 mg/kg/day.
Mutagenicity
Canagliflozin
Canagliflozin was not mutagenic with or without metabolic activation in the Ames assay. Canagliflozin was mutagenic in the in vitro mouse lymphoma assay with but not without metabolic activation. Canagliflozin was not mutagenic or clastogenic in an in vivo oral micronucleus assay in rats and an in vivo oral Comet assay in rats.
Metformin
There was no evidence of a mutagenic potential of metformin in the following in vitro tests: Ames test (S. typhimurium), gene mutation test (mouse lymphoma cells), or chromosomal aberrations test (human lymphocytes). Results in the in vivo mouse micronucleus test were also negative.
Reproductive and Developmental Toxicity
Canagliflozin
In rat fertility studies, canagliflozin had no adverse effects on mating, fertility, or early embryonic development up to the highest dose of 100 mg/kg/day (up to 19 times the clinical dose of 300 mg based on AUC exposure), although there were slight sperm morphological changes at this dose level.
Canagliflozin was not teratogenic at any dose tested when administered orally to pregnant rats and rabbits during the period of organogenesis. In both rats and rabbits, a slight increase in the number of fetuses with reduced ossification, indicative of a slight developmental delay, was observed at the high doses (approximately 19 times the clinical dose of 300 mg based on AUC exposure) in the presence of maternal toxicity.
In a pre- and postnatal development study, canagliflozin administered orally to female rats from gestation Day 6 to lactation Day 20 resulted in decreased body weights in male and female offspring at maternally toxic doses of ≥ 30 mg/kg/day (≥ 5.9 times the clinical dose of 300 mg based on AUC exposure). Maternal toxicity was limited to decreased body weight gain.
In a juvenile toxicity study in which canagliflozin was dosed orally to young rats from postnatal day (PND) 21 until PND 90 at doses of 4, 20, 65, or 100 mg/kg, increased kidney weights and a dose-related increase in the incidence and severity of renal pelvic and renal tubular dilatation were reported at all dose levels. Exposure at the lowest dose tested was approximately 0.5 times the maximum recommended clinical dose of 300 mg. The renal pelvic dilatations observed in juvenile animals did not fully reverse within the 1-month recovery period. Additionally, shortened ulna growth and delays in sexual maturation were observed in juvenile rats at doses that were greater than or equal to 3 times and 9 times the clinical dose of 300 mg based on AUC exposure, respectively.
Metformin
Fertility of male or female rats was unaffected by metformin when administered at doses as high as 600 mg/kg/day, which is approximately 3 times the maximum recommended human daily dose of 2000 mg based on body surface area comparisons.
Metformin was not teratogenic in rats and rabbits at doses up to 600 mg/kg/day. This represents an exposure of about 2 and 6 times the maximum recommended human daily dose of 2,000 mg based on body surface area comparisons for rats and rabbits, respectively. Determination of fetal concentrations demonstrated a partial placental barrier to metformin.
REFERENCES
- 1. Devineni D, Morrow L, Hompesch M et al. Canagliflozin improves glycemic control over 28 days in subjects with type 2 diabetes not optimally controlled on insulin. Diabetes Obes Metab 2012;14(6):539–545.
- 2. Liang Y, Arakawa K, Ueta K et al. Effect of canagliflozin on renal threshold for glucose, glycemia, and body weight in normal and diabetic animal models. PLoS ONE [serial online] 2012; 7(2): e30555:1-7.
- 3. Neal B, Perkovic V, Mahaffey K et al. Canagliflozin and Cardiovascular and Renal Events in Type 2 Diabetes. N Engl J Med 2017; 377:644-57.
- 4. Perkovic V, Jardine M, Neal B et al. Canagliflozin and Renal Outcomes in Type 2 Diabetes and Nephropathy. N Engl J Med 2019; 380:2295-2306.
- 5. Rosenstock J, Aggarwal N, Polidori D et al. Dose-ranging effects of canagliflozin, a sodium-glucose cotransporter 2 inhibitor, as add-on to metformin in subjects with type 2 diabetes. Diabetes Care. 2012; 35:1232-1238.