


Product Monograph - Fludarabine Phosphate for Injection (Fresenius Kabi Canada)
RECENT MAJOR LABEL CHANGES
| 7 WARNINGS AND PRECATIONS, Reproductive Health: Female and Male Potential | 05/2024 |
|---|---|
| 7 WARNINGS AND PRECAUTIONS, 7.1.1 Pregnant Women | 05/2024 |
| 7 WARNINGS AND PRECAUTIONS, 7.1.2 Breast-feeding | 05/2024 |
TABLE OF CONTENTS
Sections or subsections that are not applicable at the time of authorization are not listed.
RECENT MAJOR LABEL CHANGES ............................................................................................. 2
TABLE OF CONTENTS ............................................................................................................... 2
PART I: HEALTH PROFESSIONAL INFORMATION ....................................................................... 5
1 INDICATIONS ................................................................................................................ 5
1.1 Pediatrics ................................................................................................................. 5
1.2 Geriatrics ................................................................................................................. 5
2 CONTRAINDICATIONS .................................................................................................. 5
3 SERIOUS WARNINGS AND PRECAUTIONS BOX ............................................................. 6
4 DOSAGE AND ADMINISTRATION .................................................................................. 6
4.1 Dosing Considerations ............................................................................................. 6
4.2 Recommended Dose and Dosage Adjustment ......................................................... 6
4.3 Reconstitution ......................................................................................................... 7
4.4 Administration ......................................................................................................... 7
5 OVERDOSAGE ............................................................................................................... 7
6 DOSAGE FORMS, STRENGTHS, COMPOSITION AND PACKAGING .................................. 8
7 WARNINGS AND PRECAUTIONS ................................................................................... 8
7.1 Special Populations ................................................................................................ 12
7.1.1 Pregnant Women .............................................................................................. 12
7.1.2 Breast-feeding ................................................................................................... 12
7.1.3 Pediatrics........................................................................................................... 13
7.1.4 Geriatrics ........................................................................................................... 13
8 ADVERSE REACTIONS ................................................................................................. 13
8.1 Adverse Reaction Overview ................................................................................... 13
8.2 Clinical Trial Adverse Reactions.............................................................................. 13
8.5 Post-Market Adverse Reactions ............................................................................. 16
9 DRUG INTERACTIONS ................................................................................................. 17
9.1 Serious Drug Interactions ....................................................................................... 17
9.2 Drug Interactions Overview ................................................................................... 17
9.3 Drug-Behavioural Interactions ............................................................................... 17
9.4 Drug-Drug Interactions .......................................................................................... 17
9.5 Drug-Food Interactions .......................................................................................... 17
9.6 Drug-Herb Interactions .......................................................................................... 17
9.7 Drug-Laboratory Test Interactions ......................................................................... 17
10 CLINICAL PHARMACOLOGY ........................................................................................ 18
10.1 Mechanism of Action ............................................................................................. 18
10.3 Pharmacokinetics ................................................................................................... 18
11 STORAGE, STABILITY AND DISPOSAL .......................................................................... 28
12 SPECIAL HANDLING INSTRUCTIONS ............................................................................ 28
PART II: SCIENTIFIC INFORMATION ........................................................................................ 29
13 PHARMACEUTICAL INFORMATION ............................................................................. 29
14 CLINICAL TRIALS ......................................................................................................... 30
14.1 Trial Design and Study Demographics .................................................................... 30
14.2 Study Results ......................................................................................................... 30
15 MICROBIOLOGY ......................................................................................................... 31
16 NON-CLINICAL TOXICOLOGY ...................................................................................... 31
17 SUPPORTING PRODUCT MONOGRAPHS ..................................................................... 51
PATIENT MEDICATION INFORMATION ................................................................................... 52
PART I: HEALTH PROFESSIONAL INFORMATION
1 INDICATIONS
Fludarabine Phosphate Injection and Fludarabine Phosphate for Injection (fludarabine phosphate) is indicated for:
- Second-line treatment in patients with chronic lymphocytic leukemia (CLL) and low-grade non-Hodgkin’s lymphoma (Lg-NHL) who have failed other conventional therapies.
1.1 Pediatrics
Pediatrics (<18 years of age): No data are available to Health Canada; therefore, Health Canada has not authorized an indication for pediatric use.
1.2 Geriatrics
Since there are limited data for the use of fludarabine phosphate in elderly persons (>75 years), caution should be exercised with the administration of fludarabine phosphate in these patients. The total body clearance of the principal plasma metabolite 2F-ara-A shows a correlation with creatinine clearance, indicating the importance of the renal excretion pathway for the elimination of the compound. Patients with reduced kidney function demonstrated an increased total body exposure (area under the curve [AUC] of 2F-ara-A). Limited clinical data are available in patients with impairment of renal function (creatinine clearance below 70 mL/min). Since renal impairment is frequently present in patients over the age of 70 years, creatinine clearance should be measured. If creatinine clearance is between 30 and 70 mL/min, the dose should be reduced by up to 50% and close hematologic monitoring should be used to assess toxicity. Fludarabine phosphate treatments are contraindicated if creatinine clearance is < 30 mL/min. (See 7 WARNINGS AND PRECAUTIONS and 4 DOSAGE AND ADMINISTRATION)
2 CONTRAINDICATIONS
- Patients who are hypersensitive to this drug or to any ingredient in the formulation or component of the container. For a complete listing, see the 6 DOSAGE FORMS, STREGTHS, COMPOSITION AND PACKAGING section of the product monograph.
- Renally impaired patients with creatinine clearance < 30 mL/min.
- Patients with decompensated hemolytic anemia.
- In a clinical investigation using fludarabine phosphate in combination with pentostatin (deoxycoformycin) for the treatment of refractory CLL, there was an unacceptably high incidence of fatal pulmonary toxicity. Therefore, the use of fludarabine phosphate in combination with pentostatin is contraindicated.
3 SERIOUS WARNINGS AND PRECAUTIONS BOX
Serious Warnings and Precautions
Fludarabine Phosphate Injection and Fludarabine Phosphate for Injection (fludarabine phosphate) should be administered under the supervision of, or prescribed by, a qualified physician experienced in the use of antineoplastic therapy. Fludarabine phosphate is associated with:
In a clinical investigation using fludarabine phosphate in combination with pentostatin (deoxycoformycin) for the treatment of refractory CLL, there was an unacceptably high incidence of fatal pulmonary toxicity. Therefore, the use of Fludarabine Phosphate Injection and Fludarabine Phosphate for Injection in combination with pentostatin is contraindicated. |
|---|
4 DOSAGE AND ADMINISTRATION
4.1 Dosing Considerations
Note that in patients with decreased renal function (creatinine clearance between 30 and 70 mL/min), the dose should be reduced by up to 50%. Fludarabine Phosphate Injection and Fludarabine Phosphate for Injection treatment are contraindicated if creatinine clearance is < 30 mL/min. (See 7 WARNINGS AND PRECAUTIONS)
Incompatibilities:
The formulation for intravenous use must not be mixed with other drugs.
4.2 Recommended Dose and Dosage Adjustment
The usual starting dose of Fludarabine Phosphate Injection and Fludarabine Phosphate for Injection is 25 mg/m2 administered intravenously over a period of approximately 30 minutes, daily for five days every 28 days. Dosage may be decreased based on evidence of hematologic or nonhematologic toxicity. Health Canada has not authorized an indication for pediatric use.
The duration of treatment depends on the treatment success and the tolerability of the drug. Fludarabine Phosphate Injection and Fludarabine Phosphate for Injection should be administered until the achievement of a maximal response (complete or partial remission, usually 6 cycles) and then the drug should be discontinued.
4.3 Reconstitution
Parenteral Products:
| Vial size | Volume of diluent to be added to vial | Approximate available volume | Nominal concentration per vial |
| 6 mL | 2 mL | 2 mL | 50 mg |
Fludarabine Phosphate for Injection should be prepared for parenteral use by aseptically adding Sterile Water for Injection USP. When reconstituted with 2 mL of Sterile Water for Injection USP, each mL of the resulting solution will contain 25 mg of fludarabine phosphate, 25 mg of mannitol and sodium hydroxide. The pH range of the final solution is 7.2 – 8.2.
The product may be further diluted for intravenous administration to a concentration of 1 mg/mL in 5% Dextrose Injection USP or in 0.9% Sodium Chloride Injection USP.
4.4 Administration
Studies in animals have shown that even in cases of misplaced injections, no relevant local irritation was observed after paravenous, intra-arterial and intramuscular administration of an aqueous solution containing 7.5 mg fludarabine phosphate/mL.
It is strongly recommended that Fludarabine Phosphate Injection and Fludarabine Phosphate for Injection should only be administered intravenously. No cases have been reported in which paravenously administered fludarabine phosphate led to severe local adverse reactions. However, unintentional paravenous administration should be avoided.
The product may be diluted for intravenous administration to a concentration of 1 mg/mL in 5% Dextrose Injection USP or in 0.9% Sodium Chloride Injection USP.
5 OVERDOSAGE
Higher than recommended doses of fludarabine phosphate have been associated with leukoencephalopathy, acute toxic leukoencephalopathy, or posterior reversible encephalopathy syndrome (PRES)/reversible posterior leukoencephalopathy syndrome (RPLS). Symptoms, which may be delayed and irreversible, may include headache, nausea and vomiting, seizures, visual disturbances such as vision loss, altered sensorium, focal neurological deficits, coma, and death. Additional effects may include optic neuritis, and papillitis, confusion, somnolence, agitation, paraparesis/quadriparesis, muscle spasticity and incontinence. High doses are also associated with bone marrow suppression manifested by thrombocytopenia and neutropenia.
There is no known specific antidote for fludarabine phosphate overdosage. Treatment consists of drug discontinuation and supportive therapy.
| For management of a suspected drug overdose, contact your regional poison control centre. |
|---|
6 DOSAGE FORMS, STRENGTHS, COMPOSITION AND PACKAGING
Table 1 Dosage Forms, Strengths, Composition and Packaging
| Route of Administration | Dosage Form/Strength/Composition | Non-medicinal Ingredients |
|---|---|---|
| Intravenous | Solution, 25 mg / mL | Mannitol, sodium hydroxide, water for injection |
| Powder for solution, 50 mg / vial | Mannitol, sodium hydroxide |
Fludarabine Phosphate Injection
Each mL of sterile injectable solution contains 25 mg of fludarabine phosphate, mannitol, water for injection and sodium hydroxide to adjust the pH to 6.8.
pH: 6.0 – 7.1
Availability: Fludarabine Phosphate Injection for intravenous injection is supplied as a 2 mL single-dose vial packaged in an individual carton.
Fludarabine Phosphate for Injection
Each vial of sterile lyophilized powder for injection contains 50 mg of fludarabine phosphate, mannitol and sodium hydroxide to adjust the pH to 7.7. Reconstitution with 2 mL of Sterile Water for Injection USP results in a solution containing 25 mg/mL of fludarabine phosphate intended for intravenous administration.
pH: 7.2 - 8.2
Availability: Fludarabine Phosphate for Injection for intravenous administration is supplied in a single-dose vial package in individual carton.
7 WARNINGS AND PRECAUTIONS
Please see 3 SERIOUS WARNINGS AND PRECAUTIONS BOX.
General
Fludarabine phosphate is a potent antineoplastic agent with potentially significant toxic side effects. Patients undergoing therapy should be closely observed for signs of hematologic and nonhematologic toxicity. Periodic assessment of peripheral blood counts is recommended to detect the development of neutropenia, thrombocytopenia, anemia and leukopenia.
Vaccination with live vaccines should be avoided during and after treatment with fludarabine phosphate.
Carcinogenesis and Mutagenesis
Disease progression and transformation (e.g., Richter’s Syndrome) have been commonly reported in CLL patients (see 7 WARNINGS AND PRECAUTIONS, Skin).
Driving and Operating Machinery
Fludarabine phosphate may reduce the ability to drive or use machines, since fatigue, weakness, visual disturbances, confusion, agitation and seizures have been observed.
Endocrine and Metabolism
Tumor lysis syndrome associated with fludarabine phosphate treatment has been reported in CLL patients with large tumor burdens. Since fludarabine phosphate can induce a response as early as the first week of treatment, precautions should be taken in those patients at risk of developing this complication.
Gastrointestinal
In clinical trials with oral fludarabine phosphate, nausea/vomiting and/or diarrhea were reported in approximately 38% of patients. In most cases, the severity was mild to moderate (WHO toxicity grading). Only a small percentage of patients, approximately 1% with nausea/vomiting and 5% with diarrhea, required therapy. Patients with prolonged, clinically relevant, nausea/vomiting and diarrhea should be closely monitored to avoid dehydration.
Hematologic
In patients with an impaired state of health, fludarabine phosphate should be given with caution and after careful risk/benefit consideration. This applies especially to patients with severe impairment of bone marrow function (thrombocytopenia, anemia and/or granulocytopenia), immunodeficiency or with a history of opportunistic infection. Prophylactic treatment should be considered in patients at increased risk of developing opportunistic infections (see 8 ADVERSE REACTIONS).
Severe bone marrow suppression, notably thrombocytopenia, anemia, leukopenia and neutropenia, may occur with administration of fludarabine phosphate and requires careful hematologic monitoring. In a phase I study in solid tumor patients, the median time to nadir counts was 13 days (range, 3 - 25 days) for granulocytes and 16 days (range, 2 - 32 days) for platelets. Most patients had hematologic impairment at baseline either as a result of disease or as a result of prior myelosuppressive therapy. Cumulative myelosuppression may be seen. While chemotherapy-induced myelosuppression is often reversible, administration of fludarabine phosphate requires careful hematologic monitoring.
Several instances of trilineage bone marrow hypoplasia or aplasia resulting in pancytopenia, sometimes resulting in death, have been reported in adult patients. The duration of clinically significant cytopenia in the cases reported has ranged from approximately 2 months to approximately 1 year. These episodes have occurred in both previously treated and untreated patients.
Instances of life-threatening and sometimes fatal autoimmune phenomena (e.g., autoimmune hemolytic anemia, autoimmune thrombocytopenia, thrombocytopenic purpura, pemphigus, acquired hemophilia and Evans' syndrome) have been reported to occur during or after treatment with fludarabine phosphate in patients with or without a previous history of autoimmune processes or a positive Coombs' test and who may or may not be in remission from their disease. Steroids may or may not be effective in controlling these hemolytic episodes. One study was performed with 31 patients with hemolytic anemia related to the administration of fludarabine phosphate. Since the majority (90%) of these patients rechallenged with fludarabine phosphate developed a recurrence in the hemolytic process, rechallenge with fludarabine phosphate should be avoided. The mechanisms which predispose patients to the development of this complication have not been identified. Patients undergoing treatment with fludarabine phosphate should be evaluated and closely monitored for signs of autoimmune hemolytic anemia (a decline in hemoglobin linked with hemolysis and a positive Coombs' test). Discontinuation of therapy with fludarabine phosphate is recommended in the event of hemolysis. The transfusion of irradiated blood and the administration of corticosteroids are the most common treatment measures for autoimmune hemolytic anemia.
Hepatic/Biliary/Pancreatic
No data are available concerning the use of fludarabine phosphate in patients with hepatic impairment. In this group of patients, fludarabine phosphate should be used with caution and administered if the perceived benefit outweighs any potential risk.
Immune
Transfusion-associated graft-versus-host disease (reaction by the transfused immunocompetent lymphocytes to the host) has been observed after transfusion of nonirradiated blood in patients treated with fludarabine phosphate. Fatal outcome as a consequence of this disease has been reported with a high frequency. Therefore, to minimize the risk of transfusion-associated graft-versus-host disease, patients who require blood transfusion and who are undergoing or who have received treatment with fludarabine phosphate should receive irradiated blood only.
Monitoring and Laboratory Tests
During treatment, the patient's hematologic (particularly neutrophils and platelets) and serum chemistry profiles should be monitored regularly.
Lymphocytotoxicity in Humans
Fludarabine phosphate was assessed for its lymphocytotoxicity in 11 patients receiving the investigational drug for treatment of nonhematologic cancers refractory to standard treatment. Fludarabine phosphate was administered by intravenous infusion at doses ranging from 18 mg/m2/day to 40 mg/m2/day, with each dose given on a 5-day dosing regimen.
Lymphocyte subsets were determined prior to treatment and on day 5 of treatment, 4 hours after the infusion. Observations indicated that lymphocytopenia developed rapidly but was reversible. Total T-lymphocyte counts fell during all treatment regimens, with a 90% decrease in mean absolute T-cell count. All major T-lymphocyte subsets were affected. B-lymphocyte counts decreased by 50% on average. Recoveries of total mononuclear cells, total T-cells and non-T, non-B cells were reduced substantially by fludarabine phosphate treatment. B-cell recovery was not affected.
These results indicate that T-cells are more sensitive than B-cells to the cytotoxic effects of fludarabine phosphate.
Neurologic
Administration of fludarabine phosphate can be associated with leukoencephalopathy (LE), acute toxic leukoencephalopathy (ATL), or posterior reversible encephalopathy syndrome (PRES)/ reversible posterior leukoencephalopathy syndrome (RPLS).
LE, ATL or PRES/RPLS may occur:
at the recommended dose, most commonly
- when fludarabine phosphate is given following, or in combination with, medications known to be associated with LE, ATL or PRES/RPLS, or
- when fludarabine phosphate is given in patients with cranial or total body irradiation, Graft versus Host Disease, renal impairment, or following Hematopoietic Stem Cell Transplantation.
- at doses higher than the recommended dose.
When high doses of fludarabine phosphate were administered in dose-ranging studies in acute leukemia patients, a syndrome with delayed onset, characterized by blindness, coma and death was identified. Symptoms appeared from 21 to 60 days post dosing (however, in post-marketing experience, cases of neurotoxicity have been reported to occur both earlier and later than seen in clinical trials). Demyelination, especially of the occipital cortex of the brain was noted. The majority of these cases occurred in patients treated intravenously with doses approximately four times greater (96 mg/m2/day for 5-7 days) than the recommended dose. Thirteen of 36 patients (36.1%) who received fludarabine phosphate at high doses (≥ 96 mg/m2/day for 5 to 7 days per course) developed severe neurotoxicity, while only one of 443 patients (0.2%) who received the drug at low doses (≤ 40 mg/m2/day for 5 days per course) developed the toxicity. In patients treated at doses in the range of the dose recommended for CLL and Lg-NHL, severe central nervous system toxicity occurred rarely (coma, seizures and agitation) or uncommonly (confusion).
LE, ATL or PRES/RPLS symptoms may include headache, nausea and vomiting, seizures, visual disturbances such as vision loss, altered sensorium, and focal neurological deficits. Additional effects may include optic neuritis, and papillitis, confusion, somnolence, agitation, paraparesis/quadriparesis, muscle spasticity, incontinence, and coma.
The onset of the neurologic symptoms can be delayed and may occur after discontinuation of fludarabine. Late-occurring encephalopathy has been reported up to 4.8 years following fludarabine.
LE/ ATL/ PRES/RPLS may be irreversible, life-threatening, or fatal.
The effect of chronic administration of fludarabine phosphate on the central nervous system is unknown. In some studies, however, patients tolerated the recommended dose for relatively long treatment periods (up to 26 courses of therapy).
Periodic neurological assessments are recommended. Whenever LE, ATL or PRES/RPLS is suspected, fludarabine phosphate treatment should be stopped. Patients should be monitored and should undergo brain imaging, preferably utilizing MRI. If the diagnosis is confirmed, fludarabine phosphate therapy should be permanently discontinued.
Renal
The total body clearance of the principal plasma metabolite 2F-ara-A shows a correlation with creatinine clearance, indicating the importance of the renal excretion pathway for the elimination of the compound. Patients with reduced renal function demonstrated an increased total body exposure (AUC of 2F-ara-A). Limited clinical data are available in patients with impairment of renal function (creatinine clearance below 70 mL/min). Therefore, if renal impairment is clinically suspected, or in patients over the age of 70 years, creatinine clearance should be measured. If creatinine clearance is between 30 and 70 mL/min, the dose should be reduced by up to 50% and close hematological monitoring should be used to assess toxicity. Fludarabine phosphate treatment is contraindicated if creatinine clearance is < 30 mL/min. (See 4 DOSAGE AND ADMINISTRATION)
Reproductive Health: Female and Male Potential
Preclinical toxicology studies in mice, rats and dogs have demonstrated dose-related adverse effects on the male reproductive system. Observations consisted of a decrease in mean testicular weights in dogs and degeneration and necrosis of spermatogenic epithelium of the testes in mice, rats and dogs. The possible adverse effects on fertility in males and females in humans have not been adequately evaluated. Therefore, it is recommended that females of child-bearing potential take contraceptive measures during fludarabine phosphate therapy and for at least 6 months after the cessation of fludarabine phosphate therapy. Sexually active male patients must use effective methods of contraception and be advised to not father a child while receiving fludarabine phosphate, and for at least 6 months following completion of treatment. Male patients taking fludarabine phosphate should inform their female sexual partners of fludarabine phosphate use and the potential serious risks to a developing fetus if pregnancy occurs during the treatment period. Prior to fludarabine phosphate treatment, patients must seek advice on fertility preservation options. After fludarabine phosphate treatment, patients planning pregnancy are advised to seek genetic counselling.
Skin
The worsening or flare-up of pre-existing skin cancer lesions as well as new onset of skin cancer have been reported to occur in patients during or after intravenous fludarabine phosphate therapy.
Teratogenic Risk:
Fludarabine Phosphate may increase the risk of genetic defects or fetal malformations. Consequently, Fludarabine Phosphate must not be used during pregnancy.
7.1 Special Populations
7.1.1 Pregnant Women
Fludarabine phosphate has been shown to be genotoxic. Fludarabine phosphate has also been shown to be both embryotoxic, fetotoxic and teratogenic in rabbits and rats (see 16 NON-CLINICAL TOXICOLOGY). FLUDARA may cause fetal harm when administered to pregnant females. Therefore, FLUDARA must not be used during pregnancy.
Females of childbearing potential receiving fludarabine phosphate should be advised to avoid becoming pregnant, and to inform the treating physician immediately should this occur. (see 16 NON-CLINICAL TOXICOLOGY)
Due to the genotoxic risk of fludarabine phosphate, women of childbearing potential must take effective contraceptive measures during and at least for 6 months after cessation of therapy. If the patient becomes pregnant while taking this drug, the patient should be warned of the potential hazard to the foetus. Male patients must use effective methods of contraception and be advised to not father a child while receiving fludarabine phosphate, and for 6 months following completion of treatment.
7.1.2 Breast-feeding
It is not known whether fludarabine phosphate is excreted in human milk. Breast-feeding must not be initiated during fludarabine phosphate treatment. Because of the potential for adverse reactions in nursing infants, breast feeding must be discontinued for the duration of fludarabine phosphate therapy.
There is evidence from preclinical data after intravenous administration to rats that fludarabine phosphate and/or metabolites transfer from maternal blood to milk.
7.1.3 Pediatrics
Pediatrics (<18 years of age): No data are available to Health Canada; therefore, Health Canada has not authorized an indication for pediatric use.
7.1.4 Geriatrics
Since there are limited data for the use of fludarabine phosphate in elderly persons (>75 years), caution should be exercised with the administration of fludarabine phosphate in these patients. The total body clearance of the principal plasma metabolite 2F-ara-A shows a correlation with creatinine clearance, indicating the importance of the renal excretion pathway for the elimination of the compound. Patients with reduced kidney function demonstrated an increased total body exposure (AUC of 2F-ara-A). Limited clinical data are available in patients with impairment of renal function (creatinine clearance below 70 mL/min). Since renal impairment is frequently present in patients over the age of 70 years, creatinine clearance should be measured. If creatinine clearance is between 30 and 70 mL/min, the dose should be reduced by up to 50% and close hematologic monitoring should be used to assess toxicity. Fludarabine phosphate treatment is contraindicated if creatinine clearance is <30 mL/min. (See 4 DOSAGE AND ADMNISTRATION)
8 ADVERSE REACTIONS
8.1 Adverse Reaction Overview
The most common adverse events occurring with fludarabine phosphate use include myelosuppression (anemia, leukopenia, neutropenia and thrombocytopenia), leading to decreased resistance to infection; including pneumonia, cough, fever, fatigue, weakness, nausea, vomiting and diarrhea. Other commonly reported events include chills, edema, malaise, peripheral neuropathy, visual disturbance, anorexia, mucositis, stomatitis and skin rash. Serious opportunistic infections have occurred in patients treated with fludarabine phosphate. Fatalities as a consequence of serious adverse events have been reported.
8.2 Clinical Trial Adverse Reactions
Clinical trials are conducted under very specific conditions. The adverse reaction rates observed in the clinical trials; therefore, may not reflect the rates observed in practice and should not be compared to the rates in the clinical trials of another drug. Adverse reaction information from clinical trials may be useful in identifying and approximating rates of adverse drug reactions in real-world use.
The table below reports adverse events by MedDRA system organ classes (MedDRA SOCs). The frequencies are based on clinical trial data regardless of the causal relationship with fludarabine phosphate.
Table 2 Fludarabine Phosphate Clinical Trial Adverse Events (by MedDRA SOC)
| System Organ Class MedDRA | Very Common ≥1/10 | Common ≥1/100 to <1/10 | Uncommon ≥1/1 000 to <1/100 | Rare ≥1/10 000 to <1/1 000 |
|---|---|---|---|---|
| Infections and infestations | Infections/opportunistic infections (like latent viral reactivation, e.g., Herpes zoster virus, Epstein-Barr virus, Progressive multifocal leucoencephalopathy), Pneumonia | Lymphoproliferative disorder (EBV-associated) | ||
| Neoplasms benign, malignant and unspecified (incl. cysts and polyps) | Myelodysplastic syndrome and acute myeloid leukaemia (mainly associated with prior, concomitant, or subsequent treatment with alkylating agents, topoisomerase inhibitors or irradiation) | |||
| Blood and lymphatic system disorders | Neutropenia, anemia, thrombocytopenia | Myelosuppression | ||
| Immune system disorders | Autoimmune disorder (including autoimmune hemolytic anemia, thrombocytopenic purpura, pemphigus, Evans syndrome, acquired hemophilia) |
| System Organ Class MedDRA | Very Common ≥1/10 | Common ≥1/100 to <1/10 | Uncommon ≥1/1 000 to <1/100 | Rare ≥1/10 000 to <1/1 000 |
|---|---|---|---|---|
| Metabolism and nutrition disorders | Anorexia | Tumor lysis syndrome (including renal failure, hyperkalemia, metabolic acidosis, hematuria, urate crystalluria, hyperuricemia, hyperphosphatemia, hypocalcemia) | ||
| Nervous system disorders | Neuropathy peripheral | Confusion | Agitation, seizures, coma | |
| Eye disorders | Visual disturbance | Optic neuritis, optic neuropathy, blindness | ||
| Cardiac disorders | Heart failure, arrhythmia | |||
| Respiratory, thoracic and mediastinal disorders | Cough | Pulmonary toxicity (including dyspnea, pulmonary fibrosis, pneumonitis) | ||
| Gastrointestinal disorders | Nausea, vomiting, diarrhea | Stomatitis | Gastrointestinal hemorrhage, pancreatic enzymes abnormal | |
| Hepatobiliary disorders | Hepatic enzyme abnormal | |||
| Skin and subcutaneous tissue disorders | Rash | Skin cancer, Stevens-Johnson syndrome, necrolysis epidermal toxic (Lyell type) | ||
| Renal and urinary disorder | Urinary tract hemorrhage (including hemorrhagic cystitis) | |||
| General disorders and administration site conditions | Fever, fatigue, weakness | Chills, malaise, edema, mucositis |
8.5 Post-Market Adverse Reactions
The following adverse reactions are based on post-marketing data regardless of the causal relationship with fludarabine phosphate.
Blood and lymphatic disorders: pancytopenia, myelosuppression, neutropenia, thrombocytopenia, anemia, cytopenia, tri-lineage bone marrow aplasia
Cardiac disorders: edema, heart failure, arrhythmia
Eye disorders: blindness, optic neuritis, optic neuropathy, eye hemorrhage including retinal
Gastrointestinal disorders: anorexia
General disorders and administrative conditions: chills
Genitourinary disorders (initial PI)/Metabolism and nutritional disorders: hematuria (context of TLS), hypocalcemia (context of TLS), hyperphosphatemia (context of TLS), hyperuricemia, renal failure (context of TLS), urate crystalluria (context of TLS), metabolic acidosis (context of TLS), hyperkalemia (context of TLS)
Hepatobiliary disorders: hepatic enzymes abnormal, pancreatic enzymes abnormal
Immune system disorders: transfusion-related GVHD, thrombocytopenic purpura, Evans syndrome, pemphigus, autoimmune hemolytic anemia, acquired hemophilia
Infections and infestations: opportunistic infections, herpes zoster virus, Epstein-Barr virus, latent viral reactivation, progressive multifocal leucoencephalopathy, human polyomavirus JC virus (context of PML), disease transformation CLL
Neoplasms, benign, malignant and unspecified: acute myeloid leukemia, Richter’s syndrome, myelodysplastic syndrome, disease progressive CLL, lympho-proliferative disorder (EBV-associated)
Nervous system disorders: seizures, agitation, confusion, coma; leukoencephalopathy, acute toxic leukoencephalopathy, posterior reversible encephalopathy syndrome/ reversible posterior leukoencephalopathy syndrome (see 7 WARNINGS AND PRECAUTIONS, Neurologic)
Respiratory, thoracic and mediastinal disorders: pulmonary toxicity, pneumonitis, pulmonary fibrosis, dyspnea
Skin and subcutaneous tissue disorders: toxic epidermal necrolysis, rash, worsening of pre-existing skin cancer lesions, skin cancer, Stevens-Johnson syndrome
Vascular disorders: hemorrhage, pulmonary hemorrhage, gastrointestinal hemorrhage, urinary tract hemorrhage including hemorrhagic cystitis, cerebral hemorrhage
9 DRUG INTERACTIONS
9.1 Serious Drug Interactions
Serious Drug Interactions In a clinical investigation using fludarabine phosphate in combination with pentostatin (deoxycoformycin) for the treatment of refractory CLL, there was an unacceptably high incidence of fatal pulmonary toxicity. Therefore, the use of Fludarabine Phosphate Injection and Fludarabine Phosphate for Injection in combination with pentostatin is contraindicated. |
|---|
9.2 Drug Interactions Overview
Interactions with drugs have not been established.
9.3 Drug-Behavioural Interactions
Interactions with behaviours have not been established.
9.4 Drug-Drug Interactions
The therapeutic efficacy of fludarabine phosphate may be reduced by dipyridamole and other inhibitors of adenosine uptake.
Clinical studies and in vitro experiments showed that using fludarabine phosphate in combination with cytarabine may increase the intracellular concentration and intracellular exposure of Ara-CTP (active metabolite of cytarabine) in leukemic cells. Plasma concentrations of Ara-C and the elimination rate of Ara-C were not affected.
9.5 Drug-Food Interactions
Interactions with food have not been established.
9.6 Drug-Herb Interactions
Interactions with herbal products have not been established.
9.7 Drug-Laboratory Test Interactions
Interactions with laboratory tests have not been established.
10 CLINICAL PHARMACOLOGY
10.1 Mechanism of Action
Fludarabine phosphate is a fluorinated analog of adenine that is relatively resistant to deamination by adenosine deaminase.
Fludarabine phosphate (2F-ara-AMP) is a water-soluble prodrug, which is rapidly dephosphorylated to 2-fluoro-ara-A (2F-ara-A) and then phosphorylated intracellularly by deoxycytidine kinase to the active triphosphate 2-fluoro-ara-ATP (2F-ara-ATP). The antitumor activity of this metabolite is the result of inhibition of DNA synthesis via inhibition of ribonucleotide reductase, DNA polymerase α, δ and ε, DNA primase, and DNA ligase. Furthermore, partial inhibition of RNA polymerase II and consequent reduction in protein synthesis occur. While some aspects of the mechanism of action of 2F-ara-ATP are as yet unclear, it is believed that effects on DNA, RNA and protein synthesis all contribute to the inhibition of cell growth, with inhibition of DNA synthesis being the dominant factor. In addition, in vitro studies have shown that exposure of CLL lymphocytes to 2F-ara-A triggers extensive DNA fragmentation and apoptosis.
10.3 Pharmacokinetics
Table 3 Summary of fludarabine phosphate pharmacokinetic parameters in cancer patients
| Single dose mean | Cmax | Tmax (h) | t½ (h) | AUC0-∞ | CL | Vss |
|---|---|---|---|---|---|---|
| 25 mg 2F-ara-AMP/m2 | 3.5 – 3.7 mcM | 0.5 | 20 | ---- | 79 mL/min/m2 | 83 L/m2 |
Cellular Pharmacokinetics of Fludarabine Triphosphate
Maximum 2F-ara-ATP levels in leukemic lymphocytes of CLL patients were observed at a median of 4 hours and exhibited considerable variation with a median peak concentration of approximately 20 mcM. 2F-ara-ATP levels in leukemic cells were always considerably higher than maximum 2F-ara-A levels in the plasma, indicating an accumulation at the target sites. In vitro incubation of leukemic lymphocytes showed a linear relationship between extracellular 2F-ara-A exposure (product of 2F-ara-A concentration and duration of incubation) and intracellular 2F-ara-A enrichment. Two independent investigations respectively reported median half-life values of 15 and 23 hours for the elimination of 2F-ara-ATP from target cells.
No clear correlation was found between 2F-ara-A pharmacokinetics and treatment efficacy in cancer patients; however, the occurrence of neutropenia and hematocrit changes indicated that the cytotoxicity of fludarabine phosphate depresses hematopoiesis in a dose-dependent manner.
Plasma and Urinary Pharmacokinetics of Fludarabine (2F-ara-A)
Phase I studies in humans have demonstrated that fludarabine phosphate is rapidly converted to the active metabolite, 2F-ara-A, within minutes after intravenous infusion. Consequently, clinical pharmacology studies have focused on 2F-ara-A pharmacokinetics. After single doses of 25 mg 2F-ara-AMP/m2 to cancer patients infused over 30 minutes, 2F-ara-A reached mean maximum concentrations in the plasma of 3.5 - 3.7 mcM at the end of infusion. Corresponding 2F-ara-A levels after the fifth dose showed a moderate accumulation with mean maximum levels of 4.4 -4.8 mcM at the end of infusion. During a 5-day treatment cycle, 2F-ara-A plasma trough levels increased by a factor of about 2. Accumulation of 2F-ara-A over several treatment cycles does not occur. Post maximum levels decayed in three disposition phases with an initial half-life of approximately 5 minutes, an intermediate half-life of 1-2 hours and a terminal half-life of approximately 20 hours.
An interstudy comparison of 2F-ara-A pharmacokinetics resulted in a mean total plasma clearance (CL) of 79 mL/min/m2 (2.2 mL/min/kg) and a mean volume of distribution (Vss) of 83 L/m2 (2.4 L/kg). The data showed a high interindividual variability. After intravenous and peroral administration of fludarabine phosphate, plasma levels of 2F-ara-A and areas under the plasma level time curves increased linearly with the dose; whereas half-lives, plasma clearance and volumes of distribution remained constant independent of the dose, indicating a dose-linear behaviour.
The mean steady-state volume of distribution (Vdss) of 2F-ara-A in one study was 96 L/m2, suggesting a significant degree of tissue binding. Another study, in which Vdss for patients was determined to be 44 L/m2, supports the suggestion of tissue binding.
Based upon compartmental analysis of pharmacokinetic data, the rate-limiting step for excretion of 2F-ara-A from the body appears to be release from tissue-binding sites. Total body clearance of 2F-ara-A has been shown to be inversely correlated with serum creatinine, suggesting renal elimination of the compound.
Special Populations and Conditions
Renal Insufficiency
A pharmacokinetic study in patients with and without renal impairment revealed that, in patients with normal renal function, 40 to 60% of the administered intravenous dose was excreted in the urine. Mass balance studies in laboratory animals with 3H-2F-ara-AMP showed a complete recovery of radio-labelled substances in the urine. Another metabolite, 2F-ara-hypoxanthine, which represents the major metabolite in the dog, was observed in humans only to a minor extent.
Patients with impaired renal function exhibited a reduced total body clearance, indicating the need for a reduced dose. Total body clearance of 2F-ara-A has been shown to be inversely correlated with serum creatinine, suggesting renal elimination of the compound. This was confirmed in a study of the pharmacokinetics of 2F-ara-A following administration of 2F-ara-AMP to cancer patients with normal renal function or varying degrees of renal impairment. The total body clearance of the principal metabolite 2F-ara-A shows a correlation with creatinine clearance, indicating the importance of the renal excretion pathway for the elimination of the compound. Renal clearance represented on average 40% of the total body clearance. In vitro investigations with human plasma proteins revealed no pronounced tendency of 2F-ara-A protein binding.
Pharmacokinetics (Humans)
The pharmacokinetics of fludarabine phosphate given intravenously have been determined in adult patients undergoing phase I clinical trials at the University of Texas Health Science Center at San Antonio (UT), the University of Texas System Cancer Center at the M.D. Anderson Cancer Center (MDACC) and at Ohio State University (OSU). In addition, the pharmacokinetics of intraperitoneal fludarabine phosphate were also determined at UT and the pharmacokinetics of intravenous fludarabine phosphate in pediatric patients with leukemias and solid tumors were determined at the Children's Hospital of Los Angeles, the National Cancer Institute (NCI) and the Mayo Clinic.
Preliminary nonclinical and phase I human studies demonstrated that fludarabine phosphate is rapidly converted to 2F-ara-A within minutes after intravenous infusion and then phosphorylated intracellularly by deoxycytidine kinase to the active triphosphate, 2F-ara-ATP. Consequently, clinical pharmacology studies have focused on 2F-ara-A pharmacokinetics.
Described in the following pages are three principal pharmacokinetic studies that characterize the pharmacokinetic parameters of 2F-ara-A. Despite the differences in dosage and dosing schedules between these various studies discussed on the following pages, several consistent results were obtained. For the infusion studies, a mean terminal half-life of 9.2 hours was found in the population of patients studied at UT and a median terminal half-life of approximately 8 hours was observed in the patients studied at MDACC. These values compare favorably to the 10.16-hour mean terminal half-life reported by the OSU investigators following large intravenous bolus injections. The terminal half-life of 2F-ara-A does not appear to be dose-dependent, as the doses used in these studies ranged from 18 to 260 mg/m2.
The discrepancies between the studies regarding the biphasic or triphasic elimination patterns appear to be due to differences in sampling schedules and duration of intravenous administration.
In addition, sampling duration has an impact upon the calculated value of the terminal half-life (t½γ). The majority of pharmacokinetic studies use a blood sampling duration of 24 to 30 hours, which gives a calculated terminal half-life (t½γ) of 8 to 10 hours. However, when the sampling duration is increased to 72 hours, the additional time points give a calculated t½γ of up to 31 hours. Because the plasma concentration of 2F-ara-A declines more than 50-fold from the peak concentration before this long elimination phase, the consequences of the relatively low 2F-ara-A concentration remaining in the plasma after 24 hours (<0.1 pmol/L) remain uncertain as far as drug scheduling is concerned.
In addition, both the UT and OSU investigators found a positive correlation between area under concentration-time curves and degree of neutropenia, reinforcing the assertion that toxicity (myelosuppression) is dose-related.
Phase I-II Study of Fludarabine in Hematologic Malignancies (Study No. T83-1275) Conducted at the University of Texas, San Antonio
Methods
The pharmacokinetic parameters of the principal metabolite of fludarabine phosphate, 2F-ara-A, were determined in 7 adult patients (6 male; 1 female) who received fludarabine phosphate at doses of 18 or 25 mg/m2/day as a 30-minute intravenous infusion daily for 5 consecutive days.
Blood and urine samples were analyzed by HPLC for concentrations of 2F-ara-A.
The plasma concentration-time data, which were determined by HPLC, were analyzed by nonlinear least squares regression analysis (NONLIN) using a zero order infusion input with first order elimination from the central compartment. Both a two- and a three-compartment model were tested and the data fitted the two-compartment open model.
Pharmacokinetic Parameters
Peak plasma concentrations of 2F-ara-A ranged from 0.199 to 0.876 mcg/mL and appeared to be related to the dose and rate of infusion. Mean plasma concentrations of 2-fluoro-ara-A on days 1 and 5 in patients receiving 18 mg/m2/day were 0.39 and 0.51 mcg/mL, respectively. Mean plasma concentrations of 2F-ara-A on days 1 and 5 in patients receiving 25 mg/m2/day were 0.57 and 0.54 mcg/mL, respectively. There was no drug accumulation during the 5-day treatment period.
The pharmacokinetic parameters derived from this study are presented in Table 4.
Table 4 2F-ara-A Kinetic Parameters
| Patient | BSA (m2) | Dose | Duration of infusion (min) | Peak conc. (mcg/mL) | Clearance rates (L/h/m2) | Volumes of distribution (L/m2) | t½ (h) | |||||||||||||||
|---|---|---|---|---|---|---|---|---|---|---|---|---|---|---|---|---|---|---|---|---|---|---|
| mg/m2 | mg | Day 1 | Day 5 | Day 1 | Day 5 | Plasma | Tissue | Vdss | Vd | α | β | |||||||||||
| 1 | 1.57 | 18 | 27 | 32 | 30 | 0.285 | 0.285 | 13.43 | 28.3 | 115.4 | 48.6 | 0.59 | 7.0 | |||||||||
| 2a | 1.74 | 18 | 31 | 25 | 30 | 0.199 | 0.377 | 1.51 | 28.1 | 1629.9 | 75.3 | 1.69 | 787.5 | |||||||||
| 3 | 1.62 | 18 | 29 | 38 | 30 | 0.693 | 0.856 | 4.35 | 19.8 | 59.8 | 16.1 | 0.37 | 10.7 | |||||||||
| 4 | 1.90 | 25 | 48 | 30 | 30 | 0.876 | 0.611b | 10.38 | 23.8 | 91.9 | 22.9 | 0.39 | 7.8 | |||||||||
| 5 | 1.94 | 25 | 48 | 35 | 30 | 0.509 | 0.550 | 8.30 | 5.1 | 86.4 | 46.8 | 1.99 | 10.6 | |||||||||
| 6 | 1.74 | 25 | 43 | 33 | 30 | 0.550 | --c | 5.28 | 9.9 | 88.6 | 37.0 | 1.26 | 13.9 | |||||||||
| 7 | 2.06 | 25 | 51 | 30 | 30 | 0.336 | 0.458b | 12.71 | 33.8 | 135.2 | 55.2 | 0.59 | 8.44 | |||||||||
| Mean | 9.1 | 20.1 | 96.2 | 37.8 | 0.60d | 9.24d | ||||||||||||||||
| SD | 3.8 | 10.9 | 26.0 | 15.4 | - | - | ||||||||||||||||
a Patient omitted from calculation of mean and SD
b Day 5 levels drawn on day 4
c Day 5 levels not studied
d Harmonic mean half-life
The mean central compartment volume of distribution (Vd) was 37.8 L/m2 with a mean steady-state volume of distribution (Vdss) of 96.2 L/m2. The mean tissue clearance was 20.1 L/h/m2 and the mean plasma clearance was 9.1 L/h/m2. Plasma concentrations declined bi-exponentially with a harmonic mean initial half-life (t½α) of 0.6 hours and a harmonic mean terminal half-life (t½β) of 9.2 hours. As presented in Table 5, approximately 24% of the parent compound, fludarabine phosphate, was excreted in the urine as 2F-ara-A during the 5-day treatment period.
Table 5 Urinary Excretion of 2F-ara-A
| Patient | % Dose in Urine | Creatinine Clearance | |||||||||||||
|---|---|---|---|---|---|---|---|---|---|---|---|---|---|---|---|
| Day 1 | Day 2 | Day 3 | Day 4 | Day 5 | 5-Day Average | (mL/min.) | |||||||||
| 1 | 14 | 25 | 31 | 7 | 53 | 26 | 76 | ||||||||
| 2 | 72 | 16 | 19 | 14 | 9 | 25 | 73 | ||||||||
| 3 | 28 | 29 | 29 | 24 | 7 | 24 | 37 | ||||||||
| 4 | 25 | 12 | 20 | 38 | - | 24 | 77 | ||||||||
| 5 | 20 | 20 | 14 | 20 | 13 | 17 | 59 | ||||||||
| 6 | 14 | 23 | 27 | 18 | 35 | 23 | 50 | ||||||||
| 7 | 17 | 25 | 35 | 45 | 8 | 26 | 73 | ||||||||
| Mean | 27 | 21 | 25 | 24 | 21 | 24 | 63 | ||||||||
| SD | 21 | 6 | 7 | 13 | 19 | 3 | 15 | ||||||||
Correlation of Pharmacokinetic Parameters with Clinical Parameters
As presented in …Table 6, a correlation was observed between decreasing absolute granulocyte count and the area under the concentration-time curve (AUC). The Spearman rank correlation coefficient between absolute granulocyte count and AUC was -0.94 which was statistically significant (P <0.02). The Spearman rank correlation coefficient was also calculated between absolute granulocyte count and total plasma clearance (TPC). Here the correlation coefficient was 0.94 which was also statistically significant (P <0.02). The correlation coefficient between creatinine clearance and TPC was 0.828 (0.05 <P <0.1). No correlation was observed between TPC and any of the liver function measurements.
…Table 6 Comparison of AUC with Absolute Granulocyte Nadir and Creatinine Clearance
| Patient | Dose (mg/m2 per Day X 5) | AUCa (mg.h/L) | AGCb | Creatinine Clearance (mL/min) |
|---|---|---|---|---|
| 1 | 18 | 6.4 | 3999 | 76 |
| 7 | 25 | 9.73 | 1916 | 73 |
| 4 | 25 | 12.2 | 624 | 77 |
| 5 | 25 | 14.9 | 608 | 59 |
| 6 | 25 | 23.4 | 299 | 50 |
| 3 | 18 | 20.5 | 176 | 37 |
a Days 0 - 5
b Absolute granulocyte count
Summary and Conclusions
Intravenous doses of 18 and 25 mg/m2/day for 5 days exhibited bi-exponential decay with a mean initial half-life (t½α) of 0.6 hours and a mean terminal half-life (t½β) of 9.2 hours. The mean plasma clearance was 9.1 L/h/m2 and the mean tissue clearance was 20.1 L/h/m2. The mean Vdss was 96.2 L/m2, which is approximately twice body weight, suggesting that tissue binding of the drug occurs. In addition, there was a significant inverse correlation between AUC and absolute granulocyte count (r = -0.94, P < 0.02) suggesting that myelosuppression is dose related.
Phase I-II Study of Fludarabine in Hematologic Malignancies (Study No. T83-1275) Conducted at the M.D. Anderson Cancer Center
Methods
The pharmacokinetic parameters of the fludarabine phosphate metabolite, 2F-ara-A, were determined in 19 adult patients (12 male; 7 female) who received the drug as a 30-minute intravenous infusion daily for 5 consecutive days. Ten of the patients were diagnosed as having lymphoma and 9 as having leukemia. In this study, 5 patients received doses of 20 mg/m2/day, 5 patients received doses of 25 mg/m2/day, 1 patient received 30 mg/m2/day, 4 patients received 50 mg/m2/day, 2 patients received 100 mg/m2/day, and an additional 2 patients received 125 mg/m2/day. Pharmacokinetic profiles were generally determined after the first dose of fludarabine phosphate. Plasma concentrations of 2F-ara-A and intracellular concentrations of 2F-ara-ATP were determined by HPLC. Intracellular concentrations were determined for mononuclear cells obtained from blood and bone marrow samples. The incorporation of 2F-ara-ATP into nucleic acids was determined using HPLC and liquid scintillation counting methods.
Pharmacokinetic Parameters
Plasma concentrations of fludarabine phosphate were undetectable at the times when the first samples were obtained. Of the patients receiving 20 or 25 mg/m2/day, only 2 had detectable peak 2F-ara-A concentrations (1.4 and 2.2 mcM) and, in this group of patients, 2F-ara-A levels were completely undetectable 3 hours after the completion of infusion of fludarabine phosphate.
At fludarabine phosphate dose levels of 50-125 mg/m2/day, the disappearance of 2F-ara-A was biphasic and independent of dose with a median initial half-life (t½α) of 1.41 hours and a median terminal half-life (t½β) of approximately 8 hours. Plasma pharmacokinetic parameters for patients with relapsed leukemia (N=8, patient nos. 5-12) are presented in Table 7.
Table 7 Pharmacological Characteristics for 2F-141-A in the Plasma of Patients with Relapsed Leukemia
| Patient | Fludarabine Phosphate Dose (mg/m2) | 2F-ara-A Parameters | ||||||||||
|---|---|---|---|---|---|---|---|---|---|---|---|---|
| t½aa (h) | t½bb (h) | AUCc (mcM.h) | ||||||||||
| 5 | 50 | 3.30d | 23.90 | 14 | ||||||||
| 6 | 50 | 0.49 | >24.00 | 28 | ||||||||
| 7 | 50 | 1.42 | 7.77 | 10 | ||||||||
| 8 | 50 | 1.25 | 7.76 | 16 | ||||||||
| Median | 50 | 1.34 | 7,76e | 15 | ||||||||
| 9 | 100 | 1.40 | 8.90 | 15 | ||||||||
| 10 | 100 | 1.87 | 6.88 | 37 | ||||||||
| 11 | 125 | 0.93d | 13.00 | 94 | ||||||||
| 12 | 125 | 2.20 | 6.22 | 37 | ||||||||
| Median | 112.5 | 1.64 | 7.89 | 37 | ||||||||
a Initial rate of elimination
b Terminal rate of elimination
c Area under the concentration-time curve calculated to 24 h
d As the 2-h sample was the earliest obtained, this value is based on extrapolation of the line to 30 minutes
e The median value excluding patients 5 and 6 whose elevated creatinine levels may signal impaired renal function and thus a longer t1/2β
A wide range of variation of pharmacokinetic parameters of 2F-ara-ATP in circulating leukemic cells was observed; however, when the median peak 2F-ara-ATP concentrations of 24-hour AUC values were compared at each dosage increment (20 or 25 mg/m2, 50 mg/m2, and 100 or 125 mg/m2), a clear dose-dependence emerged (Table 8). Cellular elimination was not dose-dependent, with a half-life of approximately 15 hours at all dose levels. There was a strong correlation between the 2F-ara-ATP levels in leukemic cells obtained from peripheral blood and those found in bone marrow (r = 0.84, p = 0.01), suggesting that there were no pharmacological barriers in the bone marrow. Those patients with bone marrow involvement had the highest 2F-ara-ATP levels. In addition, intracellular 2F-ara-ATP levels in circulating leukemic cells at 12 - 14 hours after fludarabine phosphate infusion were inversely related to the DNA synthetic capacity of the cells relative to pretreatment. DNA synthesis remained maximally inhibited (> 80%) until cellular concentrations of 2F-ara-ATP fell below 90 mcM.
Table 8 Pharmacological Characteristics of 2F-ara-ATP In Circulating Leukemic Cells
| Patient | Diagnosis | Fludarabine Phosphate Dose (mg/m2) | 2F-ara-ATP Parameters | ||||||||||||||
| Peak (mcM) | t1/2a (h) | AUCb (mcM.h) | |||||||||||||||
| 1 | CLLc | 20 | 42 | 13.3 | 600 | ||||||||||||
| 2 | DWDLd | 20 | 51 | 16.8 | 840 | ||||||||||||
| 3 | DLCLe | 25 | 15 | 13.7 | 220 | ||||||||||||
| 4 | NMCLf | 25 | 24 | >24.0 | 480 | ||||||||||||
| Median | 22.5 | 33 | 15.3 | 540 | |||||||||||||
| 5 | AMMLg | 50 | 58 | 10.7 | 780 | ||||||||||||
| 6 | AMLh | 50 | 47 | >24.0 | 700 | ||||||||||||
| 7 | AML | 50 | 147 | 14.1 | 2060 | ||||||||||||
| 8 | ALLi | 50 | 105 | 12.8 | 1340 | ||||||||||||
| Median | 50 | 82 | 13.5 | 1060 | |||||||||||||
| 9 | AML | 100 | 112 | >24.0 | 2560 | ||||||||||||
| 10 | CML-BCj | 100 | 1 | 6.0 | 10 | ||||||||||||
| 11 | ALL | 125 | 747 | 5.2 | 3470 | ||||||||||||
| 12 | ALL | 125 | 226 | >24.0 | 6050 | ||||||||||||
| Median | 112.5 | 169 | 15.0 | 3015 | |||||||||||||
a Elimination half-life f Nodular mixed cell lymphoma b Area under the concentration-time curves calculated to 24 h g Acute myelomonocytic leukemia c Chronic lymphocytic leukemia h Acute myeloblastic leukemia d Diffuse, well-differentiated lymphoma i Acute lymphoblastic leukemia e Diffuse, large cell lymphoma j Chronic myelogenous leukemia in blast crisis
Summary and Conclusions
Intravenous doses of 20 - 125 mg/m2/day exhibited bi-exponential decay in plasma with a median initial half-life (t½α) of 1.41 hours and a median terminal half-life (t½β) of approximately 8 hours for 2F-ara-A. The median intracellular half-life for 2F-ara-ATP was approximately 15 hours. The terminal half-lives of both 2F-ara-A and 2F-ara-ATP were not dependent on the dose of fludarabine phosphate. In addition, there was a high correlation between 2F-ara-ATP levels in circulating leukemic cells and bone marrow cells aspirated at the same time. DNA synthetic capacity of leukemic cells was inversely related to intracellular 2F-ara-ATP levels. Finally, 2F-ara-ATP levels were approximately 3 times higher in bone marrow cells from patients with bone marrow involvement than from those patients without evidence of bone marrow disease, suggesting that tumor cells may have a greater capacity to accumulate and retain nucleoside analogue triphosphates than do normal cells.
Phase I -Pharmacokinetic Study of Fludarabine (NSC-312887) (Study No. W83-328) conducted at Ohio State University
Methods
Twenty-six patients participated in this study, in which fludarabine phosphate was administered as a rapid intravenous (IV) infusion of 2 - 5 minutes duration. Seven patients received fludarabine phosphate at a dose of 260 mg/m2, 1 patient received a dose of 160 mg/m2, 8 patients received a dose of 120 mg/m2, 4 patients received 100 mg/m2, and an additional 6 patients received 80 mg/m2. Plasma concentrations of fludarabine phosphate could not be detected 5 minutes after the discontinuation of the infusion. Plasma concentrations of 2F-ara-A, the principal metabolite of fludarabine phosphate, were determined by HPLC over a time period of 0-30 hours post dosing. The plasma concentration-time data were analyzed by the NONLIN computer program and fitted a 3-compartment open model with first-order elimination from the central (blood) compartment, using the equations for rapid intravenous infusion.
Pharmacokinetic Parameters
Harmonic mean half-lives, mean residence time and total body clearance of 2F-ara-A for each of the dose levels are shown in Table 9. This metabolite exhibited a very short initial half-life (mean t½α) of 5.42 minutes, followed by an intermediate half-life (mean t½β) of 1.38 hours and a terminal half-life (mean t½γ) of 10.16 hours. In the 26 patients, the terminal half-lives ranged from 4.92 to 19.7 hours. The harmonic mean residence time (Vdss/ClT) was 10.4 hours and total body clearance (ClT) ranged from 26.5 to 120.4 mL/min/m2 with a mean of 68.98 mL/min/m2.
Table 9 2F-ara-A Harmonic Mean Half-lives, Mean Residence Time, and Total Body Clearance In Patients
| Dose (mg/m2) | No. of Patients | t1/2α (min) | t1/2β (hour) | t1/2γ (hour) | MRT (hour) | ClT (mL/min/m2) |
| 260 | 7 | 6.85 | 1.67 | 9.86 | 9.26 | 72.34 |
| 160 | 1 | 4.87 | 1.52 | 9.03 | 8.76 | 66.50 |
| 120 | 8 | 4.12 | 1.20 | 11.77 | 12.55 | 58.33 |
| 100 | 4 | 5.77 | 1.15 | 8.26 | 9.30 | 85.11 |
| 80 | 6 | 6.41 | 1.55 | 10.44 | 10.49 | 68.93 |
| Mean of all patients | 26 | 5.42 | 1.38 | 10.16 | 10.36 | 68.98 |
| C.V. (%) | - | - | - | - | - | 33.7 |
C.V.: coefficient of variation
MRT: mean residence time
Table 10 2F-ara-A Mean Volume Pharmacokinetic Parameters
| Dose (mg/m2) | No. of Patients | V1 (L/m2) | V2 (L/m2) | V3 (L/m2) | VdSS (L/m2) | Vdγ (L/m2) |
| 260 | 7 | 7.97 | 12.83 | 20.87 | 41.68 | 61.95 |
| Dose (mg/m2) | No. of Patients | V1 (L/m2) | V2 (L/m2) | V3 (L/m2) | VdSS (L/m2) | Vdγ (L/m2) |
| 160 | 1 | 6.63 | 10.15 | 18.17 | 34.96 | 52.00 |
| 120 | 8 | 6.28 | 10.79 | 26.54 | 43.61 | 60.45 |
| 100 | 4 | 7.73 | 14.14 | 27.69 | 49.55 | 64.99 |
| 80 | 6 | 7.73 | 11.98 | 26.27 | 45.97 | 65.11 |
| Mean of all patients | 26 | 7.30 | 12.11 | 24.81 | 44.22 | 62.30 |
| C.V. (%) | 31.9 | 25.1 | 40.7 | 25.7 | 28.0 |
The mean volume parameters for each dosage level are shown in Table 10. The central compartment volume of distribution was approximately 20% of body weight (V1 = 7.30 L/m2). The steady-state volume of distribution indicated significant binding of the drug to tissue components (Vdss = 44.22 L/m2). The smallest of the microscopic rate constants was k31, indicating release of the drug from the deep tissue compartment to be the rate-determining step in the elimination of 2F-ara-A from the body. Table 11 lists the microscopic rate constants for the first 9 patients studied.
Table 11 2F-ara-A Microscopic Rate Constants (N = 9)
| Patient | Dose (mg/m2) | k12 (min-1) | k21 (min-1) | k13 (min-1) | k31 (min-1) | k10 (min-1) |
| W.Y. | 260 | 0.0402 | 0.0341 | 0.00650 | 0.00333 | 0.00786 |
| R.E. | 260 | 0.0940 | 0.0418 | 0.00375 | 0.00176 | 0.01644 |
| H.W. | 260 | 0.0470 | 0.0360 | 0.00588 | 0.00268 | 0.00632 |
| E.P. | 260 | 0.0556 | 0.0379 | 0.01102 | 0.00299 | 0.00733 |
| N.R. | 120 | 0.0421 | 0.0314 | 0.00708 | 0.00204 | 0.00828 |
| M.M. | 80 | 0.0786 | 0.0301 | 0.00909 | 0.00327 | 0.01580 |
| J.B. | 80 | 0.0621 | 0.0401 | 0.00917 | 0.00289 | 0.01296 |
| R.D. | 80 | 0.0867 | 0.0414 | 0.01239 | 0.00323 | 0.00692 |
| E.K. | 80 | 0.0107 | 0.0213 | 0.00240 | 0.00160 | 0.00340 |
| Mean | 0.0574 | 0.0349 | 0.00748 | 0.00264 | 0.00948 | |
| C.V. (%) | 45.6 | 18.9 | 43.7 | 25.4 | 47.6 |
Correlation of Pharmacokinetic Parameters with Clinical Parameters
Upon completion of the pharmacokinetic studies, a multivariate correlation analysis was undertaken of all pharmacokinetic parameters with the following clinical parameters: bilirubin, serum creatinine, creatinine clearance, BUN, SGOT, SGPT, LDH, alkaline phosphatase, hemoglobin, hematocrit, baseline WBC, baseline platelets, WBC nadir, platelet nadir, WBC toxicity grade, platelet toxicity grade, nausea and vomiting grade, age and sex. Pearson correlation coefficients were substantiated by Spearman correlations. Despite the small number of patients, total body clearance correlated well with creatinine clearance and serum creatinine indicating that renal excretion is important for the elimination of the drug from the body. The volume parameters, particularly Vdss and Vdγ, correlated with creatinine clearance and serum creatinine (p ≤ 0.011). A positive correlation of CT with hemoglobin and hematocrit was observed (p ≤ 0.035) and may be due to the metabolism of 2F-ara-A in the RBC. In addition, apparent correlations of Vdγ with WBC toxicity (p = 0.025) and γ with hematocrit (p = 0.035) were observed. Table 12 and Table 13 list the correlation coefficients and p values for the above correlations.
Table 12 Correlation of 2F-ara-A Pharmacokinetic Parameters with Creatinine Clearance and Serum Creatinine
| Pharmacokinetic Parameter | Correlation Coefficient (r)a | P value | N | |
| Creatinine | ClT | 0.71 | 0.002 | 16 |
| Clearance | V3 | 0.62 | 0.011 | 16 |
| VdSS | 0.72 | 0.002 | 16 | |
| Vdγ | 0.77 | < 0.001 | 16 | |
| Serum | ClT | -0.48 | 0.013 | 26 |
| Creatinine | V1 | -0.44 | 0.025 | 26 |
| VdSS | -0.49 | 0.011 | 26 | |
| Vdγ | -0.67 | < 0.001 | 26 |
a Pearson correlation coefficients which were substantiated by Spearman correlations
Table 13 Correlation of 2F-ara-A Pharmacokinetic Parameters with Other Clinical Parameters
| Pharmacokinetic Parameter | Clinical Parameter | Correlation Coefficient (r)a | P value | N |
| ClT | BUN | -0.48 | 0.012 | 26 |
| ClT | Hgb | 0.42 | 0.035 | 26 |
| ClT | Hct | 0.46 | 0.017 | 26 |
| Vdγ | BUN | -0.39 | 0.050 | 26 |
| Vdγ | WBC tox. | -0.46 | 0.025 | 24 |
| γ | Hct | 0.41 | 0.035 | 26 |
a Pearson correlation coefficients which were substantiated by Spearman correlations
A rank ordering of the areas under the plasma concentration-time curve (AUC) for the first 9 patients enrolled in the study showed good agreement with the corresponding severity of neutropenia developed by each patient (Table 14). Thus, the capacity of the compound to depress hematopoiesis appears to be dose-related.
Table 14 Areas Under the Plasma Concentration-Time Curve and Neutropenia Grade
| Patient | Dose (mg/m2) | AUC. (mcM min x 10-3) | Neutropenia Grade |
| H.W. | 260 | 13.29 | 3 |
| E.P. | 260 | 13.19 | 3 |
| R.E. | 260 | 8.16 | 2 |
| W.Y. | 260 | 7.41 | 3 |
| N.R. | 120 | 5.58 | 0 |
| R.D. | 80 | 5.08 | 0 |
| E.K. | 80 | 4.57 | 1 |
| M.M. | 80 | 2.65 | 2 |
| J.B. | 80 | 2.54 | 0 |
11 STORAGE, STABILITY AND DISPOSAL
Fludarabine Phosphate Injection
Store Fludarabine Phosphate Injection under refrigeration between 2 °C and 8 °C (36 °F and 46 °F). Fludarabine Phosphate Injection contains no antimicrobial preservative and thus care must be taken to ensure the sterility of prepared solutions. Discard unused portion.
Parenteral drug products should be inspected visually for particulate matter and discolouration prior to administration.
Fludarabine Phosphate for Injection
Store Fludarabine Phosphate for Injection under refrigeration between 2 °C and 8 °C (36 °F and 46 °F). Fludarabine Phosphate for Injection contains no antimicrobial preservative and thus care must be taken to ensure the sterility of prepared solutions. It is recommended to discard unused solutions 8 hours after reconstitution.
Parenteral drug products should be inspected visually for particulate matter and discolouration prior to administration.
12 SPECIAL HANDLING INSTRUCTIONS
Fludarabine Phosphate Injection and Fludarabine Phosphate for Injection should not be handled by pregnant staff. Proper handling and disposal procedures should be observed, with consideration given to the guidelines used for cytotoxic drugs. Any spillage or waste material may be disposed of by incineration.
Caution should be exercised in the preparation of the Fludarabine Phosphate Injection and Fludarabine Phosphate for Injection solution. The use of latex gloves and safety glasses is recommended to avoid exposure in case of breakage of the vial or other accidental spillage. If the solution comes into contact with the skin or mucous membranes, the area should be washed thoroughly with soap and water. In the event of contact with the eyes, rinse them thoroughly with copious amounts of water. Exposure by inhalation should be avoided.
PART II: SCIENTIFIC INFORMATION
13 PHARMACEUTICAL INFORMATION
Drug Substance
| Proper name: | fludarabine phosphate | ||
|---|---|---|---|
| Chemical name: | 2-fluoro-9-(5-O-phosphono-β-D-arabinofuranosyl)-9H-purin-6-amine | ||
| Molecular Formula and molecular mass: | C10H13FN5O7P and 365.2 | ||
| Structural formula: | 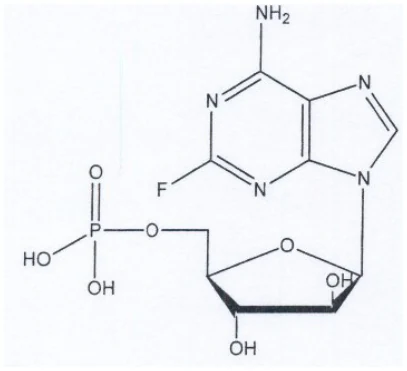 | ||
| Physico-chemical properties: | Fludarabine phosphate is a white powder. It has pKa values of 3.2 ± 0.1 and 5.8 ± 0.1 and melts with decomposition between 195 °C and 202 °C. | ||
| Product Charteristics: | pH: | 2.0 (9 mg/mL in H2O) | |
| Partition Coefficient | |||
(n-octanol/water): (flask-shaking method): | log POW = - 2.1 (pH 2) log POW = < -3.0 (pH 5) log POW = < -3.0 (pH 8) log POW = < -3.0 (pH 9) | ||
14 CLINICAL TRIALS
14.1 Trial Design and Study Demographics
Table 15 Summary of patient demographics for clinical trials in Second-line treatment in patients with chronic lymphocytic leukemia (CLL) who have failed other conventional therapies
| Study # | Study design | Dosage, route of administration and duration | Study subjects (n) | Mean age (Range) | Sex |
|---|---|---|---|---|---|
| 1 (MDACC) | single-arm open-label | 22-40 mg/m2 daily for 5 days every 28 days | 48 patients | NA | NA |
| 2 (SWOG) | single-arm open-label | 15-25 mg/m2 daily for 5 days every 28 days | 31 patients | NA | NA |
Two single-arm open-label studies of fludarabine phosphate have been conducted in patients with CLL refractory to at least 1 prior standard alkylating-agent-containing regimen. In a study conducted at M.D. Anderson Cancer Center (MDACC), 48 patients were treated with a dose of 22 - 40 mg/m2 daily for 5 days every 28 days. Another study conducted by the Southwest Oncology Group (SWOG) involved 31 patients treated with a dose of 15 - 25 mg/m2 for 5 days every 28 days.
Two open-label studies of fludarabine phosphate have been conducted in patients with CLL refractory to at least one prior standard alkylating agent-containing regimen. Overall objective response rates were 32% in one study, and 48% in the other with median time to response at 21 and 7 weeks, respectively.
14.2 Study Results
Table 16 Results of study for clinical trials in Second-line treatment in patients with chronic lymphocytic leukemia (CLL) who have failed other conventional therapies
| STUDY | MDACC | SWOG |
|---|---|---|
| Primary End Points | Results | |
| Overall objective response rate | 48% | 32% |
| Complete Response Rate | 13% | 13% |
| Partial Response Rate | 35% | 19% |
| Median Time to Response | 7 weeks (1 - 68 weeks) | 21 weeks (1 - 53 weeks) |
| Median duration of disease control | 91 weeks | 65 weeks |
| Median survival of all refractory CLL patients treated with fludarabine phosphate | 43 weeks | 52 weeks |
| Normalized lymphocyte count, one measure of disease regression, occurred at a median of 2 weeks (complete responders), 2 weeks (partial responders) and 22 weeks (nonresponders). | ||
| Rai stage improvement | 58% (to stage II or better in 7 of 12 MDACC responders) | 71% 5 of 7 SWOG responders who were stage III or IV at baseline |
| Associated value and statistical significance for Drug at specific dosages | NA |
|---|---|
| Associated value and statistical significance for Placebo or active control | NA |
The overall objective response rates were 48% and 32% in the MDACC and SWOG studies, respectively. The complete response rate in both studies was 13%; the partial response rate was 35% in the MDACC study and 19% in the SWOG study. These response rates were obtained using standardized response criteria developed by the National Cancer Institute CLL Working Group and achieved in heavily pretreated patients. The ability of fludarabine phosphate to induce a significant rate of response in refractory patients suggests minimal cross-resistance with commonly used anti-CLL agents.
The median time to response in the MDACC and SWOG studies was 7 weeks (range of 1 to 68 weeks) and 21 weeks (range of 1 to 53 weeks), respectively. The median duration of disease control was 91 weeks (MDACC) and 65 weeks (SWOG). The median survival of all refractory CLL patients treated with fludarabine phosphate was 43 weeks and 52 weeks in the MDACC and SWOG studies, respectively. Normalized lymphocyte count, one measure of disease regression, occurred at a median of 2 weeks (complete responders), 2 weeks (partial responders) and 22 weeks (non-responders).
Rai stage improved to stage II or better in 7 of 12 MDACC responders (58%) and in 5 of 7 SWOG responders (71%) who were stage III or IV at baseline. In the combined studies, mean hemoglobin concentration improved from 9.0 g/dL at baseline to 11.8 g/dL at the time of response in a subgroup of anemic patients. Similarly, average platelet count improved from 63,500/mm3 to 103,300/mm3 at the time of response in a subgroup of patients who were thrombocytopenic at baseline.
15 MICROBIOLOGY
No microbiological information is required for this drug product.
16 NON-CLINICAL TOXICOLOGY
Toxicology information from acute toxicity (Table 17 and Table 18), long-term toxicity (Table 19), mutagenicity (Table 20) and reproductive studies (Table 21) is presented in the following pages.
The results from intravenous embryotoxicity studies in rats and rabbits indicated an embryolethal and teratogenic potential of fludarabine phosphate as manifested in skeletal malformations, fetal weight loss, and post implantation loss.
In view of the small safety margin between teratogenic doses in animals and the human therapeutic dose, as well as in analogy to other antimetabolites which are assumed to interfere with the process of differentiation, the therapeutic use of fludarabine phosphate is associated with a relevant risk of teratogenic effects in humans (see section 7 WARNINGS AND PRECAUTIONS)
Table 17 Acute Toxicity Studies - Mouse
| Study Type/ Route of Administration | Animal Information | Number of Animals | Dosage (mg/kg/day) | Results |
Single-dose lethality Intravenous injection Study no. SIB 6101.2 | Mouse (CD2F1) Age: 6 - 8 weeks Wt.: 18.3 – 23.6 g | 180 (90 males, 90 females) | 0 800 967 1170 1414 1710 2068 2500 No treatment | Dose-related decrease in motor activity (reversible in survivors), tonic spasms and death. Lethal dose estimates (mg/kg) were: |
| LD10 | LD50 | LD90 | |
| M | 979.2 | 1404.2 | 2013.6 |
| F | 780.2 | 1235.6 | 1956.9 |
| M & F | 874.4 | 1321.1 | 1995.9 |
Five daily doses lethality Intravenous injection Study No. SIB 6101.3 | Mouse (CD2F1) Age: 6 - 8 weeks Wt.: 17.1 - 23.8 g | 270 (135 males, 135 females) | 0 325 412 523 664 843 1070 1358 No treatment | Dose-related decrease in motor activity (reversible in survivors) and death. Lethal dose estimates (mg/kg) were: |
| LD10 | LD50 | LD90 | |
| M | 404.6 | 593.3 | 870.0 |
| F | 355.4 | 496.8 | 694.5 |
| M & F | 372.5 | 542.7 | 790.7 |
Single-dose toxicity Intravenous injection Study No. SIB 6101.7 | Mouse (CD2F1) Age: 6 - 8 weeks Wt.: 18.6 - 23.2 g | 100 (50 males, 50 females) | Males: 0 490 a 979 b 1404 c No treatment Females: 0 390 a 780 b 1236 c No treatment | Dose-dependent effects on nervous, hematopoietic, GI, renal and male reproductive systems. LD50: lethal to males and females, with females more acutely affected than males. LD10: mildly toxic to renal and hematopoietic systems, with decreased mean relative testicular weights. ½LD10: decrease in motor activity in a few mice, decreased mean relative testicular weights. |
| Study Type/ Route of Administration | Animal Information | Number of Animals | Dosage (mg/kg/day) | Results |
Five daily doses toxicity Intravenous injection Study No. SIB 6101.4 | Mouse (CD2F1) Age: 6 - 8 weeks Wt.: 17.3 - 22.2 g | 100 (50 males, 50 females) | Males: 0 203 a 405 b 593 c No treatment Females: 0 178 a 355 b 497 c No treatment | Dose-dependent effects on hematopoietic, GI, renal and male reproductive systems. LD50: lethal to male and female mice. LD10: delayed toxicity to the testes (decreased mean relative testicular weight). ½LD10: can be considered safe in the mouse. |
a = ½LD10
b = LD10
c = LD50
Table 18 Acute Toxicity Studies – Rat and Dog
| Study Type/ Route of Administration | Animal Information | Number of Animals | Dosage (mg/kg/day) | Results |
Single-dose toxicity Intravenous injection Study No. TBT03-008 | Rat (Sprague-Dawley) Age: 8 - 11 weeks Wt.: 200 - 269 g | 24 (15 males, 9 females) | 800 1400 2000 | Dose-dependent signs of toxicity were hypoactivity, rough fur, squinted eyes, hypothermia, gross findings in lymph nodes, thymus, heart, lungs and stomach, and death. Estimated LD50 values were 910 mg/kg (males) and 1050 mg/kg (females). |
Single-dose toxicity Intravenous injection Study No. SIB 6101.5 | Dog (Beagle) Age: 8 - 10 months Wt.: 7.0 - 11.6 kg | 20 (10 males, 10 females) | 13.1 a 131.2 b 262.4 c 393.6 d 524.8 e | Dose-dependent signs of toxicity included changes in clinical status and adverse effects on the hematopoietic, gastrointestinal, renal and hepatic systems. In addition, male dogs receiving 4 x MELD10 had pancreatic and reproductive toxicity, and were sacrificed moribund. The 1/10 MELD10 and MELD10 doses were considered safe, as effects seen were minimal and readily reversible. |
| Study Type/ Route of Administration | Animal Information | Number of Animals | Dosage (mg/kg/day) | Results |
Five daily doses toxicity Intravenous injection Study Nos. SIB 6101.6 and 6101.6c | Dog (Beagle) Age: 8 - 9 months Wt.: 6.5 - 11.7 kg | 24 (12 males, 12 females) | 0 5.59 a 55.85 b 111.76 c 167.7 d 223.52 e | Dose-dependent signs of toxicity included alterations in clinical status and adverse effects on the hematopoietic, renal, gastrointestinal and hepatic systems resulting in moribund sacrifice or death by day 8 for all 4 x MELD10 animals, as well as one female at the 3 x MELD10 dose level. The 1/10 MELD10 and MELD10 dose levels were considered safe, as effects seen were minimal and readily reversible. |
MELD = Mouse Equivalent Lethal Dose
a = 1/10 MELD10
b = MELD10
c = 2 x MELD10
d = 3 x MELD10
e = 4 x MELD10
Table 19 Subchronic Studies - Intravenous 13-Week Toxicity Studies in Rats and Dogs
| Study Type/ Route of Administration | Animal Information | No. of Animals | Dosage (mg/kg/day) | Results |
13-week subchronic toxicity Intravenous Study No. TBT03-003 | Rat (Sprague-Dawley) Age: 8 - 14 weeks Wt.: 215 - 312 g | 160 (80 males, 80 females) | 0, 1, 10, 50 | There were 9 mortalities across all dose groups throughout the 13 weeks. None were attributable to the test article. At 50 mg/kg/day, toxicity was expressed as increased physical activity during dosing, increased incidence of piloerection, effects on body weights, food consumption, water consumption and clinical chemistry parameters, and decreases in red blood cell parameters. Organ weight changes included decreased absolute testes weights (males) and increased (relative to body weight) adrenal, kidney, liver and spleen weights in both sexes at this dose. There were correlated gross pathologic and histologic |
| Study Type/ Route of Administration | Animal Information | No. of Animals | Dosage (mg/kg/day) | Results | ||||
| abnormalities in most of these organs. Fludarabine phosphate given intravenously to rats for 91 consecutive days at doses of 1 and 10 mg/kg/day was well tolerated. | ||||||||
13-week subchronic toxicity Intravenous Study No. TBT03-002 | Dog (Beagle) Age: 12 - 16 months Wt.: 7.1 - 17.9 kg | 16 (8 males, 8 females) | 0, 1, 10, 50 | One male dog in the 50 mg/kg/day group died on day 42. Signs of toxicity noted in the 50 mg/kg/day group included weight loss, decreases in some red and white blood cell parameters, possible decrease in testicular weight, lymphoid depletion of the thymus and chronic inflammation of the stomach. For the male that died during the study, additional findings included hemorrhage in numerous tissues. The only test article-related change in the 10 mg/kg/day group was mild lymphoid depletion of the thymus in one male, although testicular weights may have been slightly decreased. The “no toxic effect” dose level was 10 mg/kg/day in female dogs and 1 mg/kg/day in male dogs. | ||||
Table 20 Mutagenicity Studies
| Study Type | System Used | Concentration Range | Results |
Ames mutagenesis assay Study No. TBT03-009 | Salmonella typhimurium Strains TA 98 TA 100 TA 1535 TA 1537 | Activated and non-activated assays: 0.0015; 0.005; 0.015; 0.05; 0.15; 0.5 mg/plate | Non-activated assay Fludarabine phosphate, at concentrations of 0.0015 - 0.15 mg/plate, did not increase the mean number of revertants per plate over the negative control value for each of the four strains of bacteria tested. The highest concentration tested, 0.5 mg/plate, was toxic to all strains of bacteria utilized. Activated assay At concentrations of 0.0015 to 0.15 mg/plate, the mean number of revertants per plate was not increased over the control value for any of the four strains of bacteria tested. At 0.5 mg/plate, fludarabine phosphate was toxic to one strain of bacteria (TA 1537). |
| Study Type | System Used | Concentration Range | Results |
| Fludarabine phosphate was non-mutagenic to S. typhimurium strains tested, under both activated and non-activated conditions. | |||
Sister chromatid exchange assay Study No. TBT03-010 | Chinese hamster ovary cells (CHO) | Non-activated assay: 10; 15; 30; 50; 100; 150; 300; 500 mcg/mL Activated assay: 50; 125; 250; 500; 1000; 1500; 2000; 2500 mcg/mL | Non-activated assay A significant increase in sister chromatid exchanges (SCEs) was seen in cells exposed to fludarabine phosphate at a concentration of 50 mcg/mL with higher concentrations precluded from analysis due to cellular toxicity. Concentrations of 15 and 30 mcg/mL did not cause statistically significant increases in SCEs. Activated assay Concentrations of 500 and 1000 mcg/mL caused significant increases in SCEs per cell. Concentrations of 125 and 250 mcg/mL did not increase SCEs per cell. Concentrations higher than 1000 mcg/mL were toxic to cells and thus precluded from analysis. Fludarabine phosphate has been demonstrated to cause significant increases in SCEs under both activated and non-activated assay conditions. |
CHO/HGPRT Mammalian cell mutagenesis assay Study No. TBT03-012 | Chinese hamster ovary cells (CHO) | Non-activated assay: 0.3; 1; 3; 10; 30; 100; 300; 500 mcg/mL Activated assay: 3; 10; 30; 100; 300; 1000; 1500; 2000; 2500 mcg/mL | Non-activated assay At concentrations of 1 to 300 mcg/mL, fludarabine phosphate was non-mutagenic as indicated by mean mutation frequencies not significantly different from the negative (solvent) control values. A concentration of 500 mcg/mL produced significant cellular toxicity and could not be analyzed. Activated assay Mean mutation frequencies were not significantly different from the solvent control value at fludarabine phosphate concentrations ranging from 3 to 1000 mcg/mL. Higher concentrations were not selected for analysis due to toxicity to cells. It was concluded that fludarabine phosphate was non-mutagenic under both non-activated and activated conditions in the CHO/HGPRT system. |
Chromosome aberration assay Study No. TBT03-011 | Chinese hamster ovary cells (CHO) | Non-activated assay: 2.6, 4.5, 9, 13, 26, 45, 90, 130, 260 mcg/mL Activated assay: | Non-activated assay The concentrations of fludarabine phosphate analyzed, 9, 26, and 90 mcg/mL, did not increase the percentage of aberrant cells (both excluding and including gaps). Concentrations of 130 and 260 mcg/mL were toxic to cells. |
| Study Type | System Used | Concentration Range | Results |
| 30, 50, 100, 150, 300, 500, 1000, 1500, 2000 mcg/mL | Activated assay A significant increase in the percentage of cells with chromosomal aberrations (both excluding and including gaps) were detected at concentrations of 1500 and 2000 mcg/mL. No significant increases in aberrant cells were noted at the other two concentrations analyzed, 150 and 500 mcg/mL. Fludarabine phosphate has been demonstrated to increase chromosome aberrations under activated conditions but did not increase chromosome aberrations under non-activated conditions in this assay. | ||
Mouse micronucleus test Study No. PHRR AD76 | Mouse, NMRI (SPF) | 0; 100; 300; 1000 mg/kg body weight cyclophosphamide (30 mg/kg) positive control | One day after application at the toxic dose level of 1000 mg/kg, 3/20 mice showed moderate apathy, while on day 2, 2/20 died. In the 1000 mg/kg dose group, a significant increase in the micronucleated polychromatic erythrocyte (PCE) and normochromatic erythrocyte (NCE) counts was observed at both sampling times. Additionally, in the mid-dose group, a significant increase in micronucleated PCE counts was observed 24 hours after administration. Furthermore, bone marrow depression was observed in all treatment groups at 24 hours post-administration and in the high- and mid-dose groups at 48 hours post-administration. The positive control gave the expected increase in the micronucleated cell counts. A significant decrease in the PCE/NCE ratio was also observed. |
Table 21 Reproductive Studies – Intravenous Developmental Toxicity Studies of Fludarabine Phosphate
| Study Type/ Route of Administration | Animal Information | No. of Animals | Dosage (mg/kg/day) | Results |
Range-finding developmental toxicity Intravenous injection | Rat (Sprague Dawley) Age: 12 weeks Wt.: 227 - 266 g | 30 females | 0 4 10 40 100 400 | Mortality was 100% at the 400 mg/kg/day dose level; all other animals survived to scheduled sacrifice. Signs of toxicity in the 40, 100 and 400 mg/kg/day groups included lethargy, hypothermia, changes in the feces, decreased body weight gain or |
| Study Type/ Route of Administration | Animal Information | No. of Animals | Dosage (mg/kg/day) | Results | |||
(gestation days 6 - 15) Study No. TBT03-004 | body weight loss, and decreased food consumption. Post-implantation loss was 100% and 30% at the 100 and 40 mg/kg/day dose levels respectively. Ten fetuses in two litters in the 40 mg/kg/day group had fetal malformations, which included omphalocele and various limb and tail anomalies. The 4 and 10 mg/kg/day dose levels produced no signs of maternal or developmental toxicity. The No Observable Adverse Effect Level (NOAEL) was 10 mg/kg/day. | ||||||
Developmental toxicity Intravenous injection (gestation days 6 - 15) Study No. TBT03-006 | Rat (Sprague Dawley) Age: 12 months Wt.: 208 - 299 g | 100 females | 0 1 10 30 | No treatment-related deaths occurred during the study, nor were there any clinical signs of toxicity. Mean maternal body weight gain was slightly decreased early in the dosing phase and mean fetal weight was low for the 30 mg/kg/day group. The small number of malformations seen were considered not test article-related, due to a lack of dose response; however, the 10 and 30 mg/kg/day groups showed dose-related increases in the incidence of several skeletal variations (rib and vertebrae anomalies), indicating developmental toxicity at both dose levels. A dose level of 1 mg/kg/day was considered No Observable Adverse Effect Level (NOAEL). | |||
Range-finding developmental toxicity Intravenous injection (gestation days 6 - 18) Study No. TBT03-005 | Rabbit (New Zealand White) Age: 6 months Wt.: 3.0 - 3.9 kg | 30 females | 0 1 5 10 25 50 | Mortality was 100% for the 50 and 25 mg/kg/day groups. Signs of toxicity in the 10, 25, and 50 mg/kg/day groups included ataxia, lethargy, labored respiration, changes in the feces, maternal body weight losses and decreased food consumption. The 5 mg/kg/day group also had slightly decreased food consumption early in the dosing phase. Post-implantation loss was slightly increased in the 10 mg/kg/day group. In addition, 30 of 35 fetuses in this group had external malformations, consisting primarily of | |||
| Study Type/ Route of Administration | Animal Information | No. of Animals | Dosage (mg/kg/day) | Results | ||
| craniofacial and/or limb and digit defects. The No Observable Adverse Effect Level (NOAEL) was considered to be 1 mg/kg/day. | ||||||
Developmental toxicity Intravenous injection (gestation days 6 - 18) Study No. TBT03-007 | Rabbit (New Zealand White) Age: 6 months Wt.: 3.1 - 4.2 kg | 80 females | 0 1 5 8 | Maternal survival was not affected and no clinical signs of toxicity were apparent in any group. The 5 and 8 mg/kg/day groups showed dose-related inhibition of maternal body weight gain and food consumption. Post-implantation loss was increased and mean fetal body weight was low, at the 8 mg/kg/day dose level. External and skeletal malformations, generally specific to the head, limbs, digits and tail, were increased in the 8 mg/kg/day group. In addition, diaphragmatic hernia (a soft tissue malformation) was noted at a low frequency but in a dose-related pattern (3, 1 and 1 fetuses in the 8, 5 and 1 mg/kg/day groups, respectively). The incidence of skeletal variations was also increased in a dose-related manner in the 5 and 8 mg/kg/day groups. A dose level of 1 mg/kg/day was considered the No Observable Adverse Effect Level (NOAEL) for maternal toxicity but equivocal for fetal developmental toxicity because of the appearance of a single fetus with diaphragmatic hernia at this dose level. | ||
| Study Type/ Route of Administration | Animal Information | No. of Animals | Dosage (mg/kg/day) | Results |
Reproduction Toxicity (Peri-/Postnatal Study) Intravenous injections (gestation days 15 to 21 postpartum) | Rat (Jcl:Sprague Dawley) | 96 Females | 0 1 10 40 | Following daily intravenous administration during late gestation and the lactation period, fludarabine phosphate was well tolerated at dose levels of 1 and 10 mg/kg/d with no relevant changes observed in dams or offspring. Signs of maternal toxicity (decreased body weight gain and food consumption, soft feces/diarrhea and piloerection) occurred in the 40 mg/kg/group. The offspring of the high dose group showed a decreased viability index on day 4 postpartum, a decreased weaning index and a reduced body weight gain. The skeletal maturation was delayed (reduced ossification of phalanges and vertebrae) in pups of the high dose group sacrificed on day 4 postpartum. In postnatal behavioural and learning tests, no drug related effects were observed. No relevant changes in the incidence of external and internal malformations in F2 fetuses were observed. The general toxicological no-effect dose level in this peri-/postnatal reproduction toxicity study was estimated to be 10 mg/kg/d. |
Antitumor Activity
The effects of schedule and route of administration on the antitumor activity of fludarabine phosphate were examined using an in vivo mouse leukemia model (implanted L1210 leukemia cells). The drug was active following intraperitoneal administration on all treatment schedules. Antitumor activity increased almost three fold when the number of drug treatments was increased. In addition, the administration of several doses in one day was more effective than administration of one larger dose.
A single administration (900 mg/kg) on day 1 produced an increased life span (ILS) of 42% while administration of a smaller dose (250 mg/kg) 3 times a day on day 1 (total dose 750 mg/kg) gave a 98% ILS. This pattern of increased activity with administration of several doses in a day was also observed with the intermittent treatment schedule. A single administration on each of 3 days (total dose 2010 mg/kg) produced an ILS of 122% while administration of a smaller dose 3 times a day over 3 days (total dose 1125 mg/kg) produced the greatest activity, a 525% ILS with 6 long-term survivors (50 days) among the tumor-bearing mice.
With the administration of the drug 3 times a day on day 1, negative animal weight differences (body weight change over 5 days for test animals minus that for controls) of more than 4 grams at the highest dose evaluated suggests some acute drug toxicity. Based on equivalent total doses, administration of 3 smaller doses per day at 3-hour intervals was much more effective than a single administration for each day of treatment using the in vivo mouse leukemia model.
A single oral administration of fludarabine phosphate on day 1 was not effective against the L1210 leukemia. However, when given as 5 daily oral doses, the highest nontoxic dose of the drug, defined as the dose which results in at least 7 or 8 50-day survivors among the normal mice (800 mg/kg daily on days 1 – 5), was effective in a maximal ILS of 50%.
When the drug was administered intravenous it was more effective with daily administration for 5 days than it was with a single injection on day 1. Daily treatment for 5 days at a non-toxic dose level increased the life span of tumor-bearing mice by 71% and a higher, more toxic treatment for 5 days produced an ILS of 95%; in contrast, a single intravenous treatment on day 1 produced a maximum ILS of 28%.
The intraperitoneally implanted L1210 leukemia was less sensitive to fludarabine phosphate when the drug was given either intravenously or orally compared to intraperitoneal administration. A maximal ILS value of 122% was produced following intraperitoneal administration of 266 mg/kg on days 1 - 5. This same dose given by intravenous administration on days 1 - 5 produced an ILS value of 95%. However, with both intraperitoneal and intravenous administration, the dose that produced the maximum ILS value was toxic to the non-tumored animals.
Fludarabine phosphate also demonstrated activity against the intraperitoneally implanted P388 leukemia. In two different experiments, the drug increased the life span of mice bearing the P388 leukemia by 115% and 53% following intraperitoneal administration of 200 and 100 mg/kg injections, respectively, on days 1 - 9.
Cytotoxicity of Fludarabine Phosphate
Fludarabine phosphate has demonstrated significant antitumor activity against intraperitoneally implanted murine L1210 leukemia and the human LX-1 lung tumor xenograft. The drug has shown moderate activity against the murine subcutaneously implanted CD8F1 mammary epithelioma and the intraperitoneal implanted P388 lymphocytic leukemia. Fludarabine phosphate was not active against the intraperitoneal implanted B16 melanoma, the subcutaneous implanted colon tumor or the intravenously implanted Lewis lung epithelioma, nor was it effective against the human CX 1 colon or MX-l mammary xenografts in the subrenal assay.
Effects on Bone Marrow Survival and Tumor Cell Sensitivity
Fludarabine phosphate was tested in an in vitro human bone marrow cell survival assay and tumor cell sensitivity assay. The sensitivity of normal human granulocyte-macrophage colony-forming units in culture (GM-CFUC) showed a simple negative exponential curve characterized by a logarithmic decrease in survival as a function of drug concentration. Fludarabine phosphate exhibited an LD63 of 0.51 mcg/mL for normal human granulocyte-macrophage colony-forming units in culture (GM-CFUC). In the tumor sensitivity assay, fludarabine phosphate demonstrated an LD40 and LD78 of 0.26 and 0.77 mcg/mL, respectively.
Blood and bone marrow samples obtained from patients with relapsed leukemia and lymphoma after treatment with a single dose of 20 - 125 mg/m2 of fludarabine phosphate revealed that the area under the concentration-time curves for 2F-ara-A and 2F-ara-ATP were increased in proportion to the product dose. There was a high correlation between 2F-ara-ATP levels in circulating leukemic cells and those in bone marrow cells aspirated at the same time. DNA synthetic capacity of leukemic cells was inversely related to the associated 2F-ara-ATP concentration. 2F ara-ATP concentrations were three times higher in bone marrow cells from patients with lymphomatous bone marrow involvement than from those without evidence of marrow disease.
A dose-response relationship between fludarabine phosphate concentration and inhibition of DNA synthesis in leukemia cells and bone marrow cells in culture was obtained.
Bone marrow progenitor cells from a normal subject and 10 patients with solid tumors, whose bone marrow was free of metastases, were treated with fludarabine phosphate and other cytotoxic drugs, using a bilayer soft agar culture. The in vitro effect of the drugs on bone marrow progenitor cells was not as toxic as expected relative to the myelosuppressive potency observed in vivo. In the case of fludarabine phosphate, it has been postulated that these findings might be related to incomplete in vitro phosphorylation to the triphosphate, 2F-ara-ATP.
Modulation of T-Cell Function by Fludarabine Phosphate
The effects of fludarabine phosphate on the growth and function of bone marrow and peripheral blood mononuclear cells (PBMC) from cancer patients were evaluated. Drug toxicity was dependent on time of incubation and concentration of fludarabine phosphate tested. After a 3-hour incubation of PBMC with 1 mcg/mL of fludarabine phosphate, there was no effect on cell number whereas, after 48 hours, the cell count was 59% of control, untreated cells. In contrast, a 3-hour or 48-hour incubation of PBMC with 100 mcg/mL of fludarabine phosphate reduced cell number to 65.7% or 63% of control, respectively.
Lymphocyte subpopulations of normal PBMCs were evaluated after treatment in vitro with fludarabine phosphate for 72 hours. A dose-dependent decrease in total T-cell number was noted. Incubation with 1 mcg/mL of fludarabine phosphate reduced T-cells by 16.7%; 100 mcg/mL reduced T-cells by 42%. The subset of T-cells predominantly affected was T-helper cells, reduced by 53.5% after incubation with 100 mcg/mL of fludarabine phosphate. B-cells, monocytes and natural killer cells were not reduced, but rather increased relative to control. Fludarabine phosphate also inhibited the response of PBMC to mitogens in a dose-and time-dependent manner.
In Vitro Testing of Fludarabine Phosphate in Glioma Cell Cultures
Fludarabine phosphate was tested for growth inhibitory effects on human glioma cells isolated from patient specimens. Cells were treated with 1 - 10 mcM of fludarabine phosphate beginning 4 days after cells were plated. After 3 more days of incubation, cell number was determined. Inhibition of cell growth was dose-dependent and approximately equal to inhibition seen after treatment with the same concentrations of 5-fluorouracil. Dose-dependent growth inhibition was also observed when interferon-beta (1 - 1000 IU/mL) was incubated with glioma cell cultures. Although the combination of fludarabine phosphate and 5-fluorouracil or interferon-beta produced additive inhibitory effects, no synergistic effects were observed.
Pharmacokinetics (Animals)
Fludarabine phosphate and its metabolites have been studied in mice, dogs, miniature pigs and monkeys to elucidate their pharmacokinetic, distribution and excretion profiles.
In the mouse, dog and monkey, the pharmacokinetics of fludarabine phosphate and its major metabolite, 2F-ara-A, generally exhibited bicompartmental characteristics after intravenous administration, with rapid clearance and relatively large volumes of distribution.
The pharmacokinetic parameters of fludarabine phosphate and its metabolites are presented in Table 22 and Table 23, located on the following pages.
Tissue Distribution, Metabolism and Excretion in Animals
Tissue distribution and excretion studies were conducted with fludarabine phosphate in mice, dogs and monkeys at doses between 30 and 500 mg/m2.
Fludarabine phosphate is metabolized to 2F-ara-A and, to a lesser extent, 2F-ara-HX in the mouse and monkey, while in the dog, 2F-ara-A and 2F-ara-HX are both major metabolites. The majority of the administered compound is metabolized and then eliminated in the urine within 24 hours after dose administration.
Preclinical data in rats demonstrated a transfer of fludarabine phosphate and/or metabolites through the feto-placental barrier (see 16 NON-CLINICAL TOXICOLOGY).
The metabolism, distribution and excretion information is presented in Table 23 located on the following pages.
Lactation
There is evidence from preclinical data after intravenous administration to rats that fludarabine phosphate and/or metabolites transfer from maternal blood to milk. In a peri-/postnatal developmental toxicity study, fludarabine phosphate was intravenously administered to rats during late gestation and the lactation period at dose levels of 1, 10, and 40 mg/kg/day. The offspring of the high-dose group showed a decrease in body weight gain and viability and a delay in skeletal maturation on day 4 postpartum. However, it should be taken into account that the dosing period covered also the late prenatal development.
Table 22 Pharmacokinetic Parameters of Fludarabine Phosphate and 2F-ara-A
| STUDY DETAILS | RESULTS | ||||||||
| Species | Dose of Test Article (mg/m2) | Route of Admin. | Metabolite | t1/2α | t1/2β | Vd (mL) | Clearance (mL/min) | Comments | |
Mouse (BDF1) 18 - 25 grams | 40 500 | 2F-ara-AM P 2F-ara-AM P | i.v. i.v. | 2F-ara-AMP 2F-ara-A 2F-ara-AMP 2F-ara-A | 0.7 min 31.1 min 2.5 min 35.7 min | 21.2 min 113. 9 min 26.9 min 184. 9 min | 73.4 60.6 309.1 88.0 | 2.40 0.37 7.97 0.33 | In mice, 2F-ara-AMP was rapidly dephosphorylate d to 2F-ara-A. 2F-ara-HX was also present in serum. HPLC (Waters Associates model) and TLC were used. |
Dog (Beagle) 7.8 - 10.8 kg | 40 500 | 2F-ara-AMP 2F-ara-AMP | i.v. i.v. | 2F-ara-AMP 2F-ara-A 2F-ara-HX 2F-ara-AMP | 5.3 min 15.7 min 113. 5 min | 30.5 min 96.6 min ---- | 142960. 0 9552.7 ---- 196520. 0 | 3254.0 68.5 115.5 2646.0 55.6 111.2 | In dogs, 2F-ara-AMP was rapidly dephosphorylate d to 2F-ara-A. A larger percentage of the metabolite 2F-ara-HX was |
| STUDY DETAILS | RESULTS | ||||||||
| Species | Dose of Test Article (mg/m2) | Route of Admin. | Metabolite | t1/2α | t1/2β | Vd (mL) | Clearance (mL/min) | Comments | |
2F-ara-A 2F-ara-HX | 9.2 min 4.6 min 112. 5 min | 51.5 min 90.3 min ---- | 7243.5 ---- | found in dog serum when compared to mice. HPLC (Waters Associates model) and TLC were used. | |||||
Dog (Beagle) 2 dogs | 26 0 | 2F-ara-AMP | i.v. | 2F-ara-A | 13 min | 96 min | 0.712 L/kg VdSS | 5.4 mL/min/kg | Total plasma clearance was more than 2-fold greater in dogs than in man. The steady-state volume of distribution in man is approximately 70% larger than in dogs. The terminal slope of 2F-ara-HX decay parallels the 2F-ara-A decay. Standard chromatographic and spectral assays were used. |
Monkey (3 animals) | 20 | 2F-ara-AMP | i.v. | 2F-ara-AMP (plasma) 2F-ara-A (plasma) 2F-ara-A (CSF) | 56 min 2.5 - 3.1 h 1.1 - 1.8 h | ---- 21.3 - 35.6 h 20.4 - 29.8 h | ---- ---- ---- | ---- ---- ---- | 2F-ara-A crossed the blood-brain barrier with a lag time of 0.5 to 2.0 hours and accumulated in the CSF. To quantify the metabolites, HPLC was used. |
Mouse (BDF1) 25 - 31 grams | 30 | 2F-ara-A | i.v. | 2F-ara-A Metabolite s | 17 min | 72 min | ---- ---- | ---- ---- | Standard chromatographic and spectral |
| STUDY DETAILS | RESULTS | ||||||||
| Species | Dose of Test Article (mg/m2) | Route of Admin. | Metabolite | t1/2α | t1/2β | Vd (mL) | Clearance (mL/min) | Comments | |
| 30 min | 124 min | assays were used. | |||||||
Dog (Beagle) 9.7 - 10.3 kg | 30 400 | 2F-ara-A 2F-ara-A | i.v. i.v. | 2F-ara-A 2F-ara-A | < 5 min 130 min | 112 min ---- | ---- ---- | ---- ---- | Standard chromatographic and spectral assays were used. |
Monkey (Rhesus) 3.9 - 4.6 kg | 30 400 | 2F-ara-A 2F-ara-A | i.v. i.v. | 2F-ara-A Phosphate Metabolite s 2F-ara-A | 26 min 131 min 15 min | 125 min ---- 6.7 h | ---- ---- ---- | ---- ---- ---- | 12 - 14% of 2F-ara-A became serum protein bound. |
HPLC: high performance liquid chromatography
TLC: thin layer chromatography
Table 23 Pharmacokinetic Parameters of Fludarabine Phosphate and Metabolites
| STUDY DETAILS | RESULTS | ||||||
Species/Test Model | Test Article Dose | Route of Admin. | Metabolite | t1/2 | Time to Cmax | Cmax | Comment |
Mouse (BD2F1) P388 tumor cell model | 1485 mg/k g 2F-ara-AMP | i.p. | 2F-ara-AMP 2F-ara-A 2F-ara-A 2F-ara-HX 2F-ara-HX | 1.2 h ascites fluid 2.1 h ascites fluid 3.8 h plasma 3.0 h plasma ---- | ---- 4 h (ascites) 1 - 6 h (plasma) 4 h (plasma) 4 h (ascites) | ---- ---- > 1 mM ≈ 0.4 mM ---- | After separation of nucleotides by HPLC, metabolites were quantified by UV or radioactivit y. |
Mouse (BD2F1) P388 tumor cell model | 1485 mg/k g 2F-ara-AMP | i.p. | ---- 2F-ara-ATP 2F-ATP | ---- 4.1 h (intracellula r, P388 cells) 3.7 h (intracellula | ---- 6 h (intracellula r, P388 cells) 6 h (intracellula | ---- 1036 mcM 27 mcM | After separation of nucleotides by HPLC, metabolites were |
| STUDY DETAILS | RESULTS | ||||||
Species/Test Model | Test Article Dose | Route of Admin. | Metabolite | t1/2 | Time to Cmax | Cmax | Comment |
| r, P388 cells) | r, P388 cells) | quantified by UV or radioactivit y. | |||||
| Miniature swine (5 animals) 14 - 16.5 kg | 10, 16, 25 mg/m2 2F-ara-AMP | i.p. | 2F-ara-A | ---- | 5 - 140 min (peritoneal fluid) 120 - 240 min (plasma) | 7.7 - 18 mcg/mL (peritoneal fluid) 0.15 - 0.46 mcg/ mL (plasma) | HPLC was used. |
i.p.: intraperitoneal
Cmax: maximal concentration
Table 24 Metabolism, Distribution and Excretion of Fludarabine Phosphate
| Species | Design | Compound Admin-istered | Dose (mg/m2) | Metabolism and Distribution | Elimination | Metabolites |
Mouse (BDF1) | i.v. administration | 2F-ara-AMP | 40 500 | The major metabolite was 2F-ara-A in mice. The liver, spleen and kidney were the major organs containing the metabolites. | Elimination occurred exponentially from tissue, although the rate of elimination from serum was faster. All metabolites were excreted in the urine. | 2F-ara-A 2F-ara-AMP 2F-ara-HX 2F-A Polyphosphor ylated derivatives |
| Mouse | i.v. administration | 2F-ara-AMP | 40 500 | 2F-ara-AMP underwent dephosphorylatio n to 2F-ara-A in mice. | Elimination of 2F-ara-A from tissue occurred exponentially. | Serum: 2F-ara-A 2F-ara-HX Tissue: 2F-ara-A 2F-ara-HX 2F-A 2F-ara-AMP 2F-ara-ADP 2F-ara-ATP |
| Species | Design | Compound Admin-istered | Dose (mg/m2) | Metabolism and Distribution | Elimination | Metabolites |
Mouse (BD2F1) P388 tumor cell implant model | i.p. administration | 2F-ara-AMP | 1485 (mg/kg) | Peak 2F-ara-A ascites conc. occurred at 4 h Peak 2F-ara-HX ascites conc. occurred at 4 h Peak 2F-ara-A plasma conc. (≥1mM) occurred at 1 - 6 h Peak 2F-ara-HX plasma conc. (≈ 0.4mM) occurred at 4 h | 2F-ara-A t1/2 = 2.1 h (ascites) ---- 2F-ara-A t1/2 = 3.8 h (plasma) 2F-ara-HX t1/2 = 3 h (plasma) | 2F-ara-A (ascites & plasma) 2F-ara-HX (ascites & plasma) 2F-ara-ATP (intracellular) 2F-ara-AMP (intracellular) |
Mouse (BD2F1) P388 tumor cell implant model | i.p. administration | 2F-ara-AMP | 1485 (mg/kg) | The peak concentration (1,036 mcM) of the primary intracellular metabolite, 2F-ara-ATP, was reached 6 h post drug administration in P388 cells. Peak levels of 2F-ara-ATP were reached at 4 - 6 h in bone marrow and intestinal mucosa with 2F-ara-ATP accumulated 20 times less than in P388 cells. 2F-ara-ATP has been determined the active metabolite. | 2F-ara-ATP t½ = 4.1 h (in P388 cells) 2F-ara-ATP t½ = 2 h (in host tissue) | ---- ---- |
Mouse P388 tumor cell | i.p. administration | 2F-ara-AMP | 1485 (mg/kg) | 930 mcM 2F-ara-ATP was the peak intracellular concentration observed in P388 cells. | 2F-ara-ATP disappeared from P388 cells with an intracellular half-life of 4.1 h. 2F-ara-ATP disappeared from | 2F-ara-A 2F-ara-ATP |
| Species | Design | Compound Admin-istered | Dose (mg/m2) | Metabolism and Distribution | Elimination | Metabolites | |||||
| implant model | Peak 2F-ara-ATP concentrations of 34 nmol/mcmol of DNA accumulated in bone marrow. Peak 2F-ara-ATP concentrations of 23 nmol/mcmol of DNA accumulated in the intestinal mucosa. The metabolite 2F-ara-A passed rapidly from ascites to blood in concentrations proportional to the dose. DNA synthesis was inhibited to 1% of controls at 6 h. | bone marrow and intestinal mucosa with a half-life of 1.5 h 2F-ara-A exhibited a plasma half-life of 3.5 h. | |||||||||
| Dog (Beagle) | i.v. administration | 2F-ara-AMP | 40 500 | The dog metabolized a greater % of the compound to 2F-ara-HX than the mouse. | 2F-ara-A, 2F-ara-HX, and 2F-A were all excreted in urine. | 2F-ara-A 2F-ara-HX 2F-A | |||||
| Dog (Beagle) | i.v. administration | 2F-ara-AMP | 40 500 | 2F-ara-AMP underwent dephosphorylatio n to 2F-ara-A in dogs. | ---- | 2F-ara-A | |||||
| Dog (Beagle) | i.v. administration | 2F-ara-AMP | 260 | Tissue binding of 2F-ara-A compared to plasma protein binding was substantially greater in the dog when compared to humans. | 2 F-ara-AMP was metabolized by dephosphorylation to 2F-ara-A with subsequent deamination to 2F-ara-HX. | 2F-ara-A 2F-ara-HX | |||||
| Species | Design | Compound Admin-istered | Dose (mg/m2) | Metabolism and Distribution | Elimination | Metabolites |
| Miniatu re swine | i.p. infusion | 2F-ara-AMP | 10 16 25 | Peak i.p. levels of 2F-ara-A occurred at 5 - 140 minutes. Peak serum levels of 2F-ara-A occurred 120 - 240 minutes. | ---- | 2F-ara-A |
| Monkey | i.v. administration | 2F-ara-AMP | 20 | Peak 2F-ara-A plasma levels occurred at 7 - 14 minutes. Peak 2F-ara-A CSF levels occurred at 31 - 127 minutes. 2F-ara-A crossed the blood-brain barrier accumulating in the CSF with a lag time of 0.5 - 2 h. | ---- | 2F-ara-A |
| Mouse (BDF1) | i.v. administration | 2F-ara-A | 30 | 42% of radioactivity found in the liver, 20% in the spleen, pancreas, and colon, and 15% in the lung and small intestine was a phosphorylated derivative of 2F-ara-A. | ≥ 59% of the drug was excreted in urine as 2F-ara-A at 24 h. 12% of dose was excreted as a metabolite at 24 h. | 2F-ara-AMP 2F-ara-ADP 2F-ara-ATP |
Mouse P388 tumor cell implant model | i.p. administration | 2F-ara-A | 234 (mg/kg) | 560 mcM of 2F-ara-ATP was the peak intracellular concentration observed. 2F-ara-A passed rapidly from ascites to blood in concentrations proportional to the dose. | 2F-ara-ATP disappeared with an intracellular half-life of 2.9 h. 2F-ara-A exhibited a plasma half-life of 2.2 h. | 2F-ara-ATP |
| Species | Design | Compound Admin-istered | Dose (mg/m2) | Metabolism and Distribution | Elimination | Metabolites |
| Dog (Beagle) | i.v. administration | 2F-ara-A | 30 | Dogs consistently metabolized greater portions of 2F-ara-A with higher levels detected in the serum and urine when compared to mice. | 27% of the drug was excreted unchanged in the urine at 24 h. 53% of the drug was excreted as metabolites in urine at 24 h. | ---- |
| Dog (Beagle) | i.v. administration | 2F-ara-A | 400 | Dogs consistently metabolized greater portions of 2F-ara-A with higher levels detected in the serum and urine when compared to mice. | 18% of the drug was excreted unchanged in the urine at 24 h. 70% of the drug was excreted as metabolites in the urine at 24 h. | ---- |
| Monkey (Rhesus) | i.v. administration | 2F-ara-A | 30 | ---- | 50% of the drug was excreted unchanged in 24 h. 26% of the drug was excreted as metabolites at 24 h. | ---- |
| Monkey (Rhesus) | i.v. administration | 2F-ara-A | 400 | ---- | 58% of the drug was excreted unchanged at 24 h. 25% of the drug was excreted as metabolites at 24 h. | ---- |
| Rat (Sprague Dawley) | i.v. administration | 3H-2F-ara-AMP | 60 (10 mg/ kg) | After intravenous administration of 3H-2F-ara-AMP to lactating rats, levels of radioactivity in milk was about 30% of that in maternal blood. Thus, 2F-ara-AMP and/or metabolites are | The half-life of disposition of radioactivity from blood is about 2 h. This mirrored by the estimated half-life of 3 h calculated for excretion in milk. | ---- |
| Species | Design | Compound Admin-istered | Dose (mg/m2) | Metabolism and Distribution | Elimination | Metabolites | |||
| transferred into milk. | |||||||||
| Rat (Sprague Dawley) | i.v. administration | 3H-2F-ara-AMP | 60 (10 mg/ kg) | 3H-2F-ara-AMP and/or metabolites cross the feto-placental barrier and reached levels in fetus similar to as in maternal blood. | No long-lasting retention of the 3H-labelled substances could be observed in fetus and in maternal tissues examined | ---- | |||
i.p.: intraperitoneal
i.v.: intraveneous
17 SUPPORTING PRODUCT MONOGRAPHS
- 1. PrFludara® tablets, 10 mg, submission control 268846, Product Monograph, sanofi-aventis Canada Inc. (SEP 13, 2023).