


Product Monograph - Apo-Sorafenib
Recent Major Label Changes
| 7 Warnings and Precautions - General | 2026-02 |
|---|
Table of Contents
Certain sections or subsections that are not applicable at the time of the preparation of the most recent authorized product monograph are not listed.
Recent Major Label Changes ................................................................................................... 2
Table of Contents .................................................................................................................... 2
Part 1: Healthcare Professional Information ............................................................................ 5
1 Indications ........................................................................................................................ 5
1.1 Pediatrics .................................................................................................................... 5
1.2 Geriatrics .................................................................................................................... 5
2 Contraindications ............................................................................................................. 5
3 Serious Warnings and Precautions Box ............................................................................. 6
4 Dosage and Administration .............................................................................................. 6
4.1 Dosing Considerations ................................................................................................ 6
4.2 Recommended Dose and Dosage Adjustment ........................................................... 6
4.4 Administration ............................................................................................................ 9
4.5 Missed Dose ............................................................................................................... 9
5 Overdose .......................................................................................................................... 9
6 Dosage Forms, Strengths, Composition, and Packaging .................................................. 10
7 Warnings and Precautions .............................................................................................. 10
General ................................................................................................................................ 10
Carcinogenesis and Genotoxicity ......................................................................................... 11
Cardiovascular ...................................................................................................................... 12
Endocrine and Metabolism .................................................................................................. 13
Gastrointestinal .................................................................................................................... 13
Hematologic ......................................................................................................................... 13
Hepatic/Biliary/Pancreatic ................................................................................................... 14
Immune ................................................................................................................................ 15
Monitoring and Laboratory Tests ......................................................................................... 15
Neurologic ............................................................................................................................ 15
Renal ................................................................................................................................. 16
Reproductive Health ............................................................................................................ 16
Respiratory ........................................................................................................................... 16
Skin ................................................................................................................................. 16
7.1 Special Populations ................................................................................................... 17
7.1.1 Pregnancy ................................................................................................................. 17
7.1.2 Breast-feeding .......................................................................................................... 17
7.1.3 Pediatrics .................................................................................................................. 17
7.1.4 Geriatrics .................................................................................................................. 17
8 Adverse Reactions .......................................................................................................... 17
8.1 Adverse Reaction Overview ...................................................................................... 17
8.2 Clinical Trial Adverse Reactions ................................................................................ 18
8.3 Less Common Clinical Trial Adverse Reactions ......................................................... 28
8.4 Abnormal Laboratory Findings: Hematologic, Clinical Chemistry and Other Quantitative Data ................................................................................................................................. 29
8.5 Post-Market Adverse Reactions ............................................................................... 34
9 Drug Interactions ............................................................................................................ 35
9.2 Drug Interactions Overview ...................................................................................... 35
9.3 Drug-Behavioural Interactions .................................................................................. 35
9.4 Drug-Drug Interactions ............................................................................................. 35
9.5 Drug-Food Interactions ............................................................................................. 39
9.6 Drug-Herb Interactions ............................................................................................. 39
9.7 Drug-Laboratory Test Interactions ............................................................................ 39
10 Clinical Pharmacology ..................................................................................................... 39
10.1 Mechanism of Action ................................................................................................ 39
10.2 Pharmacodynamics .................................................................................................. 39
10.3 Pharmacokinetics ..................................................................................................... 40
11 Storage, Stability, and Disposal....................................................................................... 42
Part 2: Scientific Information ................................................................................................. 43
13 Pharmaceutical Information ........................................................................................... 43
14 Clinical Trials .................................................................................................................. 43
14.1 Clinical Trials by Indication ....................................................................................... 43
14.2 Comparative Bioavailability Studies.......................................................................... 55
15 Microbiology .................................................................................................................. 56
16 Non-Clinical Toxicology ................................................................................................... 56
17 Supporting Product Monographs .................................................................................... 59
Patient Medication Information ............................................................................................ 60
Part 1: Healthcare Professional Information
1 Indications
APO-SORAFENIB (sorafenib tablets) is indicated for:
- treatment of patients with unresectable hepatocellular carcinoma (HCC)
There are limited safety data available for Child-Pugh Class B patients (see 14 Clinical Trials).
- treatment of locally advanced / metastatic Renal Cell (clear cell) Carcinoma (RCC) in patients who failed or are intolerant to prior systemic therapy.
Approval of APO-SORAFENIB for locally advanced/metastatic Renal Cell (clear cell) Carcinoma (RCC) is based on progression-free survival (PFS) in low and intermediate risk (MSKCC prognostic criteria) patients without brain metastasis. Prolongation of overall survival has not been established for sorafenib tablets in RCC. The quality of life was not significantly different in the pivotal clinical trial comparing sorafenib tablets to placebo (see 14 Clinical Trials).
- treatment of patients with locally advanced or metastatic, progressive differentiated thyroid carcinoma (DTC) refractory to radioactive iodine.
Approval of APO-SORAFENIB for DTC is based on progression-free survival (PFS). Prolongation of overall survival has not been established for sorafenib tablets in DTC (see 7 Warnings and Precautions – General and 14 Clinical Trials).
APO-SORAFENIB should be prescribed by a qualified healthcare professional who is experienced in the use of anti-neoplastic therapy.
1.1 Pediatrics
Pediatrics (< 18 years of age): No data are available to Health Canada; therefore, Health Canada has not authorized an indication for pediatric use.
1.2 Geriatrics
Geriatrics: Analyses of data by age demographics suggest that no dose adjustment is required on the basis of patient age (65 years or older). No differences in safety or efficacy were observed between older and younger patients (see 14 Clinical Trials).
2 Contraindications
APO-SORAFENIB (sorafenib tablets) is contraindicated in patients who are hypersensitive to this drug or to any ingredient in the formulation, including any non-medicinal ingredient, or component of the container. For a complete listing of ingredients, see 6 Dosage Forms, Strengths, Composition, and Packaging.
3 Serious Warnings and Precautions Box
Serious Warnings and Precautions
APO-SORAFENIB (sorafenib tablets) should be prescribed by a qualified healthcare professional who is experienced in the use of antineoplastic therapy.
Sorafenib tablets has not been studied in patients with severe hepatic impairment. The following are clinically significant adverse events:
- Hypertension (see 7 Warnings and Precautions – Cardiovascular)
- Hemorrhage (including gastrointestinal and respiratory tracts; life-threatening and fatal cases have been observed) (see 7 Warnings and Precautions – Hematologic)
- Cardiac ischemia/infarction (life-threatening and fatal cases have been observed) (see 7 Warnings and Precautions – Cardiovascular)
- Gastrointestinal perforation (life-threatening and fatal cases have been observed) (see 7 Warnings and Precautions – Gastrointestinal)
- Drug-induced hepatitis (life-threatening and fatal cases have been observed) (see 7 Warnings and Precautions – Hepatic/Biliary/Pancreatic)
4 Dosage and Administration
4.1 Dosing Considerations
- No dose adjustment is required on the basis of patient age (65 years or above), gender, or body weight.
- Based on the results from one phase II study, subjects with Child-Pugh B hepatic impairment had greater systemic exposure than those with Child-Pugh A hepatic impairment (see 10 Clinical Pharmacology - Special Populations and Conditions). Sorafenib has not been studied in patients with Child Pugh C hepatic impairment (see 10 Clinical Pharmacology).
- No dose adjustment is required in patients with mild, moderate, or severe renal impairment not requiring dialysis. Sorafenib has not been studied in patients undergoing dialysis (see 10 Clinical Pharmacology).
4.2 Recommended Dose and Dosage Adjustment
The recommended daily dose of APO-SORAFENIB (sorafenib tablets) is 400 mg (2 x 200 mg tablets) taken twice a day (equivalent to total daily dose of 800 mg) without food or with a low-fat or moderate-fat meal. Treatment should be continued until the patient is no longer clinically benefiting from therapy or until unacceptable toxicity occurs.
Health Canada has not authorized an indication for pediatric use (see 1.1 Pediatrics).
Dosage Adjustment
Dose Reduction for Hepatocellular Carcinoma and Renal Cell Carcinoma
Management of suspected adverse drug reactions may require temporary interruption and/or dose reduction of sorafenib therapy. When dose reduction is necessary during the treatment of HCC and RCC, the sorafenib dose should be reduced to 400 mg daily (see 7 Warnings and Precautions).
Specific dose modifications for skin toxicity during treatment of HCC and RCC are found in Table 1.
Table 1: Suggested Dose Modification for Skin Toxicity with HCC and RCC
| Gradea | Occurrence | APO-SORAFENIB Dose Modification |
| 1 | Any | Institute supportive measures immediately and continue APO-SORAFENIB treatment. |
| 2 | First | Institute supportive measures immediately and consider a decrease in APO-SORAFENIB dose to 400 mg daily for 28 days. If toxicity returns to grade 0 to 1 after dose reduction, increase APO-SORAFENIB to full dose after 28 days. If toxicity does not return to grade 0 to 1 despite dose reduction, interrupt APO-SORAFENIB treatment for a minimum of 7 days until toxicity has resolved to grade 0 to 1. When resuming treatment after dose interruption, resume APO-SORAFENIB at a reduced dose of 400 mg daily for 28 days. If toxicity is maintained at grade 0 to 1 at reduced dose, increase APO-SORAFENIB to full dose after 28 days. |
| Second or Third | As for first occurrence, but upon resuming APO-SORAFENIB treatment, decrease dose to 400 mg daily indefinitely. | |
| Fourth | Decision whether to discontinue APO-SORAFENIB treatment should be made based on clinical judgment and patient preference. | |
| 3 | First | Institute supportive measures immediately and interrupt APO-SORAFENIB treatment for a minimum of 7 days and until toxicity has resolved to grade 0 to 1. When resuming treatment after dose interruption, resume APO-SORAFENIB at reduced dose of 400 mg daily for 28 days. If toxicity is maintained at grade 0 to 1 at reduced dose, increase APO-SORAFENIB to full dose after 28 days. |
| Second | As for first occurrence, but upon resuming APO-SORAFENIB treatment, decrease dose to 400 mg daily indefinitely. | |
| Third | Decision whether to discontinue APO-SORAFENIB treatment should be made based on clinical judgment and patient preference. |
a Hand-foot skin reaction is graded as defined in Table 5
Dose Reduction for Differentiated Thyroid Carcinoma
Management of suspected adverse drug reactions may require temporary interruption and/or dose reduction of sorafenib therapy. When dose reduction is necessary during the treatment of differentiated thyroid carcinoma, the sorafenib dose should be reduced to 600 mg daily in divided doses (two tablets of 200 mg and one tablet of 200 mg twelve hours apart).
If additional dose reduction is necessary, sorafenib may be reduced to 400 mg daily (one tablet of 200 mg twelve hours apart [Dose Level -2]). If at Dose Level -2, additional dose reduction is necessary, the dose may be further reduced to one tablet of 200 mg once daily (Dose Level -3) (see Table 2). After improvement of non-hematological adverse reactions, the dose of sorafenib may be increased. Specific dose modifications for skin toxicity during treatment of DTC are found in Table 3.
Table 2: Suggested Dose Reduction Levels for Patients with Differentiated Thyroid Carcinoma
| Dose Level | Sorafenib Dose |
| 0 | 800 mg daily dose (400 mg twice daily, 2 tablets twice daily) |
| -1 | 600 mg daily dose (400 mg and 200 mg 12 hours apart, 2 tablets and 1 tablet 12 hours apart – either dose can come first) |
| -2 | 400 mg daily dose (200 mg twice daily, 1 tablet twice daily) |
| -3 | 200 mg daily dose (200 mg once daily, 1 tablet once daily) |
Table 3: Suggested Dose Modifications for Skin Toxicity in Patients with Differentiated Thyroid Cancer
| Gradeb | Occurrence | Sorafenib Dose Modificationa | |||
| Gradeb | Occurrence | Sorafenib Dose Modificationa | |||
| 1 | Any | Institute supportive measures immediately and continue sorafenib treatment | |||
| 2 | First | Institute supportive measures immediately and consider a decrease in sorafenib dose to 600 mg daily (400 mg and 200 mg 12 hours apart). If no improvement within 7 days, see below | |||
| No improvement within 7 days or second occurrence | Interrupt sorafenib until resolved to grade 0 to 1. When sorafenib is resumed, decrease dose by one dose level | ||||
| Third | Interrupt sorafenib until resolved to grade 0 to 1. When sorafenib is resumed, decrease dose by two dose levels | ||||
| Fourth | Discontinue sorafenib permanently | ||||
| 3 | First | Interrupt sorafenib until resolved to grade 0 to 1. When sorafenib is resumed, decrease dose by one dose level | |||
| Second | Interrupt sorafenib until resolved to grade 0 to 1. When sorafenib is resumed, decrease dose by two dose levels | ||||
| Third | Discontinue sorafenib permanently | ||||
- a For patients who require a dose reduction for Grade 2 or 3 skin toxicity, the dose of sorafenib may be increased if skin toxicity improved to Grade 0 to 1 after at least 28 days treatment on the reduced dose of sorafenib
- b Hand-foot skin reaction is graded as defined in Table 5
4.4 Administration
For oral use. To be swallowed with a glass of water.
4.5 Missed Dose
The missed dose should be taken as soon as the patient remembers. However, if it is almost time for the next dose, the missed dose should be skipped and the patient should take his/her next dose as scheduled. A double dose should not be administered to make up for forgotten individual doses.
5 Overdose
The highest dose of sorafenib studied clinically is 800 mg twice daily. The adverse reactions observed at this dose were primarily diarrhea, grade 3 hypertension, dyspnea, and dermatologic events (rash/desquamation).
There is no specific treatment for sorafenib overdose.
In the event of suspected overdose, sorafenib should be withheld and supportive care instituted. Vital signs, electrocardiograms (ECG), complete blood count (CBC) with differential and platelet count should be monitored periodically. Fluid and electrolyte status should be monitored in patients with vomiting and diarrhea. Serum lipase should be monitored in patients with abdominal pain. Administration of activated charcoal may be appropriate in some cases.
For the most recent information in the management of a suspected drug overdose, contact your regional poison control centre or Health Canada’s toll-free number, 1-844 POISON-X (1-844-764- 7669).
6 Dosage Forms, Strengths, Composition, and Packaging
Table 4: Dosage Forms, Strengths, and Composition
| Route of Administration | Dosage Form/ Strength/ Composition | Non-medicinal Ingredients |
| Oral | Film-coated tablets, 200 mg sorafenib (as 274 mg sorafenib tosylate) | Anhydrous lactose, colloidal silicon dioxide, crospovidone, ferric oxide red, hydroxypropyl cellulose, hydroxypropyl methylcellulose, magnesium stearate, polyethylene glycol and titanium dioxide. |
APO-SORAFENIB Tablets are red, round, biconvex coated tablet. Engraved “SOR” over “200” on one side, “APO” on the other side.
APO-SORAFENIB tablets 200 mg are supplied in HDPE bottles containing 120 tablets and in blisters of 60 tablets.
7 Warnings and Precautions
Please see 3 Serious Warnings and Precautions Box.
General
Differentiated Thyroid Cancer
In the DTC study, certain adverse drug reactions such as hand foot syndrome, diarrhea, alopecia, hypertension, hypocalcemia and keratoacanthoma/squamous cell carcinoma of the skin occurred at a substantially higher frequency than in the renal cell or hepatocellular cancer studies (see 7 Warnings and Precautions - Carcinogenesis and Genotoxicity, Cardiovascular and Skin).
In the DTC study, dose interruptions, dose reductions and permanent discontinuations were reported at a higher frequency in sorafenib tablets-treated patients than in placebo-treated patients (see 8 Adverse Reactions – Abnormal Hematologic and Clinical Chemistry Findings – Differentiated Thyroid Cancer). Dose modifications were reported in 86% of sorafenib tablets treated patients (dose interruption in 77% and dose reduction in 68%) while 57% of placebo treated patients reported any dose modification (dose interruption in 55% and dose reduction in 12%). Permanent discontinuations were reported in 18.8% of sorafenib tablets treated patients and 3.8% of placebo treated patients. In the sorafenib tablets-treated patients, the median time to first dose modification was 30 days (range of 0 to 596 days). The most common adverse events occurring early in the treatment were hand-foot skin reaction, rash, hypertension diarrhea and fatigue. In addition, adverse events leading to either dose interruption or dose reduction occurred at a higher frequency in the DTC study than in the RCC or HCC studies, even when adjusted for duration of exposure to sorafenib.
Sorafenib tablets may impair exogenous thyroid suppression in patients with DTC (see 8 Adverse Reactions – Abnormal Hematologic and Clinical Chemistry Findings – Differentiated Thyroid Cancer).
Mean steady-state concentration exposures (AUC) were 70% higher in patients with DTC than in patients with RCC or HCC (see 10.3 Pharmacokinetics).
Drug-Drug Interactions
Caution is recommended when administering sorafenib together with compounds that are metabolized/eliminated predominantly by the UGT1A1 and UGT1A9 pathways (eg, irinotecan) (see 9 Drug Interactions).
Caution is recommended if sorafenib has to be coadministered with docetaxel as it may result in an increase in docetaxel AUC (see 9 Drug Interactions).
Coadministration of neomycin may cause a decrease in sorafenib bioavailability (see 9 Drug Interactions and see 10 Clinical Pharmacology).
Warfarin
Infrequent bleeding events or elevations in the International Normalized Ratio (INR) have been reported in some patients taking warfarin while on sorafenib therapy (see 7 Warnings and Precautions – Monitoring and Laboratory Tests and 8 Adverse Reactions).
Wound Healing Complications
No formal studies of the effect of sorafenib on wound healing have been conducted. In patients undergoing major surgical procedures, temporary interruption of sorafenib therapy is recommended for precautionary reasons. There is limited clinical experience regarding the timing of reinitiation of therapy following major surgical intervention. Therefore, the decision to resume sorafenib therapy following a major surgical intervention should be based on clinical judgment of adequate wound healing.
Tumour Lysis Syndrome (TLS)
Cases of TLS, some fatal, have been reported in postmarketing surveillance in patients treated with sorafenib. Risk factors for TLS include high tumour burden, pre-existing chronic renal insufficiency, oliguria, dehydration, hypotension, and acidic urine. These patients should be monitored closely and treated promptly as clinically indicated; prophylactic measures should be considered if clinically indicated (see 8.5 Post-Market Adverse Reactions).
Carcinogenesis and Genotoxicity
Carcinogenicity studies have not been performed with sorafenib tablets.
Squamous cell cancer of the skin may develop in patients taking sorafenib. In the phase III DTC trial, squamous cell carcinoma of the skin was reported with a higher incidence than in the phase III HCC or RCC trials (3.4% in DTC, 0.3% in HCC and 0.2% in RCC).
Positive genotoxic effects were obtained for sorafenib in an in vitro mammalian cell assay (Chinese hamster ovary) for clastogenicity (chromosome aberrations) in the presence of metabolic activation. One intermediate in the manufacturing process, which is also present in the final drug substance (<0.15%), was positive for mutagenesis in an in vitro bacterial cell assay
(Ames test). Sorafenib was not genotoxic in the Ames test (the material contained the intermediate at 0.34%) and in an in vivo mouse micronucleus assay (see 16 Non-Clinical Toxicology).
Cardiovascular
QT Interval Prolongation
Sorafenib tablets have been shown to prolong the QT/QTc interval (see 9 Drug Interactions and 10.2 Pharmacodynamics – QT Interval Prolongation). Many drugs that cause QT/QTc prolongation are suspected to increase the risk of torsade de pointes. If sustained, torsade de pointes can progress to ventricular fibrillation and sudden cardiac death.
Particular care should be exercised when administering APO-SORAFENIB to patients who are suspected to be at an increased risk of experiencing torsade de pointes. Risk factors for torsade de pointes in the general population include, but are not limited to, the following: female gender; age 65 years or older; baseline prolongation of the QT/QTc interval; congenital long QT syndromes; family history of sudden cardiac death at <50 years; cardiac diseases; history of arrhythmias; high cumulative dose of anthracycline therapy; concomitant use of certain anti arrhythmic medicines or other medicinal products that lead to QT prolongation; electrolyte disturbances (e.g., hypokalemia); bradycardia; acute neurological events (e.g., intracranial or subarachnoid haemorrhage, stroke, intracranial trauma); nutritional deficits; diabetes mellitus; autonomic neuropathy; hepatic dysfunction.
Patients should be counselled on the nature and implications of the electrocardiogram (ECG) changes, underlying diseases and disorders that are considered to represent risk factors, demonstrated and predicted drug-drug interactions, symptoms suggestive of arrhythmia, risk management strategies, and other information relevant to the use of the drug.
Cardiac Ischemia and/or Infarction
Cardiac ischemia and/or infarction were reported as common adverse events in subjects treated with sorafenib tablets. The incidence rates were higher in sorafenib tablets-treated patients than those treated with the placebo in both RCC and HCC pivotal trials (see 8 Adverse Reactions). Patients with unstable coronary artery disease or recent myocardial infarction (within 6 months) were excluded from these studies. Temporary or permanent discontinuation of APO-SORAFENIB should be considered in patients who develop cardiac ischemia and/or infarction.
Decreased Heart Rate
In a clinical pharmacology study (n = 31), sorafenib tablets was associated with a decrease in heart rate (see 10.2 Pharmacodynamics – Hemodynamics). Caution should be observed in patients who are both bradycardic and considered to be at risk for bradyarrhythmias.
Hypertension
An increased incidence of hypertension was observed in sorafenib-treated patients. In the phase III sorafenib tablets RCC clinical trial, treatment-emergent hypertension was reported in 17% of sorafenib treated patients and in 2% of patients in the placebo group prior to the crossover event in the trial. Patients randomized to sorafenib were permitted to continue sorafenib after the crossover. In these patients the overall rate of treatment-emergent hypertension was reported as 22% (see 8 Adverse Reactions). In the phase III sorafenib tablets DTC clinical trial, treatment-emergent hypertension was reported in 41% of sorafenib-treated patients and in 12% of patients in the placebo group in the double blind period of the study. Hypertension was usually mild to moderate, occurred early in the course of treatment, and was amenable to management with standard antihypertensive therapy. In cases of severe or persistent hypertension, or hypertensive crisis despite adequate antihypertensive therapy, permanent discontinuation of sorafenib should be considered. At the beginning of therapy, blood pressure should be monitored on a weekly basis and thereafter should be monitored regularly and treated, if required, in accordance with standard medical practice (see 7 Warnings and Precautions – Monitoring and Laboratory Tests and 8 Adverse Reactions).
Serious cases of artery dissection have been reported in patients using VEGFR TKIs, including APO-SORAFENIB, with or without hypertension.
Decreased LVEF and Heart Failure
Decreased left ventricular ejection fraction (LVEF) has been reported in patients taking sorafenib tablets. Sorafenib tablets are associated with congestive heart failure in some patients (see 8 Adverse Reactions and 10.2 Pharmacodynamics – Ventricular Performance). Monitoring of LVEF at baseline and periodically during treatment should be considered.
Endocrine and Metabolism
Thyroid dysfunction has been reported in association with sorafenib use. Both hypothyroidism and hyperthyroidism may occur. Hypothyroidism has been observed more frequently (see 7 Warnings and Precautions – Monitoring and Laboratory Tests).
Sorafenib tablets may impair exogenous thyroid suppression in patients with DTC (see 8 Adverse Reactions – Abnormal Hematologic and Clinical Chemistry Findings – Differentiated Thyroid Cancer).
Gastrointestinal
Gastrointestinal Perforation
Gastrointestinal perforation is an uncommon event and has been reported in less than 1% of patients taking sorafenib tablets. In some cases, this was not associated with apparent intra-abdominal tumour. APO-SORAFENIB therapy should be discontinued in the event of gastrointestinal perforation.
Hematologic
Hemorrhage
An increase in the risk of bleeding may occur following sorafenib administration. In the phase III sorafenib tablets RCC clinical trial, bleeding, regardless of the cause, was found in 15% of sorafenib-treated patients and in 8% of patients in the placebo group. Pulmonary hemorrhages were observed in 4.7% of the placebo group and in 4.4% of the sorafenib group. Gastrointestinal hemorrhages were reported in 0.9% of the placebo group (and in 3.8% of the sorafenib-treated patients).
In the phase III sorafenib tablets HCC clinical trial, the incidence of hemorrhagic events was reported in 18.2% of sorafenib-treated patients and in 19.9% of patients in the placebo group. Pulmonary hemorrhages were observed in 4.0% of the placebo group and in 5.2 % of the sorafenib group.
Gastrointestinal hemorrhages were reported in 14.6% of the placebo group and in 11.6% of the sorafenib-treated patients. The reported incidence of hemorrhagic events assessed as drug related by the reporting investigator was 7.1% in sorafenib-treated patients and 3.6% in the placebo arm.
The incidence of severe bleeding events is uncommon. Cerebral hemorrhages have been reported in patients with RCC and HCC receiving sorafenib and placebo at similar rates. These events are uncommon.
If any bleeding event necessitates medical intervention, it is recommended that permanent discontinuation of sorafenib should be considered (see 8 Adverse Reactions).
Due to the potential risk of bleeding, tracheal, bronchial, and esophageal infiltration should be treated with localized therapy prior to administering sorafenib in patients with DTC.
Hepatic/Biliary/Pancreatic
Hepatic Insufficiency
In vitro and in vivo data indicate that sorafenib is primarily metabolized by the liver. Based on the results from one phase II study, AUC0-8 and Cmax in patients with Child-Pugh B hepatic impairment were greater than the corresponding parameters in patients with Child-Pugh A hepatic impairment. Sorafenib tablets have not been studied in patients with Child-Pugh C hepatic impairment (see 10 Clinical Pharmacology – Special Populations and Conditions). There are limited safety data available for Child-Pugh Class B patients.
Drug-Induced Hepatitis
Postmarketing cases of drug-induced hepatitis have been observed with sorafenib tablets, some of which have been life-threatening or fatal. Sorafenib-induced hepatitis is characterized by a hepatocellular pattern of liver damage with significant increases of transaminases, which is typically reversible, but may result in hepatic failure and death. Increases in bilirubin and INR may also occur. The incidence of severe drug-induced liver injury, defined as elevated transaminase levels above 20 times the upper limit of normal or transaminase elevations with significant clinical sequelae (for example, elevated INR, ascites, fatal, or transplantation), was reported in two out of 3,357 patients (0.06%) in a global monotherapy database. The typical time to onset is 10 to 90 days after start of treatment. Monitor liver function tests regularly. In case of significantly increased transaminases without alternative explanation, such as viral hepatitis or progressing underlying malignancy, discontinue APO-SORAFENIB.
Pancreatitis
In both HCC and RCC sorafenib tablets clinical trials elevated serum lipase was common in sorafenib-treated and placebo-treated groups (see 8 Adverse Reactions). The diagnosis of pancreatitis should not be made on the basis of laboratory abnormalities alone. In the RCC sorafenib tablets clinical trial, clinical evidence of pancreatitis was reported in 4 (0.9%) patients in the sorafenib group (2 grade 4; 2 grade 1 or 2) and in 1 patient (grade 2) in the placebo group prior to the crossover event in the trial. Patients randomized to sorafenib were permitted to continue sorafenib after the crossover. In these patients the overall rate of treatment-emergent pancreatitis was reported as 1.1% (5 patients – 2 grade 4 and 3 grade 1 or 2). In the HCC sorafenib tablets clinical trial, clinical pancreatitis was reported in 1 sorafenib-treated patient (see 8 Adverse Reactions).
Immune
Infections
Infection-related events (all grade), were reported more frequently in sorafenib-treated patients than in placebo-treated patients. Similarly, grade 3 to 5 infection-related events were reported more frequently in sorafenib-treated patients than in placebo-treated patients (see 8 Adverse Reactions).
Monitoring and Laboratory Tests
Complete blood counts (CBC) should be performed and phosphate, lipase, and amylase levels should be measured at the beginning of treatment and at regular intervals thereafter.
Hypokalemia, hypomagnesemia, or hypocalcemia should be corrected prior to administration of APO-SORAFENIB. The prescriber should consider baseline and periodic on-treatment electrolyte measurements and electrocardiograms with QT measurement.
At the beginning of therapy, blood pressure should be monitored on a weekly basis and thereafter should be monitored regularly and treated, if required, in accordance with standard medical practice.
Monitoring of left ventricular ejection fraction (LVEF) at baseline and periodically during treatment should be considered.
Patients taking warfarin concurrently with sorafenib should be monitored regularly for changes in prothrombin time, INR, and for clinical bleeding episodes.
Thyroid function tests monitoring is recommended at baseline and during treatment with sorafenib. When using sorafenib in differentiated thyroid carcinoma patients, monthly monitoring of TSH level is recommended as sorafenib may impair exogenous thyroid suppression (see 8 Adverse Reactions – Abnormal Hematologic and Clinical Chemistry Findings – Differentiated Thyroid Cancer).
When using sorafenib in patients with differentiated thyroid carcinoma, close monitoring of blood calcium level is recommended. In clinical trials, hypocalcemia was more frequent and more severe in patients with differentiated thyroid carcinoma, especially with a history of hypoparathyroidism, compared to patients with renal cell or hepatocellular cancer (see 8 Adverse Reactions).
Neurologic
In the RCC sorafenib tablets clinical trial, sensory neuropathy was reported in 67 (14.8%) of patients with sorafenib and 32 (7.1%) of patients receiving placebo. This event was usually considered to be mild or moderate (grade 1 or 2) and tended to occur in the first few cycles of therapy. In the DTC sorafenib tablets clinical trial, sensory neuropathy was reported in 30 (14.5%) of sorafenib patients and in 13 (6.2%) of placebo patients and usually was considered to be grade 1.
Renal
No dose adjustment is required in patients with mild, moderate, or severe renal impairment not requiring dialysis. Sorafenib has not been studied in patients undergoing dialysis (see 4 Dosage and Administration and 10 Clinical Pharmacology).
Monitoring of fluid balance and electrolytes in patients at risk of renal dysfunction is advised.
Reproductive Health
Results from animal studies indicate that sorafenib can impair male and female fertility (see 16 Non-Clinical Toxicology).
Respiratory
Postmarketing cases of interstitial lung disease-like events (including pneumonitis, radiation pneumonitis, acute respiratory distress, interstitial pneumonia, pulmonitis and lung inflammation) have been observed with sorafenib tablets, some of which have been life-threatening or fatal.
Skin
Hand-foot skin reaction (palmar-plantar erythrodysesthesia) and rash represent the most common adverse drug reactions with sorafenib. Rash and hand-foot skin reaction are usually grade 1 and 2 and generally appear during the first 12 weeks of treatment with sorafenib (for grading of hand-foot skin reaction, see Table 5). Dermatologic toxicities are generally easily managed and may include topical therapies for symptomatic relief, temporary treatment interruption and/or dose modification of sorafenib, or in severe or persistent cases, permanent discontinuation of sorafenib. In the DTC sorafenib tablets clinical trial, hand-foot skin reaction was reported with a higher frequency (all grades: 76%, grade 3: 20%) than in the RCC clinical trial (all grades: 34%, grade 3: 6%) and in the HCC clinical trial (all grades: 21%, grade 3: 8%).
Cases of toxic epidermal necrolysis have been observed after treatment with sorafenib, some of which have been life-threatening or fatal. Such events are either uncommon or less frequent than uncommon (see 8 Adverse Reactions).
Keratoacanthoma/squamous cell carcinoma of skin may occur during APO-SORAFENIB use. These conditions were reported with a higher frequency in the DTC sorafenib tablets clinical trial (11 cases or 5.3%) compared to the sorafenib tablets HCC and RCC clinical trials combined (1 case or 0.1%).
7.1 Special Populations
7.1.1 Pregnancy
There are no adequate and well-controlled studies in pregnant women using sorafenib. In animals, sorafenib has been shown to be teratogenic and embryotoxic.
Adequate contraception should be used during therapy and for at least 2 weeks after completion of therapy. Women of childbearing potential must be apprised of the potential hazard to the fetus, which includes severe malformation (teratogenicity), failure to thrive, and fetal death (embryotoxicity).
Sorafenib should not be used during pregnancy. Prescribers may only consider the use of sorafenib in pregnant women if the potential benefits justify the potential risks to the fetus (see 16 Non-Clinical Toxicology).
7.1.2 Breast-feeding
It is not known whether sorafenib is excreted in human milk. In animals, sorafenib and/or its metabolites were excreted in milk. Because many drugs are excreted in human milk and because the effects of sorafenib on infants have not been studied, women should discontinue breastfeeding during sorafenib treatment.
7.1.3 Pediatrics
Pediatrics (<18 years of age): No data are available to Health Canada; therefore, Health Canada has not authorized an indication for pediatric use.
7.1.4 Geriatrics
Analyses of data by demographics suggest that no dose adjustment is required on the basis of patient age (≥65 years of age). No differences in safety or efficacy were observed between older and younger patients.
8 Adverse Reactions
8.1 Adverse Reaction Overview
The data described in this section reflects exposure to sorafenib tablets in 955 patients who participated in placebo-controlled studies in hepatocellular carcinoma (n = 297), locally advanced/metastatic renal cell carcinoma (n = 451) or differentiated thyroid cancer (n = 207).
The most common adverse events (≥20%) which were considered to be related to sorafenib tablets in patients with HCC, RCC or DTC are diarrhea, fatigue, infection, alopecia, hand-foot skin reaction, rash/desquamation, weight loss, anorexia, nausea, abdominal pain, hypertension, and hemorrhage.
In addition, the following medically significant adverse events were reported infrequently during clinical trials of sorafenib tablets: cerebral hemorrhage, transient ischemic attack, cardiac failure, arrhythmia, and thromboembolism. For these events, the causal relationship to APO-SORAFENIB has not been established.
An increased incidence of hypertension was observed in sorafenib-treated patients. Hypertension was usually mild to moderate, occurred early in the course of treatment, and was amenable to management with standard antihypertensive therapy (see 7 Warnings and Precautions).
Hand-foot skin reaction (palmar-plantar erythrodysesthesia), fatigue, alopecia, infection and rash represent the most common adverse drug reactions with sorafenib. Rash and hand-foot skin reaction are usually grade 1 and 2 and generally appear during the first 12 weeks of treatment with sorafenib (see 7 Warnings and Precautions and 4 Dosage and Administration). The grading criteria applied to hand-foot skin reaction are described in Table 5.
| Table 5: Grading Scheme for Hand-foot Skin Reaction | |
| AE Grade | Definition |
| Grade 1 | Numbness, dysesthesia, paresthesia, tingling, painless swelling, erythema or discomfort of the hands or feet which does not disrupt the patient’s normal activities |
| Grade 2 | Painful erythema and swelling of the hands or feet and/or discomfort affecting the patient’s normal activities |
| Grade 3 | Moist desquamation, ulceration, blistering or severe pain of the hands or feet, or severe discomfort that causes the patient to be unable to work or perform activities of daily living |
8.2 Clinical Trial Adverse Reactions
Clinical trials are conducted under very specific conditions. The adverse reaction rates observed in the clinical trials; therefore, may not reflect the rates observed in practice and should not be compared to the rates in the clinical trials of another drug.
Clinical Trial Adverse Events in Hepatocellular Carcinoma (HCC)
Table 6 shows the percentage of HCC patients experiencing adverse events that were reported in at least 10% of patients and at a higher rate in the sorafenib tablets arm than the placebo arm in Study 100554. The reported adverse events are listed according to CTCAE Version 3.0.
CTCAE grade 3 adverse events were reported in 39% of patients receiving sorafenib tablets compared to 24% of patients receiving placebo. CTCAE grade 4 adverse events were reported in 6% of patients receiving sorafenib tablets compared to 8% of patients receiving placebo.
Table 6: Incidence of Adverse Events Reported in at Least 10% of Patients and at a Higher Rate in the Sorafenib tablets Arm Than the Placebo Arm – Study 100554
(HCC)
| Sorafenib tablets N = 297 | Placebo N = 302 | ||||||||||||||||||
| Sorafenib tablets N = 297 | Placebo N = 302 | ||||||||||||||||||
Adverse Eventa NCI- CTCAE v3 Category/Term | All Grades % | Grade 3 % | Grade 4 % | All Grades % | Grade 3 % | Grade 4 % | |||||||||||||
Adverse Eventa NCI- CTCAE v3 Category/Term | All Grades % | Grade 3 % | Grade 4 % | All Grades % | Grade 3 % | Grade 4 % | |||||||||||||
| Any event | 98 | 39 | 6 | 96 | 24 | 8 | |||||||||||||
| Cardiac general | |||||||||||||||||||
| Any event | 17 | 2 | <1 | 8 | 5 | 1 | |||||||||||||
| Constitutional symptoms | |||||||||||||||||||
| Any event | 62 | 13 | 1 | 57 | 15 | 3 | |||||||||||||
| Fatigue | 46 | 9 | 1 | 45 | 12 | 2 | |||||||||||||
| Weight loss | 30 | 2 | 0 | 10 | 1 | 0 | |||||||||||||
| Dermatology/skin | |||||||||||||||||||
| Any event | 52 | 10 | 0 | 32 | 1 | 0 | |||||||||||||
| Rash/desquamation | 19 | 1 | 0 | 14 | 0 | 0 | |||||||||||||
| Pruritus | 14 | <1 | 0 | 11 | <1 | 0 | |||||||||||||
| Hand-foot skin reactionb | 21 | 8 | 0 | 3 | <1 | 0 | |||||||||||||
| Dry skin | 10 | 0 | 0 | 6 | 0 | 0 | |||||||||||||
| Alopecia | 14 | 0 | 0 | 2 | 0 | 0 | |||||||||||||
| Gastrointestinal | |||||||||||||||||||
| Any event | 82 | 23 | <1 | 62 | 18 | 1 | |||||||||||||
| Diarrhea | 55 | 10 | <1 | 25 | 2 | 0 | |||||||||||||
| Anorexiac | 29 | 3 | 0 | 18 | 3 | <1 | |||||||||||||
| Nausea | 24 | 1 | 0 | 20 | 3 | 0 | |||||||||||||
| Vomiting | 15 | 2 | 0 | 11 | 2 | 0 | |||||||||||||
| Constipation | 14 | 0 | 0 | 10 | 0 | 0 | |||||||||||||
| Mucositis /stomatitis | 11 | <1 | 0 | 5 | <1 | 0 | |||||||||||||
| Hepatobiliary/pancreas | |||||||||||||||||||
| Any event | 18 | 5 | 3 | 17 | 5 | 2 | |||||||||||||
| Liver dysfunctiond | 11 | 2 | 1 | 8 | 2 | 1 | |||||||||||||
| Infection | |||||||||||||||||||
| Any event | 24 | 4 | 0 | 19 | 3 | 1 | |||||||||||||
| Musculoskeletal/soft tissue | |||||||||||||||||||
| Any event | 15 | 3 | <1 | 9 | 2 | 1 | |||||||||||||
| Pain | |||||||||||||||||||
| Any event | 60 | 16 | <1 | 54 | 12 | 2 | |||||||||||||
| Pain, abdomen | 31 | 9 | 0 | 26 | 5 | 1 | |||||||||||||
| Pulmonary upper respiratory | |||||||||||||||||||
| Any event | 27 | 4 | 0 | 18 | 3 | <1 | |||||||||||||
- a. In Study 100554 (HCC), the rate of ascites was similar in both sorafenib tablets and placebo groups.
- b. Hand-foot skin reaction is graded as defined in Table 5
- c. Grade 5 events were reported in 0.7% of sorafenib tablets-treated patients and 0% of placebo-treated patients.
- d. Grade 5 events were reported in 3.7% of sorafenib tablets-treated patients and 2.3% of placebo-treated patients.
Hypertension was reported in 9% of patients treated with sorafenib tablets and 4% of those treated with placebo. CTCAE grade 3 hypertension was reported in 4% of sorafenib tablets-treated patients and 1% of placebo-treated patients. No patients were reported with CTCAE grade 4 events in either treatment group.
Hemorrhage/bleeding was reported in 18% of sorafenib tablets-treated patients and 20% of placebo treated patients. The rates of CTCAE grade 3 and 4 bleeding were also higher in the placebo group (CTCAE grade 3 in 3% sorafenib tablets and 5% placebo and CTCAE grade 4 in 2% sorafenib tablets and 4% placebo). Bleeding from esophageal varices was reported in 2% of sorafenib tablets-treated patients and 4% of placebo-treated patients.
Cardiac ischemia/infarction was reported as an adverse event in 8 (2.7%) subjects in the sorafenib group and 4 (1.3%) subjects in the placebo group.
Renal failure was reported in 0.3% of those patients receiving sorafenib tablets and 2.6% of placebo patients.
Neurology (adverse events reported regardless of causality): Mood alteration depression was reported in 4% of those patients receiving sorafenib tablets and 2% of placebo patients. The rates of CTCAE grade 3 were <1% and 0% in sorafenib tablets and placebo, respectively. No CTCAE grade 4 was reported in either group. In the sorafenib tablets treatment group, 1 subject had a CTCAE grade 5 event (suicide). Four (1%) subjects experienced CTCAE grade 3 syncope in the sorafenib tablets treatment group. Incidence of similar events in the placebo arm was 0%.
Pulmonary/upper respiratory (adverse events reported regardless of causality):
Dyspnea was reported in 9% (grade 3: 3%) and 8% (grade 3: 2%) of patients in the sorafenib tablets and placebo treatment arms respectively.
Cough was reported in 8% (grade 3: <1%) and 5% (grade 3: 0%) of patients in the sorafenib tablets and placebo treatment arms respectively.
Pleural effusion was reported in 4% (grade 3: 1%) and 2% (grade 3: <1%) of patients in the sorafenib tablets and placebo treatment arms respectively.
Voice changes were reported in 9% (grade 3: <1%) and 1% (grade 3: 0%) of patients in the sorafenib tablets and placebo treatment arms respectively.
No patients were reported with CTCAE grade 4 events in any of the above categories in either treatment group.
Clinical Trial Adverse Events in Differentiated Thyroid Cancer
In the phase III DTC clinical trial, patients were randomized to either sorafenib tablets (n=207) or placebo (n=209) (Safety Analysis Set). Sorafenib tablets treated patients had a median overall treatment duration of 46 weeks compared to 28 weeks for placebo treated patients in the double blind period of the study. Dose modifications were reported in 86% of sorafenib tablets treated patients (dose interruption in 77% and dose reduction in 68%) while 57% of placebo treated patients reported any dose modification (dose interruption in 55% and dose reduction in 12%). In the sorafenib tablets treated patients, the median time to first dose modification was 30 days (range of 0 to 596 days).
Certain adverse drug reactions such as hand foot syndrome, diarrhea, alopecia, hypertension, hypocalcemia and keratoacanthoma/squamous cell carcinoma of skin occurred at a substantially higher frequency than in the renal cell or hepatocellular cancer studies.
Table 7 shows the percentage of thyroid cancer patients experiencing adverse events that were reported in at least 10% of patients and at a higher rate in the sorafenib tablets treated subjects than the placebo arm in the double blind phase. CTCAE Grade 3 adverse events were reported in 53% of patients receiving sorafenib tablets compared to 23% of patients receiving placebo. CTCAE Grade 4 adverse events were reported in 12% of patients receiving sorafenib tablets compared to 7% of patients receiving placebo.
Table 7: Treatment-emergent Adverse Events (≥10%) Reported in Patients Treated with Sorafenib and More Commonly than in Patients Receiving Placebo (Study 14295, Double Blind Period, Safety Analysis Set, CTCAE Version 3.0)
| Adverse Event CTCAE v3 Category/term | Sorafenib Tablets (n=207) % | Placebo (n=209) % | |||||||||||||
| Adverse Event CTCAE v3 Category/term | Sorafenib Tablets (n=207) % | Placebo (n=209) % | |||||||||||||
| Adverse Event CTCAE v3 Category/term | Sorafenib Tablets (n=207) % | Placebo (n=209) % | |||||||||||||
All grades % | Grade 3 % | Grade 4 % | All grades % | Grade 3 % | Grade 4 % | ||||||||||
All grades % | Grade 3 % | Grade 4 % | All grades % | Grade 3 % | Grade 4 % | ||||||||||
All grades % | Grade 3 % | Grade 4 % | All grades % | Grade 3 % | Grade 4 % | ||||||||||
| Cardiac general | |||||||||||||||
| Hypertension | 41 | 10 | 0 | 12 | 2 | 0 | |||||||||
| Constitutional symptoms | |||||||||||||||
| Fatigue | 50 | 5 | <1 | 25 | 1 | 0 | |||||||||
| Weight Loss | 47 | 6 | 0 | 14 | 1 | 0 | |||||||||
| Fever | 11 | 1 | <1 | 5 | 0 | 0 | |||||||||
| Dermatology/skin | |||||||||||||||
| HFSRa | 76 | 20 | 0 | 10 | 0 | 0 | |||||||||
| Alopecia | 67 | 0 | 0 | 8 | 0 | 0 | |||||||||
| Rash/Desquamation | 50 | 5 | 0 | 11 | 0 | 0 | |||||||||
| Pruritus | 21 | 1 | 0 | 11 | 0 | 0 | |||||||||
| Dry skin | 14 | <1 | 0 | 6 | 0 | 0 | |||||||||
| Gastrointestinal | |||||||||||||||
| Diarrhea | 69 | 5 | <1 | 15 | 1 | 0 | |||||||||
| Anorexia | 32 | 2 | 0 | 5 | 0 | 0 | |||||||||
| Mucositis, oral cavity | 23 | <1 | <1 | 3 | 0 | 0 | |||||||||
| Nausea | 21 | 0 | 0 | 11 | 0 | 0 | |||||||||
| Constipation | 15 | 0 | 0 | 8 | <1 | 0 | |||||||||
| Vomiting | 11 | <1 | 0 | 6 | 0 | 0 | |||||||||
| Infection | |||||||||||||||
| Infection (all) | 32 | 4 | 0 | 19 | 2 | 0 | |||||||||
| Pain | |||||||||||||||
| Pain, head/headache | 18 | 0 | 0 | 7 | 0 | 0 | |||||||||
| Pain, extremity-limb | 14 | <1 | 0 | 9 | <1 | 0 | |||||||||
| Pain, abdomen | 14 | 1 | 0 | 4 | <1 | 0 | |||||||||
| Pain, other | 11 | <1 | 0 | 8 | <1 | 0 | |||||||||
| Pain, throat/pharynx/larynx | 10 | 0 | 0 | 4 | 0 | 0 | |||||||||
| Metabolic/Laboratory | |||||||||||||||
| Hypocalcemia | 19 | 6 | 3 | 5 | <1 | 1 | |||||||||
| ALT increased | 13 | 2 | <1 | 4 | 0 | 0 | |||||||||
| AST increased | 11 | 1 | 0 | 2 | 0 | 0 | |||||||||
| Neuropathy | |||||||||||||||
| Sensory neuropathy | 14 | 1 | 0 | 6 | 0 | 0 | |||||||||
| Pulmonary/upper respiratory | |||||||||||||||
| Voice changes | 12 | <1 | 0 | 3 | 0 | 0 | |||||||||
a Hand-foot skin reaction is graded as defined in Table 5
Clinical Trial Adverse Events in Renal Cell Carcinoma (RCC)
In the pivotal study, 11213, based on the results of the planned PFS analysis, a decision was made to allow crossover of patients from the placebo arm to the sorafenib arm of the trial. The safety data from that analysis allow comparison between the placebo and sorafenib arms of the trial.
Table 8 includes all treatment-emergent adverse events that were reported in at least 10% of patients in the phase III sorafenib tablets clinical trial at the time of crossover.
Table 8: Treatment-emergent Adverse Events Reported in at Least 10% of Sorafenib Tablets-treated Patients – Study 11213
| Adverse Event NCI-CTCAE v3 Category/Term | Sorafenib Tablets N = 451 | Placebo N = 451 | ||||
| Adverse Event NCI-CTCAE v3 Category/Term | Sorafenib Tablets N = 451 | Placebo N = 451 | ||||
| All Grades% | Grade 3% | Grade 4% | All Grades% | Grade 3% | Grade 4% | |
| All Grades% | Grade 3% | Grade 4% | All Grades% | Grade 3% | Grade 4% | |
| Any event | 95 | 31 | 7 | 86 | 22 | 6 |
| Cardiovascular, general | ||||||
| Hypertension | 17 | 3 | <1 | 2 | <1 | 0 |
| Constitutional symptoms | ||||||
| Fatigue | 37 | 5 | <1 | 28 | 3 | <1 |
| Weight loss | 10 | <1 | 0 | 6 | 0 | 0 |
| Dermatology/skin | ||||||
| Rash/ desquamation | 40 | <1 | 0 | 16 | <1 | 0 |
| Hand-foot skin reactiona | 30 | 6 | 0 | 7 | 0 | 0 |
| Alopecia | 27 | <1 | 0 | 3 | 0 | 0 |
| Pruritus | 19 | <1 | 0 | 6 | 0 | 0 |
| Dry skin | 11 | 0 | 0 | 4 | 0 | 0 |
| Gastrointestinal symptoms | ||||||
| Diarrhea | 43 | 2 | 0 | 13 | <1 | 0 |
| Nausea | 23 | <1 | 0 | 19 | <1 | 0 |
| Anorexia | 16 | <1 | 0 | 13 | 1 | 0 |
| Vomiting | 16 | <1 | 0 | 12 | 1 | 0 |
| Constipation | 15 | <1 | 0 | 11 | <1 | 0 |
| Hemorrhage/bleeding | ||||||
| Hemorrhage – all sites | 15 | 2 | 0 | 8 | 1 | <1 |
| Infection | ||||||
| Any event | 23 | 4 | <1 | 15 | 2 | 0 |
| Neurology | ||||||
| Neuropathy-sensory | 13 | <1 | 0 | 6 | <1 | 0 |
| Pain | ||||||
| Pain, abdomen | 11 | 2 | 0 | 9 | 2 | 0 |
| Pain, joint | 10 | 2 | 0 | 6 | <1 | 0 |
| Pain, headache | 10 | <1 | 0 | 6 | <1 | 0 |
| Pulmonary | ||||||
| Dyspnea | 14 | 3 | <1 | 12 | 2 | <1 |
| Cough | 13 | <1 | 0 | 14 | <1 | 0 |
a Hand-foot skin reaction is graded as defined in Table 5
The incidence of treatment-emergent cardiac ischemia/infarction events was higher in the sorafenib tablets group (4.9%) compared with the placebo group (0.4%).
The rate of adverse events (including events associated with progressive disease) resulting in permanent discontinuation was similar in both the sorafenib tablets and placebo groups (10% of sorafenib tablets patients and 8% of placebo patients).
Based on the results from the interim PFS analysis, patients randomized to placebo were permitted to crossover to sorafenib tablets treatment. Patients demonstrating clinical benefit from sorafenib treatment were permitted to continue treatment after progression of disease. Follow up of these patients continued to the planned duration of the trial for final assessment of all other study endpoints, including overall survival. In the final analysis dataset of the clinical study in locally advanced / metastatic RCC, 216 subjects originally randomized to placebo had crossed over to sorafenib treatment after the PFS analysis.
Table 9 summarizes data from the final dataset for treatment-emergent adverse events reported in at least 10% of patients who were randomized to sorafenib treatment (N = 451) prior to crossover.
At the time of the postcrossover final dataset, treatment-emergent adverse events were reported in 442 (97.8%) of patients randomized to sorafenib and 212 (98.1%) of the 216 patients that crossed over from placebo to sorafenib. The incidence of grade 3 and 4 treatment-emergent adverse events was also similar in both of these 2 groups of patients. Adverse events attributed by the investigator as related to study drug were reported in 392 subjects randomized to sorafenib (86.7%) and 173 crossover subjects (80.1%). Both groups of patients, sorafenib and placebo patients that crossed over, had a median treatment duration of 40.1 weeks. The median duration of treatment of placebo subjects prior to crossover was 12 weeks. As expected, due to increased time on sorafenib therapy, more toxicities reached the 10% threshold compared to the safety profile at the time of the PFS analysis (see Table 8).
Table 9: Treatment-emergent Adverse Events From Postcrossover Final Analysis Dataset Reported in at Least 10% of sorafenib tablets-treated Patients – Study 11213
| Adverse Event NCI-CTCAE v3 Category/Term | Sorafenib Tablets N = 451 | ||
| Adverse Event NCI-CTCAE v3 Category/Term | Sorafenib Tablets N = 451 | ||
| Adverse Event NCI-CTCAE v3 Category/Term | Sorafenib Tablets N = 451 | ||
All Grades % | Grade 3 % | Grade 4 % | |
All Grades % | Grade 3 % | Grade 4 % | |
All Grades % | Grade 3 % | Grade 4 % | |
| Any Event | 98 | 36 | 11 |
| Blood/bone marrow | 18 | 4 | 2 |
| Hemoglobin | 14 | 3 | 2 |
| Cardiovascular, general | 31 | 5 | 3 |
| Hypertension | 22 | 4 | 1 |
| Constitutional symptoms | 68 | 11 | 1 |
| Fatigue | 49 | 8 | 1 |
| Weight loss | 21 | 2 | 0 |
| Fever | 12 | 0 | 0 |
| Dermatology/skin | 75 | 9 | 0 |
| Rash/desquamation | 43 | 1 | 0 |
| Hand-foot-skin reactiona | 34 | 6 | 0 |
| Alopecia | 32 | 0 | 0 |
| Pruritus | 20 | 0 | 0 |
| Dry skin | 14 | 0 | 0 |
| Gastrointestinal symptoms | 76 | 11 | 1 |
| Diarrhea | 54 | 4 | 0 |
| Nausea | 27 | 1 | 0 |
| Anorexia | 24 | 1 | 0 |
| Vomiting | 20 | 1 | 0 |
| Constipation | 18 | 1 | 0 |
| Hemorrhage/bleeding | 22 | 3 | 0 |
| Hemorrhage – all sites | 22 | 3 | 0 |
| Infection | 29 | 6 | 0 |
| Any event | 29 | 6 | 0 |
| Neurology | 37 | 7 | 2 |
| Neuropathy-sensory | 15 | 0 | 0 |
| Pain | 68 | 17 | 0 |
| Pain, abdomen | 15 | 2 | 0 |
| Pain, joint | 13 | 2 | 0 |
| Pain, headache | 12 | 1 | 0 |
| Pain, bone | 13 | 1 | 0 |
| Pain, back | 12 | 2 | 0 |
| Pain, muscle | 11 | 1 | 0 |
| Pulmonary | 44 | 8 | 2 |
| Dyspnea | 23 | 5 | 1 |
| Cough | 20 | 1 | 0 |
a Hand-foot skin reaction is graded as defined in Table 5
Adverse Drug Reactions From Multiple Clinical Trials
The following adverse drug reactions and laboratory abnormalities were reported from clinical trials of sorafenib tablets (very common 10% or greater, common 1 to less than 10%, uncommon 0.1% to less than 1%):
Table 10: Clinical Trial Adverse Drug Reactions and Laboratory Abnormalities
| Blood and Lymphatic System Disorders | Very common: lymphopenia, leucopenia. Common: neutropenia, anemia, thrombocytopenia |
| Cardiac Disorders | Common: myocardial ischemia and/or infarctiona, congestive heart failurea. |
| Ear and Labyrinth Disorders | Uncommon: tinnitus |
| Endocrine Disorders | Common: hypothyroidism |
| Gastrointestinal Disorders | Very common: constipation, diarrhea, nausea, vomiting. Common: gastro esophageal reflux, stomatitis (including dry mouth and glossodynia), dyspepsia, dysphagia, mucositis oral. Uncommon: pancreatitis, gastritis, gastrointestinal perforationsa |
| General Disorders and Administration Site Conditions | Very common: asthenia, fatigue, pain (including mouth, abdominal, bone, tumour pain and headache), fever. Common: influenza-like illness, mucosal inflammation |
| Hepatobiliary Disorders | Common: cholecystitis, cholangitis. Uncommon: increase in bilirubin, jaundice. |
| Immune System Disorders | Uncommon: hypersensitivity reactions (including skin reactions and urticaria), anaphylactic reaction |
| Infections and Infestations | Very common: infection. Common: folliculitis. |
| Investigations | Very common: increased amylase, increased lipase, weight decreased. Common: transient increase in transaminases. Uncommon: transient increase in blood alkaline phosphatase, INR abnormal, prothrombin level abnormal (Note that elevations in lipase are very common (41%); a diagnosis of pancreatitis should not be made solely on the basis of abnormal laboratory values.) |
| Metabolism and Nutrition Disorders | Very common: anorexia, hypophosphatemia. Common: hypocalcemia, hypokalemia, hyponatremia. Uncommon: dehydration |
| Musculoskeletal and Connective Tissue Disorders | Very common: arthralgia. Common: myalgia, muscle spasms |
| Nervous System Disorders | Common: dysgeusia, peripheral sensory neuropathy. Uncommon: reversible posterior leukoencephalopathya |
| Psychiatric Disorders | Common: depression |
| Renal and Urinary Disorders | Common: renal failureb, proteinuria. |
| Reproductive System and Breast Disorders | Common: erectile dysfunction. Uncommon: gynaecomastia |
| Respiratory, Thoracic and Mediastinal Disorders | Common: dysphonia, rhinorrhoea. |
| Skin and Subcutaneous Tissue Disorders | Very common: rash, alopecia, hand-foot skin reaction, pruritus, erythema, dry skin. Common: dermatitis exfoliative, acne, skin desquamation, keratoacanthoma / squamous cell cancer of the skin, hyperkeratosis. Uncommon: eczema, erythema multiforme |
| Vascular Disorders | Very common: bleeding events (hemorrhage including hematoma, epistaxis, mouth, pulmonarya and respiratory tracta, GI tracta, and uncommon cases of cerebral hemorrhagea), hypertension. Common: flushing. Uncommon: hypertensive crisisa |
- a Events may have a life-threatening or fatal outcome. Such events are either uncommon or less frequent than uncommon.
- b Including prerenal, renal and postrenal causes, and including cases of proteinuria, nephrotic syndrome and acute interstitial nephritis
8.3 Less Common Clinical Trial Adverse Reactions
The following rare (0.01% to less than 0.1%) adverse drug reactions have been reported in clinical trials with sorafenib tablets: QT Prolongation, drug induced hepatitis1 and nephrotic syndrome.
1 Life-threatening and fatal cases have been observed.
Further Information on Selected Adverse Drug Reactions
Congestive Heart Failure - in company-sponsored clinical trials congestive heart failure was reported as an adverse event in 1.9% of patients treated with sorafenib (N=2276). In study 11213 (RCC) adverse events consistent with congestive heart failure were reported in 1.7% of those treated with sorafenib and in 0.7% receiving placebo. In study 100554 (HCC), 0.99% of those treated with sorafenib and 1.1 % receiving placebo were reported with these events.
Increased Mortality Observed with sorafenib tablets Administered in Combination with Carboplatin/Paclitaxel and Gemcitabine/Cisplatin in Squamous Cell Lung Cancer – Two randomized placebo-controlled trials comparing safety and efficacy of sorafenib in combination with doublet platinum-based chemotherapies (carboplatin/paclitaxel and separately gemcitabine/cisplatin) versus the respective doublet platinum-based chemotherapies alone as first-line treatment for patients with advanced Non-Small Cell Lung Cancer (NSCLC) (not an approved indication) did not meet their primary endpoint of improved overall survival. Safety events were generally consistent with those previously reported. However, in both trials, higher mortality was observed in the subset of patients with squamous cell carcinoma of the lung treated with sorafenib and doublet platinum-based chemotherapies versus those treated with doublet platinum-based chemotherapies alone (paclitaxel/carboplatin: HR 1.81, 95% CI 1.19 to 2.74; gemcitabine/cisplatin: HR 1.22, 95% CI 0.82 to 1.80). No definitive cause was identified for the findings.
8.4 Abnormal Laboratory Findings: Hematologic, Clinical Chemistry and Other Quantitative Data
Abnormal Hematologic and Clinical Chemistry Findings – HCC
Incidence of abnormal hematologic and clinical chemistry findings reported in at least 10% of patients and at a higher rate in the sorafenib tablets arm is summarised in Table 11.
Table 11: Treatment-emergent Laboratory Abnormalities in ≥10% of Patients – Study 100554 (HCC)
Sorafenib tablets n = 297 | Placebo n = 302 | |||||||||
All Grades % | Grade 3 / 4 % | All Grades % | Grade 3 / 4 % | |||||||
| Blood and lymphatic system disorders | ||||||||||
| INR | 42 | 4 | 34 | 2 | ||||||
| Lymphopenia | 47 | 6 | 42 | 6 | ||||||
| Neutropenia | 11 | 1 | 14 | <1 | ||||||
| Hemoglobin | 59 | 3 | 64 | 3 | ||||||
| Platelets | 46 | 4 | 41 | <1 | ||||||
| Investigations | ||||||||||
| Lipase | 40 | 9 | 37 | 9 | ||||||
| Amylase | 34 | 2 | 29 | 3 | ||||||
| Hepatobiliary disorders | ||||||||||
| ALT | 69 | 3 | 68 | 8 | ||||||
| AST | 94 | 16 | 91 | 17 | ||||||
| Bilirubin | 47 | 10 | 45 | 11 | ||||||
| Hypoalbuminemia | 59 | 0 | 47 | 0 | ||||||
| Alkaline Phosphatase | 82 | 6 | 83 | 8 | ||||||
| Metabolism and nutrition disorders | ||||||||||
| Hypophosphatemia | 35 | 11 | 11 | 3 | ||||||
ALT: Alanine aminotransferase, AST: Aspartate aminotransferase, INR: International normalized ratio
Elevated lipase was observed in 40% of patients treated with sorafenib tablets compared to 37% of patients in the placebo group. CTCAE grade 3 or 4 lipase elevations occurred in 9% of patients in each group. Elevated amylase was observed in 34% of patients treated with sorafenib tablets compared to 29% of patients in the placebo group. CTCAE grade 3 or 4 amylase elevations were reported in 2% of sorafenib tablets-treated patients and 3% of placebo-treated patients. Many of the lipase and amylase elevations were transient, and in the majority of cases sorafenib tablets treatment was not interrupted. Clinical pancreatitis was reported in 1 of 297 sorafenib tablets-treated patients (CTCAE grade 2).
Hypophosphatemia was a common laboratory finding, observed in 35% of sorafenib tablets-treated patients compared to 11% of placebo patients; CTCAE grade 3 hypophosphatemia (1 to 2 mg/dL) occurred in 11% of sorafenib tablets-treated patients and 3% of patients in the placebo group; there was 1 case of CTCAE grade 4 hypophosphatemia (<1 mg/dL) reported in the placebo group. The etiology of hypophosphatemia associated with sorafenib tablets is not known.
Elevations in liver function tests were comparable between the 2 arms of the study. Elevated AST was observed in 94% of sorafenib tablets-treated patients and 91% of placebo-treated patients; CTCAE grade 3 or 4 AST elevations were reported in 16% of sorafenib tablets-treated patients and 17% of patients in the placebo group. ALT elevations were observed in 69% of sorafenib tablets-treated patients and 68% of placebo patients; CTCAE grade 3 or 4 ALT elevations were reported in 3% of sorafenib tablets-treated patients and 8% of placebo-treated patients. Elevated bilirubin was observed in 47% of sorafenib tablets-treated patients and 45% of placebo patients; CTCAE grade 3 or 4 bilirubin elevations were reported in 10% of sorafenib tablets-treated patients and 11% of placebo-treated patients. Hypoalbuminemia was observed in 59% of sorafenib tablets-treated patients and 47% of placebo patients; no CTCAE grade 3 or 4 hypoalbuminemia was observed in either group.
Alkaline phosphatase elevations were observed in 82% of sorafenib tablets-treated patients and 83% of placebo patients; CTCAE grade 3 alkaline phosphatase elevations were reported in 6% of sorafenib tablets-treated patients and 8% of placebo-treated patients; no CTCAE grade 4 alkaline phosphatase elevation was observed in either group.
INR elevations were observed in 42% of sorafenib tablets-treated patients and 34% of placebo-treated patients; CTCAE grade 3 INR elevations were reported in 4% of sorafenib tablets-treated patients and 2% of placebo patients; there was no CTCAE grade 4 INR elevation in either group.
Lymphopenia was observed in 47% of sorafenib tablets-treated patients and 42% of placebo patients; CTCAE grade 3 or 4 lymphopenia was reported in 6% of patients in each group. Neutropenia was observed in 11% of sorafenib tablets-treated patients and 14% of placebo patients; CTCAE grade 3 or 4 neutropenia was reported in 1% of patients in each group.
Anemia was observed in 59% of sorafenib tablets-treated patients and 64% of placebo patients; CTCAE grade 3 or 4 anemia was reported in 3% of patients in each group.
Thrombocytopenia was observed in 46% of sorafenib tablets-treated patients and 41% of placebo patients; CTCAE grade 3 or 4 thrombocytopenia was reported in 4% of sorafenib tablets-treated patients and less than 1% of placebo patients.
Of the hematological laboratory abnormalities outlined in Table 11 above, some were also reported as adverse events. The overall treatment-emergent hematologic event rate reported was 13% and 12% in the sorafenib and placebo treatment groups respectively. Of these adverse events, 3% (sorafenib-treated patients) and 2% (placebo-treated patients) were reported as serious treatment-emergent events.
Hypokalemia was reported in 9.5% of sorafenib treated patients compared to 5.9% of placebo patients. Most reports of hypokalemia were low grade (CTCAE Grade 1). CTCAE grade 3 hypokalemia occurred in 0.4% of sorafenib treated patients and 0.7% of patients in the placebo group. There were no reports of grade 4 hypokalemia.
Treatment-emergent decreased hemoglobin adverse events were reported in 9% and 8% of sorafenib and placebo treatment groups, respectively. Of these adverse events, the reporting investigator reported 4% (sorafenib-treated patients) and 2% (placebo-treated patients) as being drug related.
Abnormal Hematologic and Clinical Chemistry Findings – Differentiated Thyroid Cancer
In the DTC study, 99% of patients had a baseline thyroid stimulating hormone (TSH) level less than 0.5 mU/L. Elevation of TSH level above 0.5 mU/L was observed in 41% of sorafenib tablets- treated patients as compared with 15% of placebo-treated patients. For patients with impaired TSH suppression while receiving sorafenib tablets, the median maximal TSH was 1.6 mU/L and 25% had TSH levels greater than 4.6 mU/L.
Hypocalcemia was reported in 35.7% of sorafenib treated patients compared to 11.0% of placebo patients. Most reports of hypocalcemia were low grade. CTCAE grade 3 hypocalcemia occurred in 6.8% of sorafenib treated patients and 1.9% of patients in the placebo group, and CTCAE grade 4 hypocalcemia occurred in 3.4% of sorafenib treated patients and 1.0% of patients in the placebo group. Other clinically relevant laboratory abnormalities observed in Study 14295 are shown in Table 12.
Table 12: Treatment-emergent Laboratory Test Abnormalities Reported in Differentiated Thyroid Cancer Patients (Study 14295) Double Blind Period
Laboratory parameter, (in % of samples investigated) | Sorafenib Tablets N=207 | Placebo N=209 | ||||
Laboratory parameter, (in % of samples investigated) | Sorafenib Tablets N=207 | Placebo N=209 | ||||
| All Gradesa | Grade 3a | Grade 4a | All Gradesa | Grade 3a | Grade 4a | |
| All Gradesa | Grade 3a | Grade 4a | All Gradesa | Grade 3a | Grade 4a | |
| Blood and lymphatic system disorders | ||||||
| Anemia | 31 | <1 | 0 | 23 | <1 | 0 |
| Thrombocytopenia | 18 | 0 | 0 | 10 | 0 | 0 |
| Neutropenia | 20 | <1 | <1 | 12 | 0 | 0 |
| Leucopenia | 32 | 1 | 0 | 18 | 0 | 0 |
| Lymphopenia | 42 | 10 | <1 | 26 | 5 | 0 |
| Hepatobiliary disorders | ||||||
| Hypoalbuminemia | 21 | <1 | 0 | 11 | 0 | 0 |
| Bilirubin increased | 9 | 0 | 0 | 5 | 0 | 0 |
| ALT increased | 59 | 3 | 1 | 24 | 0 | 0 |
| AST increased | 54 | 1 | 1 | 15 | 0 | 0 |
| Investigations | ||||||
| Amylase increased | 13 | 2 | 1 | 6 | 0 | 1 |
| Lipase increased | 11 | 2 | 0 | 3 | <1 | 0 |
| Metabolism and nutrition disorders | ||||||
| Hypocalcemia | 36 | 7 | 3 | 11 | 2 | 1 |
| Hyponatremia | 11 | 3 | 0 | 2 | <1 | 0 |
| Hypokalemia | 18 | 2 | 0 | 2 | 0 | 0 |
| Hypophosphatemiab | 19 | 13 | 0 | 2 | 1 | 0 |
- a Common Terminology Criteria for Adverse Events (CTCAE), Version 3.0
- b The etiology of hypophosphatemia associated with sorafenib tablets is not known
Abnormal Hematologic and Clinical Chemistry Findings - RCC
Elevated lipase and amylase levels were very commonly reported. In the pivotal study in advanced RCC prior to crossover, CTCAE grade 3 or 4 lipase elevations occurred in 12% of patients in the sorafenib group compared to 7% of patients in the placebo group. CTCAE grade 3 or 4 amylase elevations were reported in 1% of patients in the sorafenib group compared to 3% of patients in the placebo group prior to crossover. Postcrossover, grade 3 or 4 lipase and amylase elevations in patients treated with sorafenib were 13% and 3%, respectively (see 7 Warnings and Precautions – Pancreatitis).
Hypophosphataemia was observed prior to crossover in 45% of sorafenib tablets-treated patients compared to 11% of placebo patients. Postcrossover, hypophosphatemia was observed in 50% of sorafenib-treated patients in which grade 3 hypophosphatemia (0.3 to 0.6 mmol/L) occurred in 19% of sorafenib-treated patients. There were no cases of grade 4 hypophosphatemia (<0.3 mmol/L) reported.
Hypokalemia was reported in 5.4% of sorafenib treated patients compared to 0.7% of placebo patients. Most reports of hypokalemia were low grade (CTCAE Grade 1). CTCAE grade 3 hypokalemia occurred in 1.1% of sorafenib treated patients and 0.2% of patients in the placebo group. There were no reports of grade 4 hypokalemia.
Grade 3 or 4 events were reported for lymphopenia in 13% of sorafenib-treated patients and 7% of placebo patients, for neutropenia in 5% of sorafenib-treated patients and 2% of placebo patients, for anaemia in 2% of sorafenib-treated patients and 4% of placebo patients and for thrombocytopenia in 1% of sorafenib-treated patients and 0% of placebo patients.
Table 13: Treatment-emergent Laboratory Abnormalities Reported in at Least 10% of Patients – Study 11213
| Time of Analysis: | Prior to Crossover | Postcrossover | ||||
| Time of Analysis: | Prior to Crossover | Postcrossover | ||||
| Sorafenib n = 451 | Placebo n = 451 | Sorafenib n = 451 | ||||
| Sorafenib n = 451 | Placebo n = 451 | Sorafenib n = 451 | ||||
| All Grades (%) | Grade 3 and 4 (%) | All Grades (%) | Grade 3 and 4 (%) | All Grades (%) | Grade 3 and 4 (%) | |
| All Grades (%) | Grade 3 and 4 (%) | All Grades (%) | Grade 3 and 4 (%) | All Grades (%) | Grade 3 and 4 (%) | |
| Blood and lymphatic system disorders | ||||||
| Lymphopenia | 23 | 13 | 13 | 7 | 27 | 14 |
| Leukocytes | 25 | 3a | 14 | <1 | 28 | 3a |
| Neutropenia | 18 | 5 | 10 | 2 | 19 | 5 |
| Hemoglobin | 44 | 2 | 49 | 3 | 51 | 5 |
| Platelets | 11 | 1 | 5 | 0 | 13 | 1 |
| INR | 23 | 5a | 22 | 7 | 22 | 1a |
| Hepatobiliary disorders | ||||||
| Hypoalbuminemia | 27 | <1a | 24 | <1a | 35 | 1a |
| Alkaline Phosphatase | 30 | <1a | 22 | 1a | 38 | 1a |
| ALT | 30 | <1a | 22 | <1a | 35 | <1a |
| AST | 26 | <1a | 15 | <1a | 32 | <1a |
| Bilirubin | 8 | <1 | 7 | <1 | 10 | 1 |
| Investigations | ||||||
| Amylase | 30 | 1a | 23 | 3 | 33 | 3 |
| Lipase | 41 | 12 | 30 | 7 | 43 | 13 |
| Creatinine | 17 | 0 | 18 | <1 | 19 | <1a |
| Hyperglycemiab | 72 | 3 | 70 | 5 | 76 | 4 |
| Metabolism and nutrition disorders | ||||||
| Hypophosphatemia | 45 | 13a | 11 | 3a | 50 | 19a |
| Hyponatremia | 35 | 6 | 38 | 5a | 41 | 7 |
| Hypocalcemia | 12 | 2 | 8 | <1 | 18 | 3 |
| Hyperkalemia | 15 | 5 | 11 | 3 | 19 | 7 |
- a No Grade 4 events were reported
- b Plasma collection was random for glucose test
8.5 Post-Market Adverse Reactions
The following adverse drug reactions have been identified during post-approval of sorafenib tablets. Because these reactions are reported voluntarily from a population of uncertain size, it is not always possible to reliably estimate their frequency or establish a causal relationship to drug exposure.
Blood and Lymphatic Disorders: Artery dissection and artery aneurysm (including rupture) have been reported in association with the use VEGFR TKIs, including sorafenib tablets. Thrombotic microangiopathy.
Cardiac Disorders: cardiac failure2
Endocrine Disorders: hyperthyroidism
Immune System Disorders: angioedema
Metabolism and Nutrition Disorders: Tumour lysis syndrome (including fatal cases)
Musculoskeletal and Connective Tissue Disorders: rhabdomyolysis
Respiratory, Thoracic, and Mediastinal Disorders: interstitial lung disease-like events2 (includes reports of pneumonitis, radiation pneumonitis, acute respiratory distress, interstitial pneumonia, pulmonitis and lung inflammation)
2 Life-threatening and fatal cases have been observed.
Skin and Subcutaneous Tissue Disorders: Stevens-Johnson syndrome, radiation recall dermatitis, leukocytoclastic vasculitis, toxic epidermal necrolysis2
9 Drug Interactions
9.2 Drug Interactions Overview
Sorafenib is metabolized primarily in the liver undergoing oxidative metabolism mediated by CYP3A4 as well as glucuronidation mediated by UGT1A9.
Other QT/QTc Prolonging Drugs
The concomitant use of APO-SORAFENIB with another QT/QTc-prolonging drug should be avoided to the extent possible. Drugs that have been associated with QT/QTc interval prolongation and/or torsade de pointes include, but are not limited to, the examples in the following list (Chemical/pharmacological classes are listed if some class members have been implicated in QT/QTc prolongation and/or torsade de pointes): Class IA antiarrhythmics, Class III antiarrhythmics, Class 1C antiarrhythmics, anthracyclines (including a history of prior treatment), tyrosine kinase inhibitors, histone deacetylase inhibitors, antipsychotics, antidepressants, opioids, macrolide antibiotics, quinolone antibiotics, antimalarials, azole antifungals, domperidone, 5-HT3 receptor antagonists, beta-2 adrenoceptor agonists.
The use of APO-SORAFENIB is discouraged with drugs that can disrupt electrolyte levels, including, but not limited to, the following: loop, thiazide, and related diuretics; laxatives and enemas; amphotericin B; high dose corticosteroids.
The above lists of potentially interacting drugs are not comprehensive. Current information sources should be consulted for newly approved drugs that prolong the QT/QTc interval or cause electrolyte disturbances, as well as for older drugs for which these effects have recently been established (see 7 Warnings and Precautions – Cardiovascular and 10.2 Pharmacodynamics – QT Interval Prolongation).
9.3 Drug-Behavioural Interactions
The interaction of sorafenib tablets with individual behavioural risks (e.g. cigarette smoking, cannabis use, and/or alcohol consumption) has not been studied. Sorafenib effect on driving or operating machinery have not been established.
9.4 Drug-Drug Interactions
The drugs listed in Table 14 are based on either drug interaction case reports or studies, or potential interactions due to the expected magnitude and seriousness of the interaction (i.e., those identified as contraindicated).
Table 14: Established or Potential Drug-Drug Interactions
| Proper / Common Name | Source of Evidence | Effect | Clinical Comment | ||
|---|---|---|---|---|---|
| Proper / Common Name | Source of Evidence | Effect | Clinical Comment | ||
| Warfarin | CT | The possible effect of sorafenib on warfarin, a CYP2C9 substrate, was assessed in sorafenib treated patients compared to placebo-treated patients. The concomitant treatment with sorafenib and warfarin did not result in changes in mean PT-INR compared to placebo. | Patients taking warfarin should have their INR checked regularly (see 7 Warnings and Precautions and 10 Clinical Pharmacology). | ||
| Docetaxel | CT | Docetaxel (75 or 100 mg/m2 administered once every 21 days) when coadministered with sorafenib (200 mg twice daily or 400 mg twice daily administered on Day 2 through 19 of a 21 day cycle), with a 3-day break in dosing around administration of docetaxel, resulted in a 36% 80% increase in docetaxel AUC and a 16%-32% increase in docetaxel Cmax. | Caution is recommended when sorafenib is coadministered with docetaxel (see 7 Warnings and Precautions). | ||
| Irinotecan | I | In vitro data show that sorafenib inhibits glucuronidation by the UGT1A1 (Ki = 1 mcM) and UGT1A9 (Ki = 2 mcM) pathways. Concomitant administration of sorafenib with irinotecan, whose active metabolite SN-38 is further metabolized by the UGT1A1 pathway, resulted in a 67% to 120% increase in the AUC of SN-38. Systemic exposure to substrates of UGT1A1 and UGT1A9 may be increased when coadministered with sorafenib. | Caution is recommended when administering sorafenib together with compounds that are metabolized/eliminated predominantly by the UGT1A1 and UGT1A9 pathways (eg, irinotecan) (see 7 Warnings and Precautions) | ||
| Neomycin | CT | Coadministration of neomycin, a nonsystemic antimicrobial agent used to eradicate GI flora, interferes with the enterohepatic recycling of sorafenib (see 10.3 | Coadministration of neomycin may cause a decrease in sorafenib bioavailability (see 7 Warnings and Precautions) | ||
| Pharmacokinetics– Metabolism and Elimination), resulting in decreased sorafenib exposure. In healthy volunteers treated with a 5-day regimen of neomycin, the average bioavailability of sorafenib decreased by 54%. The clinical significance of these findings is unknown. Effects of other antibiotics have not been studied, but will likely depend on their ability to decrease glucuronidase activity (see 7 Warnings and Precautions) | |||||
Legend: CT = Clinical Trial; I = In vitro
CYP3A4 Inducers
Chronic concomitant administration of rifampin with a single dose of sorafenib resulted in a 24% decrease in the combined AUC of sorafenib and its active primary metabolite with rifampin was coadministered with sorafenib. The clinical significance of this overall decrease in drug exposure is unknown. Other inducers of CYP3A4 activity (eg, hypericum perforatum [also known as St. John’s Wort], phenytoin, carbamazepine, phenobarbital, and dexamethasone) may also increase the metabolism of sorafenib and decrease its exposure.
CYP3A4 Inhibitors
Ketoconazole, a potent inhibitor of CYP3A4 administered once daily for 7 days to healthy male volunteers did not alter the mean AUC of a single subclinical dose (50 mg) of sorafenib.
CYP Isoform-selective Substrates
Studies with human liver microsomes demonstrated that sorafenib is an in vitro competitive inhibitor of CYP3A4, CYP2D6, and CYP2C19. However, concomitant clinical administration of sorafenib and midazolam, dextromethorphan, or omeprazole, which are substrates of cytochromes CYP3A4, CYP2D6, and CYP2C19, respectively, following 4 weeks of sorafenib administration did not alter the exposure of these agents. This suggests that sorafenib is neither an inhibitor nor an inducer of these cytochrome P450 isoenzymes in humans.
UGT1A9 Inhibitors
An in vitro study has revealed a number of drugs affected UGT1A9-mediated sorafenib glucuronidation with an IC50 value below 100 mcM. They were atorvastatin (IC50 = 67 mcM), ketoconazole (87 mcM), mefenamic acid (28 mcM), erlotinib (69 mcM), and niflumic acid (1.2 mcM). The clinical relevance of these drug interactions has not been tested.
Combination With Other Antineoplastic Agents
APO-SORAFENIB is only approved as monotherapy in the treatment of RCC and HCC (see 1 Indications).
In clinical studies, sorafenib has been shown to interact with a variety of other antineoplastic agents at their commonly-used dosing regimens, including doxorubicin, irinotecan, docetaxel (see Table 14), paclitaxel, carboplatin, cisplatin, and capecitabine.
Doxorubicin/Irinotecan
Concomitant treatment with sorafenib resulted in a 21% increase in the AUC of doxorubicin. When administered with irinotecan, whose active metabolite SN-38 is further metabolized by the UGT1A1 pathway, there was a 67% to 120% increase in the AUC of SN-38 and a 26% to 42% increase in the AUC of irinotecan. The clinical significance of these findings is unknown (see 7 Warnings and Precautions).
Paclitaxel/Carboplatin
Co-administration of paclitaxel and carboplatin with continuous sorafenib administration resulted in a 47% increase in sorafenib exposure, a 29% increase in paclitaxel exposure, and a 50% increase in 6-OH paclitaxel exposure. The pharmacokinetics of carboplatin was unaffected. The clinical significance of the increases in sorafenib and paclitaxel exposure upon continuous sorafenib administration with paclitaxel and carboplatin is unknown.
Capecitabine
Coadministration of capecitabine and sorafenib (200 or 400 mg twice daily, continuous uninterrupted administration) resulted in no significant change in sorafenib exposure, but a 15% to 50% increase in capecitabine exposure and a 0% to 52% increase in 5-FU exposure. The clinical significance of these increases in capecitabine and 5-FU exposure when coadministered with sorafenib is unknown.
Studies on Enzyme Inhibition
Sorafenib inhibits CYP2B6 and CYP2C8 in vitro with Ki values of 6 mcM and 1 to 2 mcM, respectively. In a clinical study, coadministration of sorafenib with a CYP2B6 substrate to patients with solid tumours resulted in a decrease in exposure of the CYP2B6 substrate, and an increase in exposure, rather than a decrease in exposure, of the CYP2B6-mediated metabolite of the substrate. These data suggest that sorafenib may not be an in vivo inhibitor of CYP2B6.
Further, in another clinical study, coadministration of sorafenib with a CYP2C8 substrate resulted in an increase in exposure of the CYP2C8 substrate, and also an increase in exposure, rather than a decrease in exposure, of the CYP2C8-mediated metabolite of the substrate. These data suggest that sorafenib may not be an in vivo inhibitor of CYP2C8.
In Vitro Studies of CYP Enzyme Induction
CYP1A2 and CYP3A4 activities were not altered after treatment of cultured human hepatocytes with sorafenib, indicating that sorafenib is unlikely to be an inducer of CYP1A2 and CYP3A4.
9.5 Drug-Food Interactions
It is recommended that sorafenib be administered without food or together with a low-fat or moderate-fat meal. Following oral administration, sorafenib reaches peak plasma levels in approximately 3 hours. When given with a moderate-fat meal, bioavailability is similar to that in the fasted state. With a high-fat meal, sorafenib bioavailability is reduced by 29% compared to administration in the fasted state (see 4 Dosage and Administration).
9.6 Drug-Herb Interactions
Interactions with herbal products have not been established. St. John’s Wort (an inducer of CYP3A4 activity) may increase metabolism of sorafenib and thus decrease sorafenib concentrations.
9.7 Drug-Laboratory Test Interactions
Interactions with results of laboratory tests have not been established.
10 Clinical Pharmacology
10.1 Mechanism of Action
Sorafenib was shown to inhibit multiple intracellular (c-CRAF, BRAF and mutant BRAF) and cell surface kinases (KIT, FLT-3, RET, RET-PTC, VEGFR-1, VEGFR-2, VEGFR-3, and PDGFR-ß). Several of these kinases are thought to be involved in tumour cell signaling, angiogenesis, and apoptosis. Sorafenib inhibited cell proliferation of the human hepatocellular carcinoma PLC/PRF/5 and HepG2 cell lines, renal cell carcinoma (786-O cell line), differentiated thyroid carcinoma (TPC-1 cell line, carrying a RET/PTC1 rearrangement) and tumour growth of several human tumour xenografts (PLC/PRF/5 cell line) in immunocompromised mice. A reduction in tumour angiogenesis and increases in tumour apoptosis was seen in the xenograft models of human hepatocellular and renal cell carcinoma cell lines. Additionally, a reduction in Raf/MEK/ERK signaling was seen in human hepatocellular carcinoma PLC/PRF/5 and HepG2 cell lines, and the differentiated thyroid carcinoma TPC-1 cell line. A reduction of RET/PTC (a rearrangement commonly found in DTC) receptor autophosphorylation was observed in NIH/3T3 cells transfected with RET/PTC3.
10.2 Pharmacodynamics
QT Interval Prolongation
In an open label, non-randomized clinical pharmacology study, QT/QTc measurements were recorded in 31 cancer patients at baseline (pre-treatment) and post-treatment. After one 28-day treatment cycle with sorafenib tablets 400 mg bid, at the time of maximum concentration of sorafenib, QTcF was prolonged by 9 ± 18 msec, as compared to placebo treatment at baseline (see 7 Warnings and Precautions – Cardiovascular – QT Interval Prolongation and 9 Drug Interactions).
Hemodynamics
In the same study as above, heart rate and blood pressure were measured at baseline (pre-treatment) and post-treatment. After one cycle of treatment (day 1 of cycle 2), at the time of maximum concentration of sorafenib, mean supine systolic blood pressure was increased from baseline by 12±19 mmHg, mean supine diastolic blood pressure was increased by 11±12 mmHg, and mean supine heart rate was decreased by 7±11 bpm. On day 1 of cycle 2, 38.5% of the patients had a treatment-emergent systolic blood pressure value ≥150 mmHg and 25.6% had a treatment-emergent diastolic blood pressure value ≥90 mmHg. After 4 cycles of treatment (day 1 of cycle 5), at the time of maximum concentration of sorafenib, mean supine systolic and diastolic blood pressure were still increased from baseline by similar amounts as above, and the mean supine heart rate was decreased considerably less (by 3±7 bpm) (see 7 Warnings and Precautions – Cardiovascular – Hypertension and 8 Adverse Reactions).
Ventricular Performance
In the same study as above, left ventricular ejection fraction (LVEF) was assessed by multigated acquisition scans at baseline and after two and four 28-day cycles of sorafenib tablets 400 mg bid (day 1 of cycle 3 and day 1 of cycle 5). On day 1 of cycle 3, the mean change from baseline in LVEF% was -0.83±8.58% (N=31) and on day 1 of cycle 5, the mean change from baseline in LVEF% was -1.22±7.75% (N=24). Four patients out of 31 (12.9%), had decreases from baseline in LVEF on day 1 of cycle 3 of ≥10 LEVF%. On day 1 of cycle 5, 1 patient out of 24 (4.2%) had a decrease from baseline of LVEF of ≥10%. One patient after cycle 1 and one patient after cycle 5 had treatment-emergent decreases resulting in an LVEF of <50% (see 7 Warnings and Precautions – Cardiovascular – Decreased LVEF and Heart Failure and 8 Adverse Reactions).
10.3 Pharmacokinetics
Absorption and Distribution
After administration of sorafenib tablets, the mean relative bioavailability is 38% to 49% when compared to an oral solution.
Following oral administration, sorafenib reaches peak plasma levels in approximately 3 hours. When given with a moderate-fat meal (30% fat; 700 calories), bioavailability is similar to that in the fasted state. With a high-fat meal (50% fat; 900 calories), sorafenib bioavailability is reduced by 29% compared to administration in the fasted state.
Mean Cmax and AUC increase less than proportionally beyond doses of 400 mg administered orally twice daily.
Multiple dosing of sorafenib for 7 days results in a 2.5-fold to 7-fold accumulation compared to single-dose administration. Steady-state plasma sorafenib concentrations are achieved within 7 days, with a peak-to-trough ratio of mean concentrations of less than 2. In vitro binding of sorafenib to human plasma proteins is 99.5%.
The steady-state concentration exposures (AUC) of sorafenib administered at 400 mg bid were evaluated in DTC, RCC and HCC patients. The highest mean exposure was observed in DTC patients, and was approximately 70% higher than the exposures observed in patients with RCC or HCC. The variability in concentration exposures was high for all tumour types. The clinical relevance and the reason for the increased AUC in DTC patients are unknown.
Metabolism and Elimination
Sorafenib is metabolized primarily in the liver undergoing oxidative metabolism mediated by CYP3A4 as well as glucuronidation mediated by UGT1A9. Sorafenib conjugates may be cleaved in the GI tract by bacterial glucuronidase activity, allowing reabsorption of unconjugated drug. Coadministration of neomycin interferes with this process, decreasing the mean bioavailability of sorafenib by 54% (see 7 Warnings and Precautions and 9 Drug Interactions).
Ketoconazole, a potent inhibitor of CYP3A4 administered once daily for 7 days to healthy male volunteers, did not alter the mean AUC of a single 50 mg dose of sorafenib. Concomitant administration of sorafenib and midazolam, dextromethorphan or omeprazole, which are substrates of cytochromes CYP3A4, CYP2D6, and CYP2C19, respectively, following 4 weeks of sorafenib administration did not alter the exposure of these agents. The possible effect of sorafenib on a CYP2C9 substrate was assessed in patients receiving sorafenib or placebo in combination with warfarin. The mean changes from baseline in PT-INR in RCC patients were not higher in sorafenib-treated patients compared to placebo patients, suggesting that sorafenib may not be an inhibitor of CYP2C9 (see 16 Non-Clinical Toxicology – Pharmacokinetics and 9 Drug Interactions).
Sorafenib accounts for approximately 70% to 85% of the circulating analytes in plasma at steady state. Eight metabolites of sorafenib have been identified, of which 5 have been detected in plasma. The main circulating metabolite of sorafenib in plasma, the pyridine N-oxide, shows in vitro potency similar to that of sorafenib and comprises approximately 9% to 16% of circulating analytes at steady state (see 16 Non-Clinical Toxicology –Pharmacokinetics and 9 Drug Interactions).
Following oral administration of a 100 mg dose of a solution formulation of sorafenib, 96% of the dose was recovered within 14 days, with 77% of the dose excreted in feces, and 19% of the dose excreted in urine as glucuronidated metabolites. Unchanged sorafenib, accounting for 51% of the dose, was found in feces but not in urine.
The elimination half-life of sorafenib is approximately 25 to 48 hours.
Special Populations and Conditions
Pediatrics (<18 years of age)
There are no pharmacokinetic data in pediatric patients.
Geriatrics (≥65 years of age)
Analyses of data suggest that no dose adjustments are necessary based on patient age.
Sex
Analyses of pharmacokinetic and safety data in male and female subgroups suggest that no dose adjustments are necessary based on patient gender.
Ethnic Origin
There are no clinically relevant differences in pharmacokinetics between Caucasian and Asian patients.
Hepatic Insufficiency
Sorafenib is cleared primarily by the liver. The results of one phase II study in hepatic cellular carcinoma patients revealed 36% and 54% higher AUC0-8 and Cmax in patients with Child-Pugh B hepatic impairment (n = 6) compared to patients with Child-Pugh A hepatic impairment (n = 14) in subjects administered 400 mg bid sorafenib tablets (see Table 15 below). The pharmacokinetics of sorafenib in Child-Pugh A and Child-Pugh B non-hepatic cellular carcinoma patients was similar to the pharmacokinetics in healthy volunteers. The pharmacokinetics of sorafenib has not been studied in patients with severe (Child-Pugh C) hepatic impairment (see 7 Warnings and Precautions).
Table 15: Pharmacokinetic Parameters in Child Pugh A and B Patients – Phase II Study 10874
| Child Pugh A [n = 14] | Child Pugh B [n = 6] | Ratio [A/B] | ||||||
| AUC (0-8), mg*h/L (CV%) | 23.3 | (36.7) | 31.6 | (71.2) | 1.36 | |||
| Cmax, mg/L (CV%) | 4.4 | (32.6) | 6.8 | (67.8) | 1.54 | |||
Renal Insufficiency
In a clinical pharmacology study, the pharmacokinetics of sorafenib were evaluated following administration of a single 400 mg dose to subjects with normal renal function and in subjects with mild (Clcr 50 to 80 mL/min), moderate (Clcr 30 to < 50 mL/min), or severe (Clcr < 30mL/min) renal impairment, not requiring dialysis. There was no relationship observed between sorafenib exposure and renal function. No dosage adjustment is necessary based on mild, moderate, or severe renal impairment not requiring dialysis (see 7 Warnings and Precautions).
11 Storage, Stability, and Disposal
Store at controlled room temperature 15°C to 30°C in a dry place. Protect from moisture. Do not use after the expiry date stated on bottle and blister cards.
Medicines should not be disposed of via wastewater or household waste. Ask your pharmacist how to dispose of medicines no longer required. These measures will help to protect the environment.
Keep out of the reach and sight of children and pets.
Part 2: Scientific Information
13 Pharmaceutical Information
Drug Substance
Proper name:
sorafenib tosylate
Chemical name:
4-(4-(3-[4-Chloro-3-(trifluoromethyl)phenyl]-ureido)phenoxy)- N2-methylpyridine-2-carboxamide 4-methylbenzenesulfonate
Molecular formula and molecular mass:
C21H16ClF3N4O3 x C7H8O3S and 637.0 g/mol
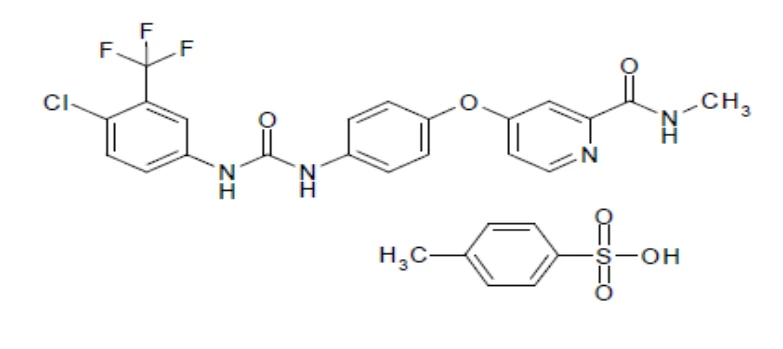
Structural formula:
Physicochemical properties:
Sorafenib is supplied as a tosylate salt and is a white to yellowish solid.
Sorafenib tosylate is practically insoluble in aqueous media, slightly soluble in ethanol and soluble in Polyethylene Glycol (PEG) 400.
14 Clinical Trials
The clinical safety and efficacy of sorafenib tablets have been studied in patients with hepatocellular carcinoma (HCC), in patients with locally advanced/metastatic renal cell carcinoma (RCC) and in patients with differentiated thyroid carcinoma (DTC).
14.1 Clinical Trials by Indication
Hepatocellular Carcinoma
Study 100554 was a phase III, international, multicenter, randomized, double-blind, placebo-controlled trial in 602 patients with hepatocellular carcinoma. Overall survival (OS) and time to symptomatic progression (TTSP) were co-primary endpoints of this study. Time to progression (TTP) was a secondary endpoint.
Demographics and baseline disease characteristics were comparable between the sorafenib tablets and placebo groups with regard to age, gender, race, performance status, etiology (including hepatitis B, hepatitis C, and alcoholic liver disease), TNM stage (sorafenib vs placebo, Stage I: <1% vs <1%; Stage II: 10.4% vs 8.3%; Stage III: 37.8% vs 43.6%; Stage IV: 50.8% vs 46.9%), presence of macroscopic vascular invasion (36% vs 41%) and extrahepatic tumour spread (53% vs 50%), BCLC stage (Stage B: 18.1% vs 16.8%; Stage C: 81.6% vs 83.2%; Stage D: <1% vs 0%) and liver function (Child-Pugh A: 95% vs 98%; Child-Pugh B: 5% vs 2%). Only 1 patient with Child-Pugh C liver dysfunction was treated in the study. Enrolment of subjects with Child-Pugh B or C was a protocol violation. Prior treatment included surgical resection procedures (19.1% vs 20.5%), locoregional therapies (including radiofrequency ablation, percutaneous ethanol injection, and transarterial chemoembolisation: 38.8% vs 40.6%), radiotherapy (4.3% vs 5.0%), and systemic therapy (3.0% vs 5.0%).
The study was stopped after a planned interim analysis of OS had crossed the prespecified efficacy boundary. The definitive results from this analysis showed a statistically significant advantage for sorafenib tablets over placebo for OS (HR: 0.69, P = 0.00058, see Table 16 and Figure 1). This advantage was consistent across almost all subsets analysed. In the prespecified stratification factors (ECOG status, presence, or absence of macroscopic vascular invasion and/or extrahepatic tumour spread, and region), the hazard ratio consistently favoured sorafenib tablets over placebo. The time to tumour progression (TTP, by independent radiological review) was significantly larger in the sorafenib tablets arm (HR: 0.58, P = 0.000007, see Table 16). The analysis of the co-primary endpoint TTSP was not statistically significant. Efficacy and safety could not be evaluated in Child-Pugh B subjects enrolled in this study due to limited data (n = 20).
Table 16: Efficacy Results From Study 100554 in Hepatocellular Carcinoma
| Efficacy Parameter | Sorafenib tablets (N = 299) | Placebo (N = 303) | P-value | HR (95% CI) |
| Overall Survival (OS) (Median, weeks [95% CI]) | 46.3 (40.9, 57.9) | 34.4 (29.4, 39.4) | 0.00058a | 0.69 (0.55, 0.87) |
| Time to Progression (TTP) (Median, weeks [95% CI])b | 24.0 (18.0, 30.0) | 12.3 (11.7, 17.1) | 0.000007 | 0.58 (0.45, 0.74) |
| Time to Symptomatic Progression (TTSP) (Median, months [95% CI]) | 4.1 (3.5, 4.8) | 4.9 (4.2, 6.3) | 0.77 | 1.08 (0.88, 1.31) |
CI = Confidence interval, HR = Hazard ratio (sorafenib tablets over placebo)
- a statistically significant because the P-value was below the prespecified O’Brien Fleming stopping boundary of 0.0077
- b
independent radiological review
Figure 1: Kaplan-Meier Curve of Overall Survival in Study 100554, Intent-to-treat Population
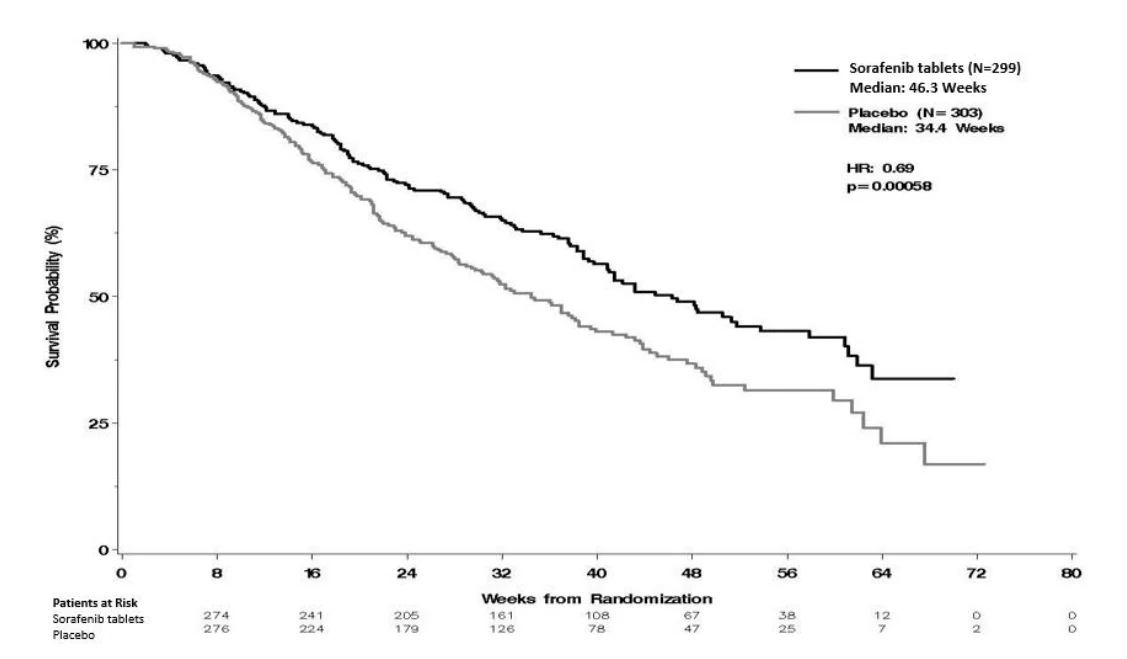
Renal Cell Carcinoma
Study 11213
Study 11213 was a phase III, double-blind, international, randomized, parallel-group, multicenter study in subjects with advanced renal cell (clear cell) carcinoma (RCC). Eligible subjects had 1 prior systemic therapy for advanced disease on which the subject progressed, intermediate or low MSKCC prognostic criteria, an Eastern Cooperative Oncology Group (ECOG) Performance Status (PS) of 0 or 1, and were without brain metastases. Patients were randomized to sorafenib 400 mg twice daily (N = 451) or to placebo (N = 452) taken in an uninterrupted schedule.
The primary study endpoint was overall survival (OS); additional endpoints included progression-free survival (PFS), best overall tumour objective response rates, disease control rate (DCR, the proportion of subjects showing complete response, partial response, or stable disease that was maintained for at least 28 days from the first demonstration of that response), and changes in health-related quality of life (HRQoL). One formal analysis of PFS, two formal interim analyses and one final analysis of OS were planned. The final analysis of OS was to be performed when approximately 540 events had been observed.
OS in the sorafenib and placebo groups were to be compared using a 2-sided log rank test with alpha = 0.04 and stratified by country and MSKCC prognostic risk category. A clinically meaningful improvement was defined as a 33.3% increase in OS.
One PFS analysis was planned at an interim timepoint after 363 events (progressions or deaths); the sorafenib and placebo groups were to be compared using a 2-sided log-rank test with alpha = 0.01, stratified by country and MSKCC risk category.
Because results of the planned PFS analysis demonstrated a statistically significant doubling of PFS in subjects treated with sorafenib, unblinding of treatment allocation was recommended after consultation with the DMC, steering committee and regulatory authorities. Based on this change to the protocol subjects randomized to placebo were allowed to crossover to sorafenib, and the statistical analysis plan for OS was modified. In order to maintain an overall false positive rate of alpha = 0.05 as originally designed, alpha was prospectively divided between the final OS (2-sided alpha of 0.04) and PFS (2-sided alpha of 0.01) analyses. This modified plan recognized that OS data after crossover may be confounded.
Table 17 summarizes the demographic and disease characteristics of the study population analyzed. Baseline demographics and patient characteristics were well balanced for both treatment groups. The median time from initial diagnosis of RCC to randomization was 1.6 and 1.9 years for the sorafenib tablets and placebo groups, respectively. The median age of the patients was 59 years (range 19 to 86). Approximately half of the patients had an ECOG performance status of 0 and half of the patients were in the low Motzer prognostic group.
Table 17: Demographics and Disease Characteristics – Study 11213
| Characteristics | Sorafenib tablets (N = 451) | Placebo (N = 452) | ||
| Characteristics | Sorafenib tablets (N = 451) | Placebo (N = 452) | ||
| N | (%) | N | (%) | |
| N | (%) | N | (%) | |
| Gender | ||||
| Male | 315 | (70) | 340 | (75) |
| Female | 136 | (30) | 112 | (25) |
| Race | ||||
| White | 334 | (74) | 332 | (73) |
| Black/Asian/ Hispanic/Other | 15 | (3) | 18 | (4) |
| Not reporteda | 102 | (23) | 102 | (23) |
| Age Group | ||||
| <65 years | 305 | (68) | 329 | (73) |
| ≥65 years | 146 | (32) | 123 | (27) |
| ECOG Performance Status at Baseline | ||||
| 0 | 219 | (48) | 210 | (47) |
| 1 | 223 | (49) | 236 | (52) |
| 2 | 7 | (2) | 4 | (1) |
| Not reported | 2 | (<1) | 2 | (<1) |
| Motzer/MSKCC Prognostic Risk Category | ||||
| Low | 233 | (52) | 228 | (50) |
| Intermediate | 217 | (48) | 223 | (49) |
| Prior Therapy for Metastatic Disease | ||||
| Yesb | 373 | (83) | 362 | (80) |
| No | 78 | (17) | 90 | (20) |
| Prior IL-2 and/or Interferon | ||||
| Yesb | 374 | (83) | 368 | (81) |
| No | 77 | (17) | 84 | (19) |
- a Race was not collected from the 204 patients enrolled in France due to local regulations.
- b Includes patients for whom intent of therapy was not reported and therefore their removal cannot be assessed.
The efficacy data generated in this study are summarized in Table 18 below. The median PFS for patients randomized to sorafenib tablets (167 days) was double that observed for patients randomized to placebo (84 days), representing a 56% reduction in risk of progression for patients receiving sorafenib compared to placebo.
Table 18: Efficacy (PFS and Hazard Ratio) Results From Study 11213
| Placebo (N = 385) | Sorafenib tablets (N = 384) | |||||||
| Median PFS (days) | 84 | 167 | ||||||
| 95% confidence interval for median | (78, 91) | (139, 174) | ||||||
| Hazard ratio (sorafenib/placebo) | 0.44 (P<0.000001) | |||||||
| 95% confidence interval for hazard ratio | (0.35, 0.55) | |||||||
PFS in the intent-to-treat population was evaluated by blinded independent radiological review using RECIST criteria. Figure 2 depicts Kaplan-Meier curves for PFS.
Figure 2: Kaplan-Meier Curves for Progression-Free Survival – Study 11213
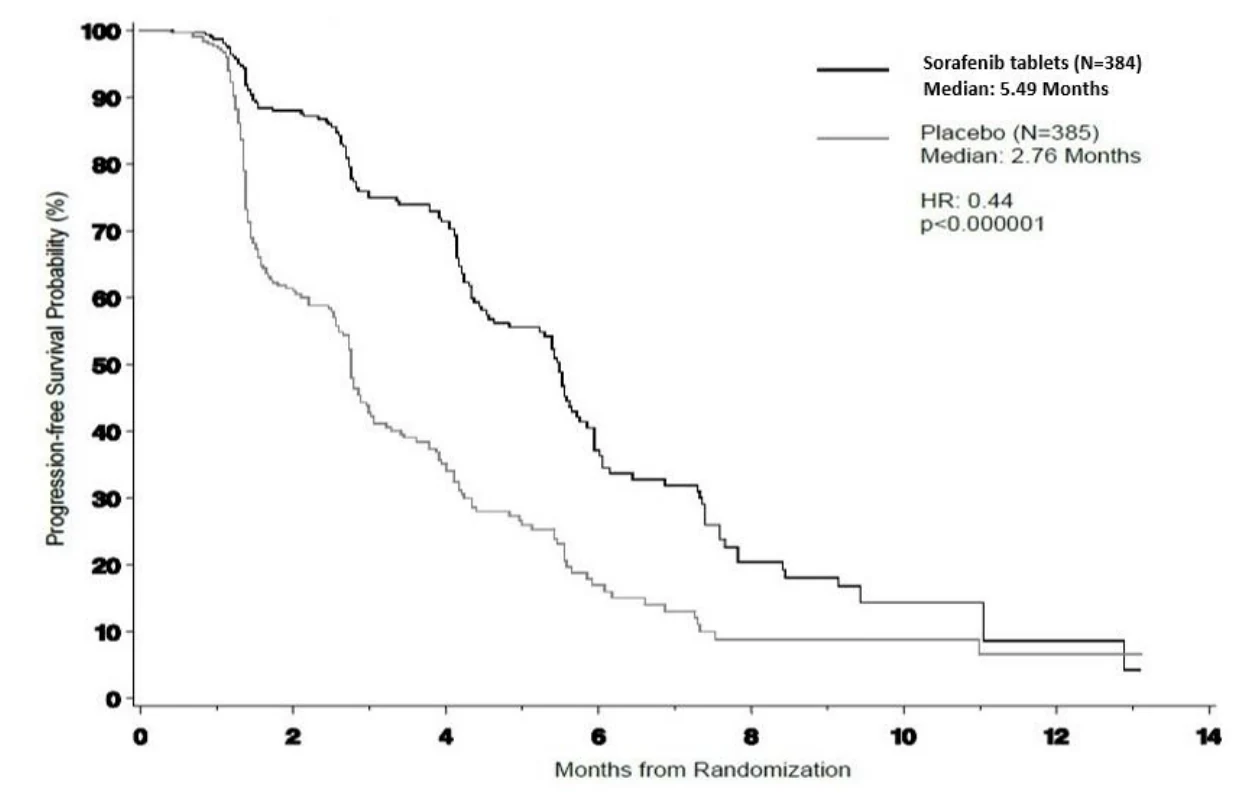
HR (Hazard Ratio) is from Cox regression model with the following covariates: Motzer/MSKCC prognostic risk category and country. P-value is from two-sided Log-Rank test stratified by Motzer/MSKCC prognostic risk category and country.
A series of patient subsets were examined in exploratory univariate analyses of PFS. These results are shown in Figure 3. The effect of sorafenib on PFS was consistent across these subsets, including patients with no prior IL-2 or interferon therapy (N = 137), for whom the median PFS was 172 days on sorafenib tablets compared to 85 days on placebo.
Figure 3: Progression-Free Survival in Patient Subgroups (Hazard Ratio and 95% Cl for Sorafenib Tablets: Placebo) – Study 11213
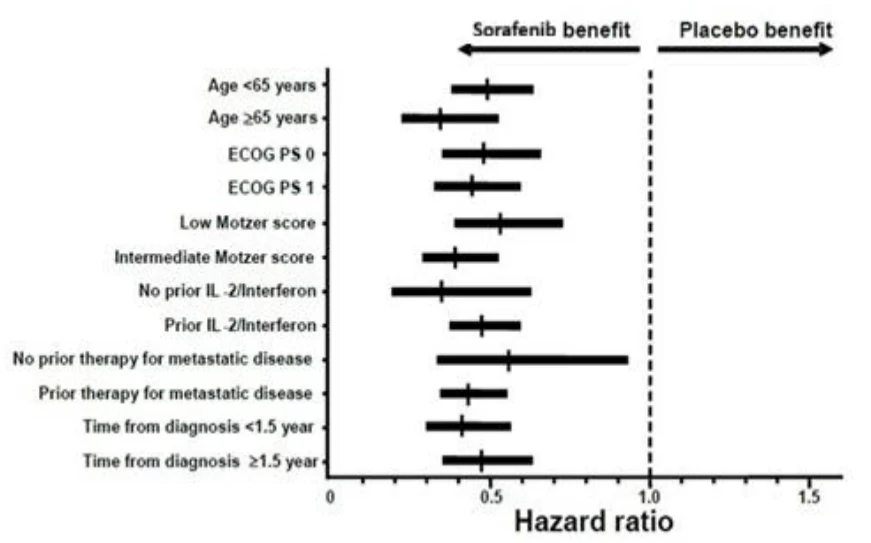
Tumour response was determined by independent radiological review according to RECIST criteria. In the sorafenib tablets group, 80% (268/335) of the patients had best response of stable disease or better compared to 55% (186/337) of the patients in the placebo group. Overall, 7 (2%) sorafenib patients and 0 (0%) placebo patients had a confirmed partial response, and 261 (78%) sorafenib patients and 186 (55%) placebo patients had stable disease.
Overall, 293 patients in the sorafenib tablets group and 281 patients in the placebo group had at least 1 postbaseline radiographic tumour evaluation available for independent review. There was a trend towards more tumour shrinkage (based on measurements of target lesions) in patients treated with sorafenib tablets (see Figure 4); 74% of sorafenib patients had some degree of tumour shrinkage, compared to 20% of placebo patients.
Figure 4: Smallest Tumour Burden of Target Lesions by Patient, Using Independent Review of Scans in Study 11213
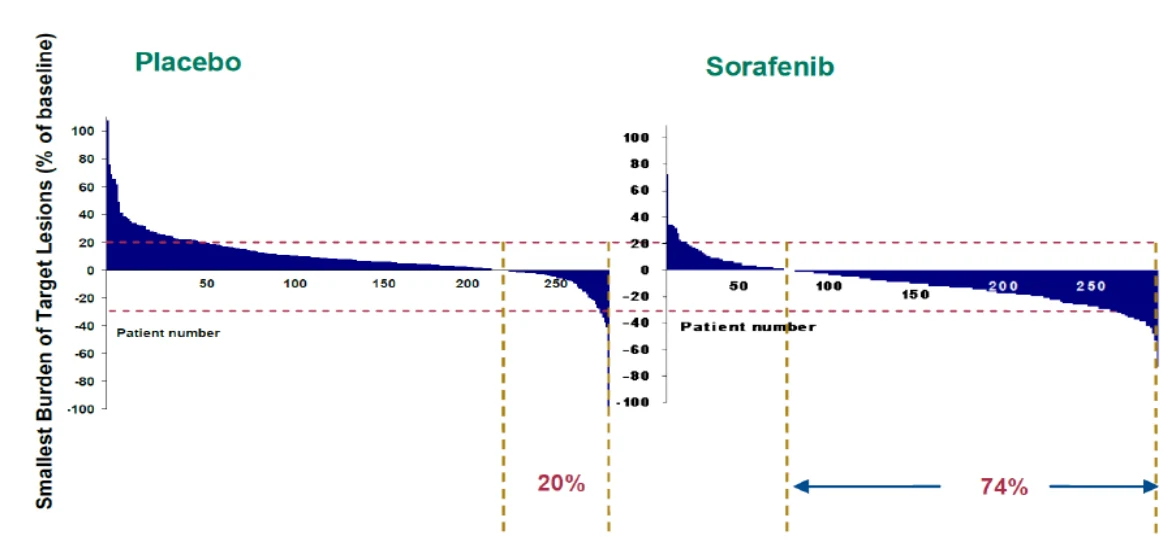
Smallest tumour burden from baseline based on target lesion for individual patients, each of whom is represented by a bar on the graph. Bars pointing in the positive direction of the Y axis represent patients whose target lesions grew, while bars pointing in the negative direction represent patients with target lesions shrinkage.
The upper and lower dashed horizontal lines represent the RECIST response criteria for progressive disease (at least a 20% increase in the sum of the longest diameter of target lesions) and partial response (at least a 30% decrease in the sum of the longest diameter of target lesions), respectively.
At the first interim survival analysis, based on 220 deaths, OS was longer for sorafenib tablets than placebo with a hazard ratio (sorafenib tablets over placebo) of 0.72. The differences in the results were not statistically significant due to the interim nature of the data.
At the time of the second planned interim analysis based on 367 deaths, survival was longer in patients treated with sorafenib tablets (171 deaths in the sorafenib tablets arm and 196 deaths in the placebo arm) with a hazard ratio of 0.77. A prespecified statistical significance level was not reached. This analysis included 200 placebo patients that had crossed over to sorafenib tablets treatment. The Kaplan-Meier curves for OS constructed at this time are shown in Figure 5. The two curves (sorafenib tablets and placebo) cross at day 696, as observed in Figure 5, due to 1 death in the sorafenib tablets arm. At this time point, where only 6 at-risk patients are evaluable (n = 4 on sorafenib tablets, n = 2 on placebo), differences in survival between treatment groups are inconclusive.
Figure 5: Kaplan-Meier Curves for Overall Survival (Second Interim Analysis)
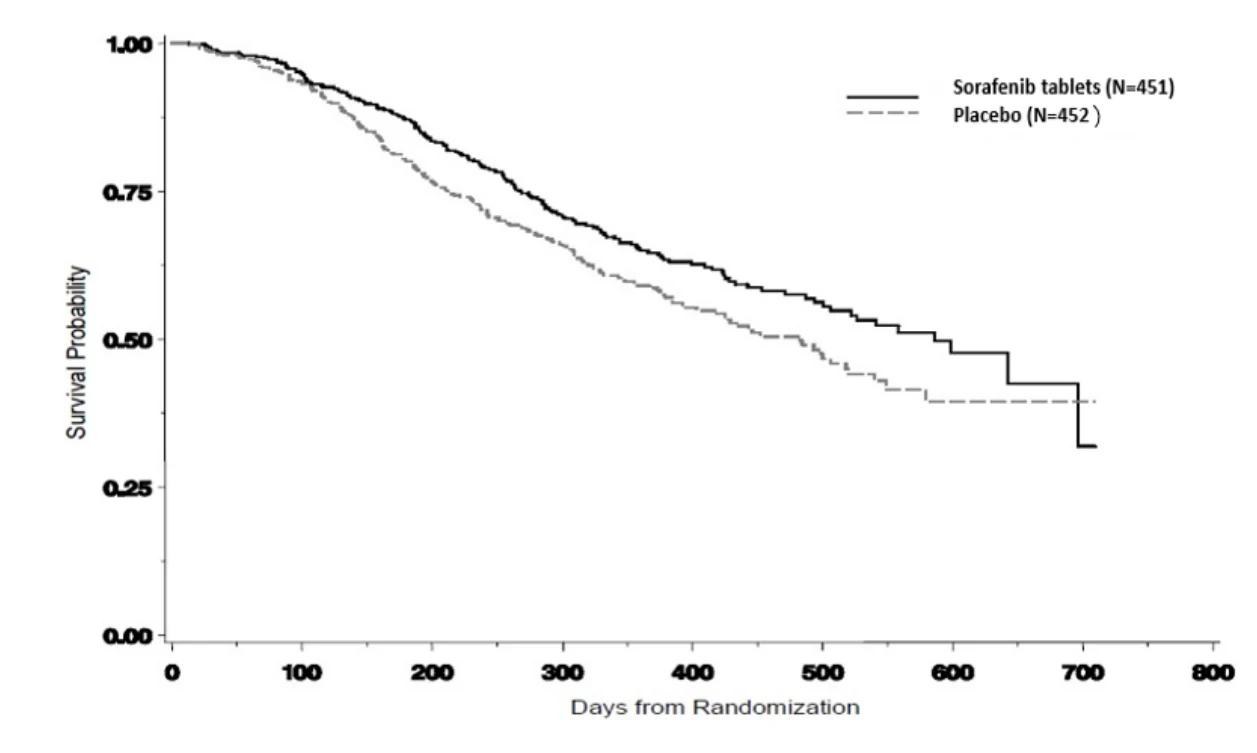
Patients at Risk
Sorafenib tablets
422
366
248
146
80
24
3
Placebo
408
333
228
122
60
13
2
The final OS analysis included 216 (48%) patients originally randomized to placebo crossed over to sorafenib tablets treatment. For the patients originally randomized to placebo, sorafenib tablets therapy accounted for 61% of total treatment exposure. The final postcrossover database included 561 deaths; median OS was 15.2 months in the placebo group (including patients crossed over to sorafenib treatment) and 17.8 months in the sorafenib group. The hazard ratio was 0.88 (nominal P = 0.146, 95% CI: 0.74, 1.04). The prespecified statistical significance level was not reached for final OS. Figure 6 provides the Kaplan-Meier curve of the final OS analysis.
Figure 6: Kaplan-Meier Curve of Overall Survival
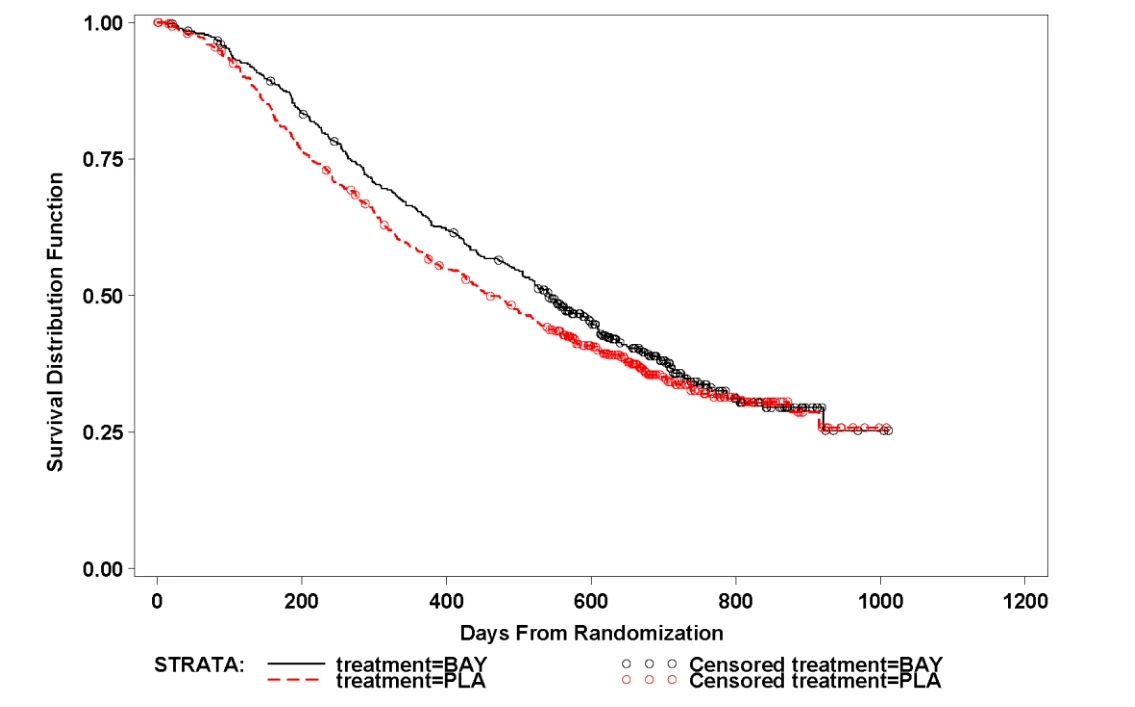
A secondary objective of Study 11213 was to compare the impact of sorafenib and placebo on the Quality of Life and disease-related symptoms of subjects with RCC. Sorafenib demonstrated no overall deterioration in kidney-cancer specific symptoms (FKSI-10) or health-related quality of life compared to placebo (see Table 19 and Table 20 below).
The Functional Assessment of Cancer Therapy-Kidney Symptom Index-10 (FKSI-10) is an index consisting of the first 10 items of the Functional Assessment of Cancer Therapy-Kidney Symptom Index-15 (FKSI-15) scale. The FKSI-10 has been validated and has comparable psychometric properties, including high internal consistency and reliability, to the FKSI-15. Items on the FKSI scales are scored on a 5-point Likert type scale ranging from 0 (Not at All) to 4 (Very Much). The FKSI-10 total score ranges from 0 (severely symptomatic in all symptoms assessed) to 40 (symptom free in all symptoms assessed). Higher scores indicate fewer symptoms. A change of 3 to 4 points or more on the FKSI-10 is considered to be clinically meaningful.
Table 19 shows the least-squares mean FKSI-10 total scores for sorafenib and placebo-treated patients in Study 11213, overall and at each of cycles 1 to 5. There was no numeric or statistical difference in mean FKSI-10 total score between placebo (27.20) and sorafenib (27.19) in the first 5 treatment cycles (P = 0.98).
Table 19: Comparison of Least-Squares Mean FKSI-10 Total Score Over the First 5 Cycles: Sorafenib Versus Placebo (n = 851)
| FKSI-10 Score | |||||
| Placebo (n = 426) | Sorafenib (n = 425) | ||||
| Overalla | 27.20 | (0.23)b | 27.19 | (0.23) | |
| Cycle 2 day 1 | 27.78 | (0.22) | 27.77 | (0.23) | |
| Cycle 3 day 1 | 27.28 | (0.23) | 27.27 | (0.22) | |
| Cycle 4 day 1 | 26.78 | (0.26) | 26.77 | (0.25) | |
| Cycle 5 day 1 | 26.28 | (0.31) | 26.27 | (0.30) | |
- a Least-squares means of treatment over the first 5 cycles were calculated using means of total time on treatment and baseline FKSI-10 values
- b Numbers in brackets are the least-squares standard error
The FACT-G is a 27 item, self-administered, multi-dimensional, validated instrument developed to measure general aspects of HRQoL in patients with any form of cancer. The FACT-G consists of four domains: physical well-being (PWB), social/family well-being (SWB), emotional well being (EWB), and functional well being (FWB). The FACT-G PWB total score ranges from 0 to 28; higher scores reflect better HRQoL, and a change in score of 3 to 4 points or more has been defined as clinically meaningful.
Table 20 shows the least-squares mean FACT-G Physical Well-Being (PWB) scores for sorafenib and placebo-treated patients in Study 11213, overall, and at each of cycles 1 to 5. There was no significant difference in mean FACT-G PWB score between the placebo (20.70) and sorafenib (20.65) groups over the first 5 cycles of treatment (P = 0.83).
Table 20: Comparison of Least-Squares Mean FACT-G PWB Score Over the First 5 Cycles: Sorafenib Versus Placebo (n = 851)
| PWB Score | |||||||
| Placebo (n = 426) | Sorafenib (n = 425) | ||||||
| Overalla | 20.65 | (0.17)b | 20.70 | (0.17) | |||
| Cycle 2 day 1 | 21.16 | (0.19) | 21.21 | (0.17) | |||
| Cycle 3 day 1 | 20.72 | (0.19) | 20.77 | (0.17) | |||
| Cycle 4 day 1 | 20.28 | (0.22) | 20.33 | (0.19) | |||
| Cycle 5 day 1 | 19.84 | (0.26) | 19.89 | (0.24) | |||
- a Least-squares means of treatment over the first 5 cycles were calculated using the means of total time on treatment and baseline FACT-G PWB values
- b Numbers in brackets are the least-squares standard error
Study 100391
Study 100391 was a randomized discontinuation trial in patients with various metastatic malignancies. The primary endpoint was percentage of randomized patients remaining progression-free at 24 weeks. All patients received sorafenib for the first 12 weeks. Radiologic assessment was repeated at week 12: patients with <25% change in bidimensional tumour measurements from baseline were randomized to sorafenib tablets or placebo for a further 12 weeks; patients who were randomized to placebo were permitted to crossover to open-label sorafenib upon progression; patients with ≥25% tumour shrinkage continued sorafenib; patients with tumour growth ≥25% discontinued treatment.
Two hundred and two patients with RCC were enrolled in Study 100391, including patients who received no prior therapy and patients with tumour histology other than clear cell carcinoma. Seventy-nine RCC patients remained on open-label sorafenib after the first 12 weeks of study therapy. At 24 weeks the progression-free rate for the 65 randomized RCC patients was significantly higher (P = 0.0077) for the sorafenib tablets group (16 of 32 patients [50.0%]) than for the placebo group (6 of 33 patients [18.2%]). The RCC patients randomized to sorafenib tablets had a significantly longer median PFS (163 days) compared to patients randomized to placebo (41 days; P = 0.0001; hazard ratio 0.29).
Differentiated Thyroid Carcinoma
Study 14295 was a Phase III, international, multi-centre, randomized, double blind, placebo-controlled trial in 417 patients with locally advanced or metastatic, progressive differentiated thyroid carcinoma refractory to radioactive iodine.
Progression-free survival (PFS) was the primary endpoint of the study. Secondary endpoints included overall survival (OS), time to progression (TTP), disease control rate (DCR), tumour response rate (RR) and duration of response (DOR). Following progression, patients were allowed to receive open label sorafenib tablets. Concomitant radioactive iodine treatment was not permitted.
Patients were included in the study if they experienced progression within 14 months of enrollment and had DTC refractory to radioactive iodine (RAI). DTC refractory to RAI was defined as having a lesion without iodine uptake on a RAI scan, or:
- Patients who have some iodine uptake, who have had a RAI treatment within the last 16 months, and who have had progression of their target lesion(s) despite that RAI treatment, or
- Patients who have some iodine uptake, who have had multiple RAI treatments, whose last RAI treatment was >16 months ago, and who had progression after each of two RAI treatments that were done within 16 months of each other, or
- Any individual patient who has received RAI treatments with a cumulative RAI dose of ≥600 mCi
Baseline demographics and patient characteristics were well balanced for both treatment groups (see Table 21). Metastases were present in the lungs in 86%, lymph nodes in 51% and bone in 27% of the patients. Almost all patients had thyroidectomy (99.5%) and had a median delivered cumulative radioactive activity of approximately 400 mCi. As per central histology review, the diagnoses were primarily papillary carcinoma (56.8%), followed by follicular (25.4%) and poorly differentiated carcinoma (9.6%).
Table 21: Demographic and Baseline Characteristics (Study 41295, FAS)
| Characteristic | Sorafenib N = 207 | Placebo N = 210 |
| Sex [n, (%)] | ||
| Male | 104 (50.2%) | 95 (45.2%) |
| Female | 103 (49.8%) | 115 (54.8%) |
| Age (years) at enrollment | 63.0 (24 – 82) | 63.0 (30 – 87) |
| Median (range) | ||
| ECOG performance status | ||
| 0 | 130 (62.8%) | 129 (61.4%) |
| 1 | 69 (33.3%) | 74 (35.2%) |
| 2 | 7 (3.4%) | 6 (2.9%) |
The median duration of therapy in the double-blind period was 46 weeks (range 0.3 to 135) for patients receiving sorafenib tablets and 28 weeks (range 1.7 to 132) for patients receiving placebo.
The full analysis set included 207 patients randomized to sorafenib tablets 400 mg twice daily and 210 patients randomized to placebo. Randomization was stratified by age (<60 years versus ≥60 years) and geographical region (North America, Europe, and Asia). PFS was evaluated by blinded independent radiological review using RECIST criteria v.1.0 modified to include clinical progression of bone lesions based on the need for external beam radiation.
Median PFS time was 329 days (10.8 months) in the sorafenib tablets group compared to 175 days (5.8 months) in the placebo group with a Hazard Ratio (HR) =0.587; 95% Confidence Interval (CI): 0.454, 0.758; two-sided p <0.0001) (see Table 22 and Figure 7).
The effect of sorafenib tablets on PFS was consistent across all subsets including geographic region, age above or below 60 years, gender, histological subtype, tumour burden and presence or absence of bone metastasis.
There was no statistical difference in overall survival between the treatment groups (the HR was 0.80; 95% CI:0.54, 1.19, two-sided p value of 0.2762; Table 22). The median OS was not reached for either arm. One hundred fifty (71.4%) patients randomized to placebo and 55 (26.6%) patients randomized to sorafenib tablets received open-label sorafenib tablets.
Table 22: Efficacy Results from Study 14295 in Differentiated Thyroid Cancer
| Efficacy Parameter | Sorafenib tablets (FAS, N=207) | Placebo (FAS, N=210) | P-valuec | HR (95% CI) |
| Efficacy Parameter | Sorafenib tablets (FAS, N=207) | Placebo (FAS, N=210) | P-valuec | HR (95% CI) |
| Progression-Free Survival (PFS) [median, months | 10.8 (9.1, 12.9) | 5.8 (5.3, 7.8) | <0.0001 | 0.59 (0.45, 0.76) |
| (95% CI)]a – FAS, N=417 | ||||
| Overall Survival (OS) | NE | NE | 0.2762 | 0.80 (0.54, 1.19) |
| Time to Progression (TTP) [median, months (95% CI)]a – FAS | 11.1 (9.3, 14.8) | 5.8 (5.3, 7.8) | <0.0001 | 0.56 (0.43, 0.72) |
| Response Rate (95% CI)b | 12% (7.6%, 16.8%) | 0.5% (0.01%, 2.7%) | <0.0001 | -- |
| Median Duration of Response, months (95%CI) | 10.2 (7.4, 16.6) | NE | -- | -- |
FAS = Full Analysis Set, CI = Confidence Interval, HR = Hazard Ratio (sorafenib tablets over placebo), NE = Not Estimable
- a Independent radiological review
- b All responses were partial responses
- c 2-sided p-value
Figure 7: Kaplan-Meier Curve of Progression-free Survival in Study 14295, Full Analysis Set
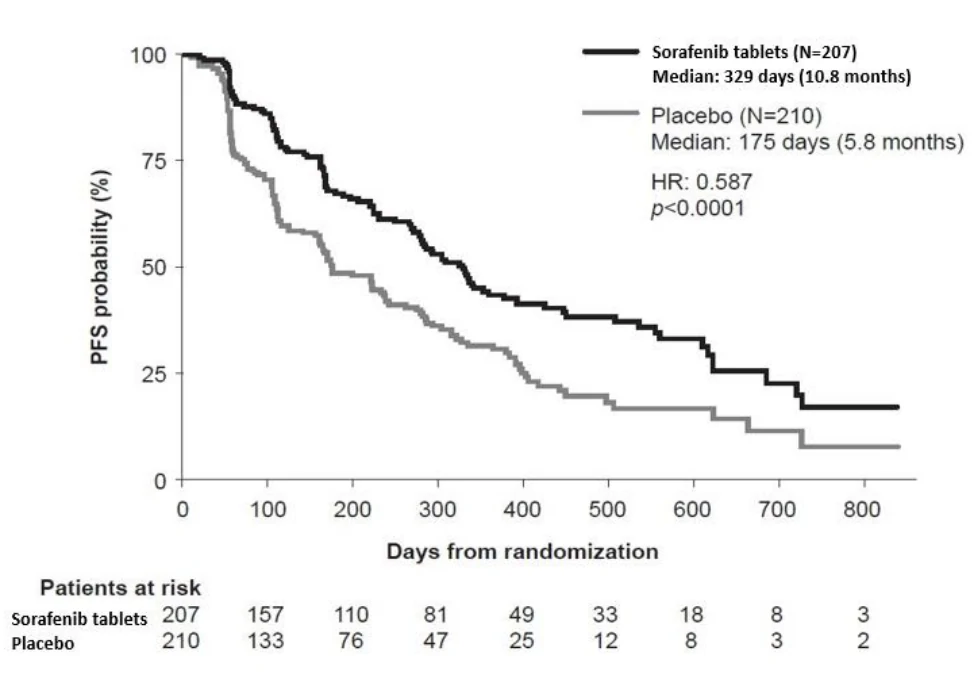
14.2 Comparative Bioavailability Studies
A blinded, randomized, two-treatment, three-period, reference-replicated, single oral dose (1 x 200 mg), crossover comparative bioavailability study of APO-SORAFENIB tablets 200 mg
(Apotex Inc.) and NEXAVAR® tablets 200 mg (Bayer Inc.), was conducted in healthy, adult male subjects under fasting conditions. Comparative bioavailability data from 39 subjects that were included in the statistical analysis are presented in the following table:
Sorafenib (1 x 200 mg) Geometric Mean Arithmetic Mean (CV%) | ||||
| Parameter | Test1 | Reference2 | % Ratio of Geometric Means | 90% Confidence Interval |
AUC0-72 (ng·h/mL) | 37973.82 40565.17 (35.2) | 33714.29 37835.59 (44.0) | 112.6 | 99.8- 127.1 |
AUCI (ng·h/mL) | 45921.33 48983.63 (37.9) | 42150.10 46473.02 (46.7) | 108.9 | 94.9 – 125.1 |
Cmax (ng/mL) | 1701.09 1880.20 (42.7) | 1446.66 1666.28 (54.3) | 117.6 | 103.2 – 134.0 |
| Tmax3(h) | 4.48 (40.3) | 4.98 (61.7) | ||
| T1/23 (h) | 26.90 (27.9) | 26.85 (38.9) | ||
1 APO-SORAFENIB (Sorafenib as sorafenib tosylate) tablets, 200 mg (Apotex Inc.) 2 NEXAVAR® (Sorafenib as sorafenib tosylate) tablets, 200 mg (Bayer Inc. Canada). 3 Expressed as the arithmetic means (CV%) only. Bioequivalence acceptance limits were scaled to the within-subject Reference variability for AUC0-72 | ||||
15 Microbiology
No microbiological information is required for this drug product.
16 Non-Clinical Toxicology
General Toxicology
The highest single oral sorafenib dose of 1460 mg/kg applied to rats and mice was tolerated without any sign of toxicity. In dogs, a single oral sorafenib dose of 1000 mg/kg was well tolerated; the only sign of toxicity was vomiting.
Short-term repeated daily administration of sorafenib was relatively well tolerated in animals. Cumulative toxicity was evident after long-term administration (rats up to 6 months, mice up 3 months, dogs up to 12 months) with a decrease of the threshold dose for significant lesions with duration of exposure. Remarkable clinical signs of toxicity consisted of skin reactions and bloody diarrhea in dogs. Hematological changes were moderate, blood clinical chemistry revealed mainly signs of hepatic toxicity. Histopathology revealed degeneration and regeneration/repair processes in multiple organ systems including liver, kidneys, lymphoreticular/hematopoietic system, gastrointestinal tract, pancreas, adrenals, reproductive organs, skin, teeth, and bone. The majority of morphological lesions was fully reversible or showed at least a tendency for recovery.
The maximum tolerable long-term dose based on survival was 2.5 mg/kg/day (15 mg/m2/day, AUC0-24h about 34 mg∙h/L) in rats, 100 mg/kg/day (300 mg/m2/day, AUC0-24h about 147 mg∙h/L) in mice, and 30 mg/kg/day (600 mg/m2/day, AUC0-24h about 22 mg∙h/L) in dogs.
Significant toxicities in animals were observed at doses and corresponding plasma concentrations of sorafenib that were in the range of or below those in cancer patients after the recommended daily dose of 400 mg bid sorafenib.
Genotoxicity
Positive genotoxic effects were obtained for sorafenib in an in vitro mammalian cell assay (Chinese hamster ovary) for clastogenicity (chromosome aberrations) in the presence of metabolic activation. One intermediate in the manufacturing process, which is also present in the final drug substance (< 0.15%), was positive for mutagenesis in an in vitro bacterial cell assay (Ames test). Sorafenib was not genotoxic in the Ames test (the material contained the intermediate at 0.34%) and in an in vivo mouse micronucleus assay.
Carcinogenicity
Carcinogenicity studies have not been performed with sorafenib.
Reproductive and developmental toxicology
Results from the repeat-dose toxicity studies indicate a potential of sorafenib to impair reproduction performance and fertility – various effects were observed in male and female reproductive organs. In developmental toxicity studies in rats and rabbits, the no observed adverse-effect-level was determined to be 0.2 mg/kg/day in rats and 1 mg/kg/day in rabbits. At the next highest dose level tested, clear embryo-fetal toxicity and teratogenicity were demonstrated at oral doses of 1 mg/kg/day in rats and 3 mg/kg/day in rabbits.
Juvenile Toxicity
Based on findings in repeat-dose toxicity studies using animals, there is a potential risk to children and adolescents regarding effects on structure and composition of bone and teeth.
Special Toxicology
Toxicological evaluations of the main human metabolite (M-2) and of impurities in the drug substance indicated no significant contribution to the overall toxicological profile and risk assessment.
Pharmacology
Sorafenib is a multikinase inhibitor that decreases cell proliferation of some tumour cell lines in vitro.
Sorafenib inhibits tumour growth of the murine renal cell carcinoma, RENCA, and a broad spectrum of human tumour xenografts (786-O, HCT-116, NCI-H460, MiaPaCa-2, SK-OV-3, DLD-1, A549, CAKI-1, LOX, NCI-H23, MDA-MB-231, COLO-235, HT-29, MV4;11, PLC-PRF-5, BxPC3, UACC-62 and PC3) in athymic mice accompanied by a reduction of tumour angiogenesis. Sorafenib inhibits the activity of targets present in the tumour cell (CRAF, BRAF, V600E BRAF, KIT, and FLT-3) and in the tumour vasculature (CRAF, VEGFR-2, VEGFR-
3, and PDGFR-ß). RAF kinases are serine/threonine kinases, whereas KIT, FLT-3, VEGFR-2, VEGFR 3, and PDGFR-ß are receptor tyrosine kinases. Mutation of BRAF has been associated with melanoma, KIT has been associated with gastrointestinal stromal tumours, and FLT-3 has been associated with acute myelogenous leukemia. In summary, sorafenib is a dual action RAF kinase and VEGFR inhibitor that targets tumour cell proliferation and tumour angiogenesis.
Safety Pharmacology
A comprehensive program of safety pharmacology studies was conducted with sorafenib. Cardiac and pulmonary functions were investigated in dehydrobenzperidol/fentanyl/nitrous oxide anesthetized dogs (N=3/dose) after single intraduodenal doses of 10, 30, and 60 mg/kg. The mean Cmax was only 2.84 mg/L after the 60 mg/kg dose (less than the mean Cmax for the therapeutic dose at steady-state in humans). Heart rate was decreased at 30 mg/kg and 60 mg/kg sorafenib. The potential effects of the main human metabolite M-2 (which is absent in dogs) on blood pressure, heart rate and ECG parameters, were not examined in these studies.
Potential effects on diuresis, blood pharmacological parameters, blood glucose, CNS function, and gastrointestinal (GI) tract were investigated in rats after single oral doses. The results did not indicate relevant adverse findings.
The effects of sorafenib on hERG potassium ion channels were studied in Chinese Hamster Ovary cells stably transfected with hERG cDNA (N=3-12/treatment). The mean percentage block of the hERG current was 11% at 1 mcM, 19% at 3 mcM, and 37% at 10 mcM sorafenib (nominal concentrations) versus 0% for vehicle.
The effects of sorafenib on the action potential were tested in isolated rabbit cardiac Purkinje fibres (N=4 to 5/treatment). The mean increase in the action potential duration at 90% repolarization was 14.0 ms at 0.1 mcM, 17.6 ms at 10 mcM, and 28.8 ms at 20 mcM (nominal concentrations) versus 0 ms for vehicle. The plateau of the action potential was depressed in a concentration-dependent manner.
Pharmacokinetics
The protein binding of sorafenib was high and species-dependent. The fraction unbound to plasma proteins (fu) was about 0.5% in mouse, rat, and man, 0.9% in dogs, and 2.0% in rabbits, respectively. Albumin was identified as an important binding component in human plasma.
In vitro studies with cultured human hepatocytes indicated that sorafenib exhibited no inductive potential on major CYP isoforms. The inhibitory effect of sorafenib on different CYP and UGT isoforms has been studied in human liver microsomes in vitro. Sorafenib inhibits glucuronidation by the UGT1A1 and UGT1A9 pathways. Systemic exposure to substrates of UGT1A1 and UGT1A9 may be increased when coadministered with sorafenib. Only small inhibitory effects on CYP2C19, CYP2D6 and CYP3A4 were observed, as indicated by Ki values of 17mcM, 22mcM, and 29mcM. Sorafenib inhibits CYP2B6 and CYP2C8 in vitro with Ki values of 6 and 1 to 2 mcM, respectively. Systemic exposure to substrates of CYP2B6 and CYP2C8 may increase when coadministered with sorafenib. Sorafenib is a competitive inhibitor of CYP2C9 with a Ki value of 7 to 8 mcM.
In rats, [14C] sorafenib and/or its radiolabeled metabolites penetrated the placental barrier at a low to moderate extent. The radioactivity was homogeneously distributed to most fetal organs and tissues. None of the fetal organs and tissues exceeded the analogous maternal organ/tissue exposure, except fetal brain where exposure was 2.3 fold higher than in the brain of the dams. After oral administration of [14C] sorafenib tosylate, the radioactivity was secreted to a remarkable amount into the milk of lactating rats.
17 Supporting Product Monographs
- 1. NEXAVAR® (sorafenib tablets, 200 mg), control 292117, product monograph, Bayer Inc. (2025-06-05)